Port of Tallinn An Essential Baltic Marine Infrastructure Hub - Investor - Tallinna Sadam
←
→
Page content transcription
If your browser does not render page correctly, please read the page content below
Port of Tallinn
An Essential Baltic Marine Infrastructure Hub
May 2018
Disclaimer

By attending this meeting where this presentation is made, or by reading the presentation slides or by accepting delivery of this document, you agree to be bound by the following limitations.

These materials have been prepared by Aksiaselts TALLINNA SADAM (the “Company”) and comprises the written materials solely for use in discussions with a limited number of prospective investors in connection with the initial public
offering and sale of securities of the Company (the “Offering”). These materials are for the exclusive use of the persons attending an oral briefing, to which these materials relate, given by authorised representatives of the Company (the
“Recipients”). These materials are being provided to the Recipients for information purposes only.

The Offering will be based on a prospectus prepared for that purpose. Any decision to purchase or subscribe for any securities of the Company should be made solely on the basis of the information contained in such prospectus that may
be published by the Company in connection with the Offering. The information and opinions contained in this document and any other material discussed at the presentation are provided as at the date of the presentation and are subject to
change. The information contained in this document and in the presentation does not purport to be comprehensive. None of Carnegie Investment Bank AB or Citigroup Global Markets Limited (the “Joint Global Coordinators”), Erste Group
Bank AG, and Swedbank AS (the “Joint Bookrunners”), AS LHV Pank (the "Joint Lead Manager", and together with the Joint Global Coordinators and the Joint Bookrunners, the ("Managers") or any of their respective subsidiary
undertakings, or their respective advisers, agents, directors, officers, employees or affiliates nor such respective affiliates’ advisers, agents, directors, officers or employees has independently verified any information herein. The Managers
are acting only for the Company in connection with the Offering and no one else and will not be responsible to anyone other than the Company for providing the protections afforded to their respective clients or for providing advice in relation
to the Offering or any transaction or arrangement referred to in this presentation.

This presentation is an advertisement and is not a prospectus for the purposes of EU Directive 2003/71/EC, as amended (the "Directive") and/or the Estonian Securities Market Act (the “SMA”). Investors should not subscribe for any
securities referred to in this presentation except on the basis of information contained in the prospectus and its supplements (the “Prospectus”) as approved by the Estonian Financial Supervision Authority (the “EFSA”) and made available
to the public in accordance with the Directive. The Prospectus is available on the website of the EFSA and of the Company and an electronic or hard copy of the Prospectus may be requested from the Company.

These materials speak only as of their date, and the views expressed are subject to change based upon a number of factors, including, without limitation, macroeconomic and equity market conditions, investor attitude and demand, the
business prospects of the Company and other specific issues. These materials and the conclusions contained herein are necessarily based on economic, market and other conditions, as in effect on, and the information available to the
Company as of, their date. These materials do not purport to contain a complete description of the Company or the market(s) in which the Company operates, nor do they provide an audited valuation of the Company. The analyses
contained in these materials are not, and do not purport to be, appraisals of the assets, stock or business of the Company or any other person. Moreover, these materials are incomplete without reference to, and should be viewed and
considered solely in conjunction with, the oral briefing provided by an authorised representative of the Company in relation to these materials.

The Company strongly suggests that each Recipient seeks its own independent advice in relation to any investment, financial, legal, tax, accounting or regulatory issues discussed herein. Nothing herein should be construed as financial,
legal, tax, accounting, actuarial or other specialist advice. In particular, nothing herein shall be taken as constituting the giving of investment advice and these materials are not intended to provide, and must not be taken as, the exclusive
basis of any investment decision or other valuation and should not be considered as a recommendation by the Company (or any of its affiliates) that any Recipient enters into any transaction. Each Recipient must make its own independent
assessment and such investigation as such Recipient deems necessary to determine its interest in participating in any transaction. No reliance should be placed upon these materials in connection with any actual mandate or transaction.
These materials comprise a general summary of certain matters in connection with the Company. These materials do not purport to contain all of the information that any Recipient may require to make a decision with regards to any
transaction. Any decision as to whether or not to enter into any transaction should be taken solely by the relevant Recipient. Before entering into such transaction, each Recipient should take steps to ensure that it fully understands such
transaction and has made an independent assessment of the appropriateness of such transaction in the light of its own objectives and circumstances, including the possible risks and benefits of entering into such transaction.

These materials have been provided to the Recipients on the basis that each Recipient and such Recipient’s representatives, directors, officers, employees and professional advisers keep these materials (and any other information that
may be provided to such Recipient) confidential. These materials (and any other information which may be provided to any Recipient) may not be disclosed, in whole or in part, or summarized or otherwise reproduced, distributed or referred
to, in whole or in part, without the prior written consent of the Company. The information used in preparing these materials was obtained by the Company or its representatives from public sources and is subject to change without notice.
None of the Company, any of its affiliates or the Managers assumes any responsibility for the independent verification of any such information and has relied on such information being complete and accurate in all material respects. None of
the Company, any of its affiliates (nor any of its or their respective directors, officers, employees, professional advisers or representatives) or the Managers makes any representation or warranty, express or implied, with respect to the
fairness, correctness, accuracy, reasonableness or completeness of such information, these materials (including, without limitation, any opinion contained therein), any of their contents or any of the results that can be derived from these
materials. Without limiting a person’s liability for fraud, no responsibility or liability (whether in contract, tort or otherwise) is or will be accepted by the Company (or any of its affiliates or any of its or their respective directors, officers,
representatives, employees, advisers or agents) or the Managers as to, or in relation to, these materials, their contents, the accuracy, reliability, adequacy or completeness of the information used in preparing these materials, any of the
results that can be derived from these materials or any written or oral information provided in connection therewith (including, without limitation, any responsibility or liability (i) in relation to the distribution of possession of these materials in
any jurisdiction or (ii) for any loss or damage of any kind whatsoever arising as a result of the use or misuse of these materials) and any such responsibility, liability or obligation is expressly disclaimed, except to the extent that such
responsibility, liability or obligation cannot be excluded by law. Analyses and opinions contained herein may be based on assumptions that, if altered, can change the analyses or opinions expressed. No audit of these materials has been
undertaken by an independent third party.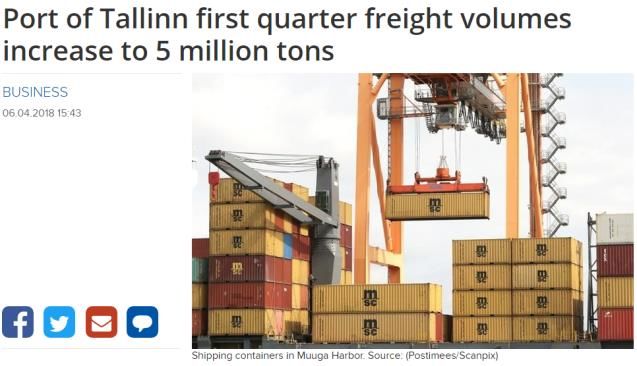
Disclaimer (cont’d)

Any statement, estimate or projection included in these materials (or upon which any of the conclusions contained herein are based) with respect to anticipated future performance (including, without limitation, any statement, estimate or
projection with respect to the condition (financial or otherwise), prospects, business strategy, plans or objectives of the Company and/or any of its affiliates) may prove not to be correct. No representation or warranty is given as to the
completeness or accuracy of any forward-looking statement contained in these materials or the accuracy of any of the underlying assumptions. Nothing contained herein shall constitute any representation or warranty as to the future
performance of the Company, any financial instrument, credit, currency rate or other market or economic measure. Information about past performance given in these materials is given for illustrative purposes only and should not be relied
upon as, and is not, an indication of future performance. None of the Company, any of its affiliates or the Managers has verified the achievability of any estimate or forecast of future financial performance contained herein (including, without
limitation, any estimate of potential cost savings and synergies), nor of any of the methods underlying the preparation of any such estimate or forecast.

None of the Company, any of its affiliates or the Managers accepts or will accept any responsibility, duty of care, liability or obligation for providing any Recipient with access to additional information, for updating, modifying or otherwise
revising these materials or any of their contents (including, without limitation, any estimate or forecast of future financial performance), for correcting any inaccuracy in these materials or their contents (or any other written information or oral
information provided in connection therewith) which may become apparent, or for notifying any Recipient or any other person of any such inaccuracy.

These materials shall not be construed as a prospectus or an offer to sell, or a solicitation of an offer to buy, any security or any business or assets, nor to enter into any agreement or contract with any Recipient, the Company (or any of
their respective affiliates) or any other person, nor to provide further information or to engage in negotiations with any Recipient. Any potential transaction that may be related to the subject matter of these materials will be made pursuant to
separate and distinct documentation and in such case the information contained herein will be superseded in its entirety by such documentation in final form. These materials do not create any obligation on the part of the Company to
consider any offer from any Recipient or any other person. The Company reserves the right, without prior notice and without giving reasons, to vary or terminate the sale process, to reject any or all proposals and/or to negotiate with any
Recipient or any other person on any terms (and whether individually or simultaneously with any other person or persons) with respect to any transaction involving the Company.

This document has been prepared by the Company solely for use at the presentation to a limited number of prospective investors held in connection with the Offering. Neither this document nor any part or copy of it may be taken or
transmitted into the United States or distributed, directly or indirectly, in the United States, as that term is defined in the U.S. Securities Act of 1933, as amended (the “U.S. Securities Act”).

The Company does not expect to register any securities that it may offer under the U.S. Securities Act and any such securities may not be offered or sold in the United States absent registration under that Act or an available exemption
from it. There will be no public offering in the United States. Neither this document nor any part or copy of it may be taken or transmitted into the United States, Australia, Canada or Japan or be distributed directly or indirectly into the United
States, Australia, Canada or Japan, or to any other country where such distribution may lead to a breach of any law or regulatory requirement. Any failure to comply with this restriction may constitute a violation of US, Australian, Canadian
or Japanese securities laws. Persons into whose possession this document comes should observe all relevant restrictions.

This presentation is only addressed to and directed at persons in member states of the European Economic Area (“EEA”) who are “qualified investors” within the meaning of Article 2(1)(e) of the Directive (“Qualified Investors”). In addition,
in the United Kingdom, this presentation is being distributed only to, and is directed only at (i) “investment professionals” falling within Article 19(5) of the Financial Services and Markets Act 2000 (Financial Promotion) Order 2005, as
amended (the “Order”) or (ii) high net worth entities and other persons to whom it may lawfully be communicated, falling within Article 49(2)(a) to (d) of the Order (all such persons together being referred to as “Relevant Persons”). This
document must not be acted on or relied on (i) in the United Kingdom, by persons who are not Relevant Persons, and (ii) in any member state of the EEA other than the United Kingdom, by persons who are not Qualified Investors. Any
investment or investment activity to which this document relates is available only to Relevant Persons or Qualified Investors or will be engaged in only with Relevant Persons or Qualified Investors. Nothing in this presentation constitutes
investment advice and any recommendations that may be contained herein have not been based upon a consideration of the investment objectives, financial situation or particular needs of any specific recipient. No reliance may or should
be placed by any person not invited to this presentation for any purposes whatsoever on the information contained in this document or any other material discussed at this presentation, or on its completeness, accuracy or fairness. If you
have received this document and you are not a Relevant Person or Qualified Investor you must return it immediately to the Company.

Information provided in these materials on the market environment, market developments, growth rates, market trends and on the competitive situation in the markets and regions in which the Company operates is based on data, statistical
information and reports by several third parties and/or prepared by the Company based on its own information and information derived from such third-party sources.

By accepting these materials, each Recipient represents and warrants that it is able to receive them without contravention of any unfulfilled registration requirements or other legal or regulatory restrictions in the jurisdiction in which such
Recipient resides or conducts business. In addition, the Recipient agrees to be bound by the foregoing limitations and conditions and, in particular, will be taken to have represented, warranted and undertaken that it has read and agreed to
comply with the contents of this notice including, without limitation, the obligation to keep this presentation and its contents confidential.
Port of Tallinn: Landlord Port Supporting a Strong Dividend Profile

       I. Introduction to Port of Tallinn                             2

       II. Key Investment Highlights                                  8

       Further Detail: Deep Dive on Select Themes                     19

       Further Detail: Historical Operational and Financial Results   23
An Attractive Investment Proposition – Delivering Shareholder Value

                                                                                                           Resilient landlord infrastructure business model

                                      DIVERSIFICATION                                                                                             PROFITABILITY                                                                               CASH FLOW GENERATION

                            2017 Revenue Breakdown:                                                                                2017 Adjusted EBITDA Margin                                                                                      2017 Cash Conversion(3)
                                     €121m                                                                                                                               Peers Average(2)                                                  76%                                      Peers Average(2)
                                                                                                                                55%
                                                                                                                                                                                     52%
                                                                                                                                                                   48%                                                                        Adjusted for
                                                     4%                                                                                                                                                                                                                                         65%
                                                                                                                                                                                                                                              one-off ferry                   58%
                                                                                                                                                                                                                                                                                                                 54%
                                         22%                                                                                                                                                                                                 capex of €20m
                                                                     41%
                                                                                                                                                                                                                                           46%

                                                                                                                                                                                                      12%
                                              33%

                                (1)                    (1)                                           (1)
                       PAX                  Cargo                   Ferry                 Other
                                                                                                                                                                  Airports           Ports             Ferry                                                                 Airports           Ports             Ferry

                                                                                                                                     STRONG DIVIDEND PROFILE

                                      ✓                              €28m                                                        ✓                                €30m                                                         ✓                                70%
                                         Last 10 years’ average annual                         dividend (4)                               2019-20 minimum annual                        dividend(5)                                    Minimum payout policy(5) from 2021

Source: Company. Factset.
Note: (1) PAX refers to Passenger Harbours segment, Cargo refers to Cargo Harbours segment, Other includes Botnica revenue. (2) Data sourced from company reports. Airports peers: Aena, AdP, Fraport, Flughafen Wien, Flughafen Zurich. Ports peers: GPH, NCSP, HHLA, Luka Kooper, Global Ports. Ferry peers: Tallink, Viking Line. (3)
Calculated as (Adjusted EBITDA – Capex) / Adjusted EBITDA. (4) Excludes 2018 declared dividend of €105m. (5) The dividend policy excludes any one-off effects and is subject to market conditions, growth and development plans and the need to maintain a reasonable level of liquidity.
 2
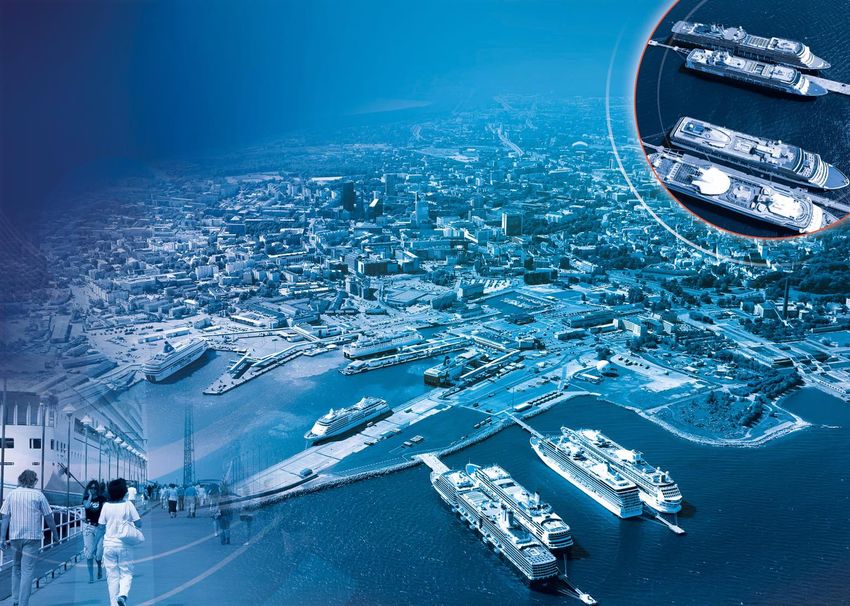
An Essential Baltic Marine Infrastructure Hub
Strategic Geographical Location Key Highlights
Multimodal marine infrastructure connecting with sea, road, rail and
FINLAND air
NORWAY
Turku
N Primorsk
Helsinki
Oslo St. Petersburg 10.6m(2) passengers serviced in 2017, including 0.6m cruise
tourists
82km(1) Muuga Ust-Luga
Stockholm Tallinn
Paldiski
W E 6,039 passenger / cruise ship calls and 1,677 cargo ship calls in
SWEDEN 380km(1) Saarema ESTONIA
RUSSIA 2017
Riga
Ventspils
DENMARK LATVIA
S 19.2m tonnes of cargo handled in 2017
Copenhagen
LITHUANIA
Klaipeda
Gdansk
GERMANY Rostock RUSSIA Operator of 2 largest domestic ferry routes:
BELARUS
POLAND ▪ 2.2m ferry passengers and 1.0m vehicles carried in 2017
Operated Ferry Routes City Centre Proximity
Port digitalisation leadership (e.g. SmartPort(3) for passengers,
Tallinn City Centre
Single Window(4) for vessels)
Hiiumaa Rohuküla N
Heltermaa W E
Old City
S Harbour
Virtsu
Kuivastu Excellent HSSE(5) track record; ISO Quality and Environmental
Saaremaa Old
Town
Management System compliance since 2003
Vision to become the most innovative port in the Baltic Sea region
Source: Company.
Note: (1) Air travel distance. (2) Excluding domestic ferry service passengers. (3) SmartPort system is a comprehensive IT platform, aiming at connecting all port devices, by interlinking the information and communication systems. (4) Single Window is a system through which the users (ship operators or authorized agents) are able to provide all
necessary information (“FAL forms”) only once, while the system is able to interpret, combine and distribute this information for processing to the European network (SafeSeaNet) and the National Agencies involved. (5) HSSE: Health, Safety, Security and Environment.
3
A Well Balanced Business Profile
1 3
5 4
Estonia
2 5
Passenger Harbours Cargo Harbours(1) Ferry 5
• Provision of infrastructure for vessels and • Provision of infrastructure for vessels and • Infrastructure provider between
servicing of passengers and vehicles cargo operators Estonian mainland and two of the
Scope of • Lines serviced include: Tallinn – Helsinki, • Liquid bulk, Ro-Ro, dry bulk, containers, largest islands
Services Tallinn – Stockholm, Tallinn – St. Petersburg general cargo • Services provided on 2 routes with 5
• Serving PAX vessels’ Ro-Ro cargo ferries, 4 of which are newbuilds(3)
• Operating under a 10-year service
Old City Muuga agreement with the Estonian Road
Administration(2) until Q3 2026
1 • One of the
3 • Biggest cargo
busiest PAX harbour in
ports in Europe Estonia
• Handles Other
almost all of Icebreaking (MPSV Botnica)
PoT PAX • 10-year agreement for icebreaking
services with the Estonian Maritime
Key Administration(2) until Q2 2022
Harbours covering northern Estonian ports
Saaremaa Paldiski South
• Looking to provide various maritime
2 • Potential to
4 • Primarily
support operations from May to Nov
host regional handles
and cruise Estonian export Waste Management
ships and import cargo
and transit cargo • Waste management through a 51%
stake in Green Marine joint venture
• Outsized goods
handling
capacity
Source: Company.
Note: (1) Excludes Paljasaare harbour which has minimal ongoing operations and is in the process of being divested. (2) A government agency. (3) For the summer peak months, TS Laevad OÜ has rented an additional vessel, with the rental period commencing on 4 June 2018 and terminating on 30 August 2018 (which can be extended by one
day).
4
Passenger Harbours Business Model – Maritime Gateway into Estonia

                                                                                                        2017 Revenue Breakdown                                                                                                                               2017 Contribution
                                                                                                                                                                                                                                                                  Revenue
                                                      4%
                                                            (1)                                                                                                                        Rental Income
                                                      4%                                                                          • Fixed lease income from operators using PoT’s land and                                                                        41%
                                                      3%
                                                                                                                                    premises (commercial operators e.g. shops, restaurants)

                                                                                                                                                                                      Cargo Charges                                                            Adjusted EBITDA
                                                     34%                                                                          • Pre-agreed tariffs for Ro-Ro cargo carried on PAX vessels
                                                                                                                                                                                                                                                                  50%

                                                                                                                                                                                      Passenger Fees
                                                                                                                                   • Passenger fees per passenger based on public price list
                                                                                                                                   • Line and cruise passengers fees are based on the similar                                                                 Key Customers
                                                                                                                                                                                                                                                                   Cruise
                                                                                                                                     model, but have different tariffs
                                                                                                                                                                                                                                                                Regular Lines

                                                     55%                                                                                                  Vessel Charges
                                                                                                                                   • Tonnage charges based on gross tonnage separately for
                                                                                                                                     each call of the vessel based on public price list
                                                                                                                                                                                                                                                                      Cruise
                                                                                                                                   • Waste fee based on vessel gross tonnage for each vessel
                                                                                                                                     call, in case of passenger ships for one call per day
                                                                                                                                   • Mooring charge based on the gross tonnage of the vessel

            ✓              Natural monopoly(2)                                                                                 ✓               Resilient PAX flow                                                                           ✓   Blue-chip customers

Source: Company.
Note: (1) Other includes sales of utility and other services. (2) Port of Tallinn is subject to limitations of a market-dominant company in the passenger business, but not subject to tariffs coordination by the Competition Authority.
 5
Cargo Harbours Business Model – Landlord Infrastructure Provider
2017 Revenue Breakdown 2017 Contribution
Revenue
2%(1) Sales of Electricity
12% • Calculated based on the readings of customers electricity 33%
meters(3)
Rental Income Adjusted EBITDA
24%
• Fixed lease income from operators using PoT’s land and
facilities 35%
16% Cargo Charges
• Pre-agreed tariff based charges (volume x tariff = charge)
• Cargo charges agreed separately from operator to Key Customers
Cruise
operator Terminal Operators
• Contractual penalties if terminal operators fail to handle (2)
pre-agreed minimum amounts of cargo
46%
Vessel Charges
Shipping Lines
• Tonnage charges based on vessel gross tonnage
• Waste fee
• Mooring
Diversified cargo Long term rental Defined minimum Blue-chip
✓ ✓ ✓ ✓
mix agreements volumes customers
Source: Company.
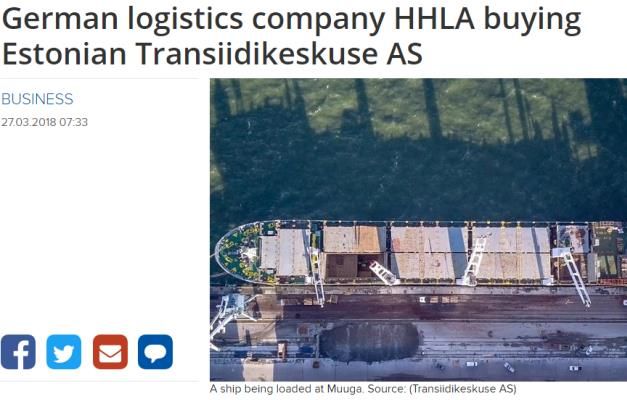
Note: (1) Other includes passenger fees and sales of other services. (2) HHLA’s acquisition of PoT’s existing customer Transiidikeskuse AS announced in March 2018. (3) Electricity network fees of the Company are regulated by the Estonian Competition Authority.
6
Ferry Business Model – Fully Subsidised Revenue Stream

                                                                                            Ferry Service Business Model                                                                                                                                                                      2017 Contribution
                                                                                                                                                                                                                                                                                                            Revenue

                                                                                                            Contract                                Means of                                                                                                                                              22%
                     Voyage Fee                                                                             Income                                  Payments
       • Coverage of flexible cost,
         EUR/voyage
                                                                                                                ~ 20%
       • Indexed to fuel price (90%) and CPI                                                                                                                                                                                                                                                       Adjusted EBITDA
         (10%)                                                                                                                                           ~ 40%                                         Ticket Sales

                                                                                                                                                                                                                                                                                                         13%
                    Variable Fee                                                                                ~ 30%
       • Coverage of fixed operating cost,
         EUR/year basis
       • Indexed to CPI (65%) and the
                                                                                                                                                                                                                                                                                                        Customer
                                                                                                                                                                                                                                                                                                          Cruise
         Estonian wage inflation index (35%)
                                                                                                                                                                                            Subsidy
                                                                                                                                                         ~ 60%                • Delta between contract income
                     Fixed Fee                                                                                  ~ 50%                                                           and tickets sales
       • Coverage of capital and interest cost,
         EUR/year basis

                                                                                                              Contract                                Collection                                                                                                                                      State of Estonia(1)

                          Long term, fully subsidised                                                                                    Fees indexed to fuel price, CPI,                                                                               Number of passengers or vehicles
           ✓                                                                                                              ✓                                                                                                              ✓
                          income stream                                                                                                  wage index                                                                                                     are not drivers of income

Source: Company.
Note: (1) The contract counterparty is the Estonian Road Administration (a government agency). The Ministry of Economic Affairs and Communications holds a call option on the vessel(s) at the end of the concession period, for the consideration of €26.6m per vessel, subject to adjustment in accordance with the provisions of the concession
agreement.
 7
Port of Tallinn: Landlord Port Supporting a Strong Dividend Profile
I. Introduction to Port of Tallinn 2
II. Key Investment Highlights 8
Further Detail: Deep Dive on Select Themes 19
Further Detail: Historical Operational and Financial Results 23Key Investment Highlights
1 Attractive Macro and Industry Dynamics Driving Continued Regional Demand for Port Infrastructure
Multimodal Marine Infrastructure with a Strong Competitive Position Supported by Nordic
2 Links
3 Track Record of Operational Excellence and Innovation
4 Landlord Port with Diversified and Stable Revenue Streams
5 Substantial Cash Flow Generation
6 Broad Range of Attractive Strategic Initiatives to Maximise Existing Portfolio Value
7 Highly Experienced Management and a Supportive Governance Framework
8Attractive Macro and Industry Dynamics Driving Continued
1
Regional Demand for Port Infrastructure
Attractive Regional Macro Outlook Large Scale Investment Driving Demand for Port Infrastructure
2016-2020E GDP CAGR(1) North – South Initiatives Leading
Institution /
Baltic Sea Region Country
3.7% 3.5% 3.3% 3.3% 1 Rail Baltica European
Union
2.5%
2.1%
N
1.7% 1.8% Cooperation with Port of Helsinki
2 and others (e.g. via EU-funded European
projects) Union
S National railway cargo operator
3
initiatives Estonia
Latvia Estonia Lithuania Poland Sweden Finland Russia European
Union
Nordic cargo and passenger flows supported by the development of
North – South transportation route
Increasing Influx of Travellers
2012-2016 Number of Non-Residents Visiting Estonia(2) East – West Initiatives Leading
Country
CAGR
Asian demand drivers
China One Belt and One Road
✓ Robust economic growth 1
25.5% initiative China
20.9% ✓ Demographic developments
✓ Flight connection investments W E High-Speed Railway (HSR) Russia
2
3.6% Eurasia
3.0% 2.2% Kazakhstan Belarus
Continued investment into East – West transportation route set to grow
China US European Finland Russia regional cargo transhipments
Union
Port of Tallinn is strategically positioned to service cargo and passenger flows into and through the Baltic Sea region
Note: (1) Source: The Economist Intelligence Unit. (2) Source: Eesti Pank (Estonian Central Bank).
9Multimodal Marine Infrastructure with a Strong Competitive
2
Position Supported by Nordic Links
One of the Largest Passenger Ports in Europe Largest Cargo Infrastructure Provider in Estonia
TallinnCity
Tallinn CityCentre
Centre Estonian Ports’
N Up to 18m natural depth 2017 Cargo Volumes(2)
Finland W E
Old City
S Harbour Others
Helsinki St. Petersburg
Sweden Kunda 7%
Old
Year-round navigable 4%
Town Pärnu
Stockholm 5%
Tallinn Connectivity by sea,
Estonia
Russia road, rail and air Paldiski
Nordic links Põhjasadam
• 2h voyages to Helsinki 10-15x(1) per day 8% PoT
Digitalisation leadership 53%
• Mini-cruises to Stockholm Proximity to
• Mini-cruises to St. Petersburg City Centre
Muuga port free zone Sillamäe
23%
Top 5 PAX Ports in Northern Well positioned for multimodal cargo transport through the region
Europe in 2017(2) (millions)
Helsinki 12.3
Essential Ferry Service Operator Between Estonian Mainland
2017 PAX Breakdown
Finland and Islands
Stockholm 11.8 Russia Other Estonia Fleet
Sweden 2% 14% Hiiumaa Rohuküla
Mainland
1 2
Sweden Heltermaa
3% Finland
Dover 11.7
UK Asia 48% Virtsu
Kuivastu
5% Saaremaa 3 4
10.6 Estonia
Estonia 28%
# Passengers (millions)
Calais 9.0 2.2 5
2.1 2.1
France
Excellent connectivity and well-developed port facilities enabling
significant passenger traffic growth 2015 2016 2017
Source: Company, Royal HaskoningDHV.
Note: (1) Depending on season. (2) Based on Royal HaskoningDHV and Port of Tallinn data.
103 Track Record of Operational Excellence and Innovation
Long Track Record of Operational Excellence and Innovation… … Leads to Significant Benefits to Both Customers and PoT
2012 Jan 2017 Digitalisation of logistics chain
Increased focus on enhancing Single Window
IT and documentation co-op agreement
management systems
Strong focus on
digitalisation SmartPort application
Oct 2016 Oct 2017
Jul 2013 Launch of Launch of
2010
Launched Single SmartPort SmartPort
IT equipment &
Window for system for system for
software upgrade SmartPort usage rate(4)
vessels ferries passengers
Passenger segment 100% Single Window user rate in
commercial vessel port calls
SmartPort
System 100% 100% SmartPort usage rate in ferries
84% segment
✓ Fast and efficient customer flows
▪ ~1 million cars serviced in 2017
✓ Integrated ERP(1) systems
Automatisation 8%
✓ All documentation electronically 51% of cars use e-ticket and automatic
& Digitalisation
✓ Close to real-time KPI(2) tracking traffic system
✓ Reduced bureaucracy 2017 2018E 2019E
✓ Long track record of operations enhancing investments
High customer satisfaction (NPS)
Customer ✓ Significant savings in port related costs NPS in ferry traffic to islands
Award winning port
✓ Award winning and the most innovative port in the Baltics
Centricity & 47
✓ High customer satisfaction due to smooth customer flows 37
LEAN ✓ Excellent labor relations and HSSE(3) track record
Operations ✓ ISO 9001:2008 Quality Management System
20
✓ ISO 14001:2004 Environmental Management System
2000 … 2012 2013 2014 2015 2016 2017 2018
Dec-2016 May-2017 Dec-2017
Vision to become the most innovative port in the Baltic Sea region to further strengthen its competitive position
Source: Company.
Notes: (1) ERP: Enterprise Resource Planning. (2) KPI: Key Performance Indicator. (3) HSSE: Health, Safety, Security and Environment. (4) SmartPort usage of all ship calls (RO-PAX line-traffic) in Old City Harbour. 2017: system launched in A/B terminal in October 2017. 2018E: Assuming A/B terminal full year + D terminal starting in 2018.
2019E: Assuming full year use in both terminals. Additional note: 100% SmartPort usage rate in ferry-traffic to islands (in 2017 ca 1 million cars serviced).
114 Landlord Port with Diversified and Stable Revenue Streams
High Visibility Income Diversified Revenue Streams from Blue-Chip Customers
2017 Revenue Breakdown
Landlord owner of port facilities with no concession renewal
limitations for its harbours PAX(4) Cargo(4)
Attractive competitive position as the main passenger port in Regular Cruise Terminal Shipping
PAX Lines Operators Lines
Tallinn(1)
Long term rental agreements (average remaining term 26 (5)
Cargo 41% 33%
years) with cargo operators with defined minimum volumes
Other(4) Ferry
Ferry 10-year service agreement with the state(2) expiring in Q3 2026 4%
Botnica 22% Customers
10-year charter agreement with the state(3) until Q2 2022 with a
Botnica
contracted formula for calculating Dec-Apr daily rate State of Estonia(3) State of Estonia(2)
Diversified Cargo Mix Resilient Passenger Volumes Growth
2017 Cargo Volume Breakdown # Total Passengers (millions)
2015 – 2017 CAGR 19.2m tonnes
Signs of liquid bulk 10.6
4.4% stabilisation – 10.2
(17.3%)
General cargo growing volumes in
4.7% 3% Liquid bulk 9.8
2017 Q4 and 2018 9.6
Containers - Ship Q1 (QoQ) 9.2
10% 25%
8.8
18.7%
Dry bulk (32.6%)
22% Liquid bulk
- Rail
8.2% 14%
RO-RO 2012 2013 2014 2015 2016 2017
26%
Source: Company.
Note: (1) Port of Tallinn is not subject to tariffs coordination by the Competition Authority but is subject to certain limitations of a market-dominant company. (2) Contract counterparty the Estonian Road Administration (a government agency) has a call option on the vessel(s) at the end of the concession period, for the consideration of €26.6m per
vessel, subject to adjustment in accordance with the provisions of the concession agreement. (3) Contract counterparty is the Estonian Maritime Administration (a government agency). (4) PAX refers to Passenger Harbours segment, Cargo refers to Cargo Harbours segment, Other includes Botnica revenue. (5) HHLA’s acquisition of PoT’s
existing customer Transiidikeskuse AS announced in March 2018.
125 Substantial Cash Flow Generation
Strong Margins… …with Major Investments Completed in Recent Years…
Capex
Adjusted EBITDA(1) ✓ 4 newbuild ferries
& Margin €65m
Moderate EBITDA growth
driven by Passenger €43m
€66m €67m ✓ €36m ✓ 5th ferry acquisition (used)
€63m Harbours and introduction
of the Ferry business
67% 64% ✓ Upgrade of passenger quays
55%
2015 2016 2017
Margin evolution driven by
✓ ✓ Old City Harbour traffic solution
changing business mix Ferries Other
2015 2016 2017 Substantial historical investment program limits capital expenditure
requirements going forward
…Support Significant Cash Flow Generation… …and Attractive Shareholder Distributions
Cash Conversion(5) Supporting CIT Regime Post-tax Dividend Distributions
Stable dividend expectation
2008-17 average annual
84%
78% Earnings subject to CIT only dividend of ~€28m ✓ communicated by majority
76%
when distributed (not when shareholder
✓ €48m
earned)
€35m €30m annual post-tax
€31m
PoT likely to have an effective ✓ dividend distribution in 2019-
36%
46% tax rate of 14% on regular 2020(2)
✓
dividend distributions from
(4%) 2019 onwards(3,4)
Policy of distributing at least
2015 2016 2017 2015 2016 2017 ✓
CIT regime supportive of regular 70% of net profit from 2021(2)
Adj. Cash Conversion %
Strong dividend track record
Cash Conversion % dividend distributions
Source: Company.
Note: (1) 2016 financial information has been restated to reflect the impact of new International Financial Reporting Standards applicable to the Company from FY 2017 onwards. (2) Dividend policy was approved by the Government Shareholder on 25 April 2018. The dividend policy excludes any one-off effects and is subject to market
conditions, growth and development plans and the need to maintain a reasonable level of liquidity. (3) Profit distributions are considered regular if the amount of the distribution does not exceed the company’s last three years’ average profit distributions subject to taxation in Estonia. The income tax rate for all amounts exceeding the last three
years’ average profit distributions subject to taxation in Estonia will be 20%. The 14% tax rate can be applied prior to 2021 as follows: (i) in 2019 to one-third of the 2018 taxable profit distributions; and (ii) in 2020 to one-third of the 2018 and 2019 taxable profit distributions combined. In 2018, the reduced CIT rate is not yet applicable to dividend
payments. However, in case of the lower tax rate, a withholding tax may apply if the recipient of the dividend is an individual (resident or non-resident). (4) In line with the proposed dividend policy and the proposed €105m 2018 dividend. (5) Cash conversion calculated as (Adjusted EBITDA – Capex) / Adjusted EBITDA; while adjusted cash
conversion calculated as (Adjusted EBITDA – (Capex – One-offs related to ferry acquisition or construction)) / Adjusted EBITDA.
13Broad Range of Attractive Strategic Initiatives to Maximise
6
Existing Portfolio Value
Additional Revenue Potential in the Passenger / Cruise Segment
Limited capex
Initiatives driving continued growth in number of passengers & expansion of service exposure:
✓
offering
Planned Ongoing
Renovation of passenger terminals Completion: 2020 Development of SmartPort to facilitate movement of Associated
passenger cars and trucks on harbour territory capex
Construction of cruise terminal Completion: 2019/2020 Completion: 2018 budgeted for
Construction of parking house facilities Completion: 2020 Co-marketing to Asian travellers Ongoing
Development of automated mooring Completion: 2019 Long-term execution of Old City Masterplan Start: 2018
Growth
Opportunities Reintroduction of the cruise turnaround product 2020
Attractive Strategic Initiatives to Facilitate Higher Cargo Volumes
Operational headroom (industrial Strong pipeline of strategic projects to further
✓
✓ parks, quays, infra) to facilitate diversify cargo mix and drive port volumes
considerably higher cargo
Screening Ongoing Capex
volumes with limited investments
LNG bunkering terminal
mainly
Muuga Harbour Paldiski South Harbour Muuga-Vuosaari
Wind-parks Start: coming years(3) Ro-Ro line covered by
Soybean processing Completed in 2017 terminal
Start: coming years(3) operators
Baltic connector gas Rail Baltica
Woodchip centre
pipe service fleet Completion: 2026
Start: 2019(3)
Track record of successful co-operation with operators and infrastructure providers (e.g. Tallinn airport,
national rail operator) to utilise existing operational headroom by delivering strategic initiatives
Potential Value Upside from Non-Operated Real Estate Portfolio
Targeting
✓ 16.2 ha land area in Tallinn city centre available for development limited capex
development
Source: Company.
2017: Masterplan(1) Q3 2020: Architectural contest 2023-35: Staged development(2) model
Note: (1) Masterplan does not grant the Company legal ground to perform
the development and is a development plan initiated by the Company. (2)
Depending on market condition. (3) Source: Company. The start dates refer Q1 2018: Start planning process Q1 2021: First stage design
to start of construction, are indicative and are subject to change.
14Highly Experienced Management and a Supportive Governance
7
Framework
Experienced Management Overseen by a Supervisory Board Supportive Majority Shareholder
Management Board
Established and stable sovereign majority shareholder
✓
Valdo Kalm Marko Raid Margus Vihman
CEO CFO CCO
Joined: 2016 Joined: 1997 Joined: 2016
✓ Consistently lowest government debt levels(1) in the EU
Previously CEO of Various managerial Several executive
Eesti Telekom positions within PoT positions at various
organisations ✓ Stable credit rating outlook A1 (Moody’s) and AA- (S&P)
✓ Management team with the right mix of executive experience, fully
supported by a network of highly effective senior managers
✓ Part of EU, eurozone, OECD, WTO and NATO
Supervisory Board / Board of Directors
✓
Aare Tark Üllar Jaaksoo Ahti Kuningas
Chairman of the Member of the Member of the Clearly communicated commercial, strategic and transparency policy(2)
Board Board Board for Port of Tallinn
MINISTRY OF ECONOMIC AFFAIRS
INDEPENDENT INDEPENDENT AND COMMUNICATION
To function as the maritime vehicle and the driver of
Strategic
Urmas Kaarlep Raigo Uukkivi Maarika Liivamägi strategic initiatives in the Estonian logistics sector
Member of the Member of the Member of the
Board Board Board To operate efficiently and profitably in order to support
Financial
INDEPENDENT MINISTRY OF FINANCE INDEPENDENT
stable and growing dividends
✓ Supervisory Board selected through a comprehensive and
transparent selection process to ensure independent majority Transparency To set the standard for best-practice business culture
✓ Listed company experience
Politically Senior Executives with Experience in Public Stock Exchange Compliant
Independent Board Extensive Know-How Shareholder Communication Corporate Governance
Source: Company. Statistics Estonia. Ministry of Economic Affairs and Communication.
Notes: (1) Measured as general government gross debt as percentage of gross domestic product. (2) Based on the policy published by Ministry of Economic Affairs and Communication.
15Q1 2018 Operational Update – Continued Liquid Bulk Stabilisation
Traffic Statistics Recent Developments
YoY(1)
# of passengers (th) Q1 2017 Q1 2018
Change
Total 1,921 1,924 0.2%
Tallinn – Helsinki 1,682 1,686 0.3%
Tallinn – Stockholm 211 216 2.7%
Tallinn – St. Petersburg 7 2 (66.7%)
Docking of vessel
Cruise passengers - - -
Other(3) 21 20 (4.8%)
YoY QoQ(2)
Cargo Volumes (th. tonnes) Q1 2017 Q1 2018
Change Change
Total 5,000 5,019 0.4% 1.8%
Outsized March shipments
Liquid bulk 2,365 2,218 (6.2%) 28.0%
2 consecutive quarters of growth
Ro-Ro cargo 1,187 1,319 11.1% 2.7%
Dry bulk 786 851 8.3% (34.0%)
Containerised 464 449 (3.3%) (13.6%)
General cargo 197 182 (7.8%) 77.1%
Strong Q1 volumes in both PAX and Cargo business
Source: Operational figures based on Management numbers. News snapshots from ERR and The Baltic Course.
Note: (1) Quarter on quarter comparison not meaningful due to strong seasonality in passenger volumes. (2) 2018 Q1 vs. 2017 Q4 results. (3) Figures may be rounded to match total.
16Q1 2018 Financial Update – Significant Cash Flow Generation
Revenue
€m Q1 2017 Q1 2018 Q1 Change
Group Revenue 29.8 29.4 (1.5%)
Change in fleet mix on the PAX lines
Passenger Harbours 9.3 8.8 (5.0%)
Cargo Harbours 10.8 10.5 (3.2%)
Ferry 6.3 6.7 4.9%
Other 3.4 3.4 2.0% Shift in cargo mix
Adjusted EBITDA
€m Q1 2017 Margin Q1 2018 Margin Q1 Change
Group Adjusted EBITDA 19.2 64.3% 17.6 59.8% (8.3%)
Smart Port start-up cost
Passenger Harbours 6.3 67.2% 5.5 62.0% (12.4%)
Cargo Harbours 7.3 67.4% 6.7 64.1% (7.9%)
Ferry 3.3 52.2% 2.7 41.1% (17.3%)
Other 2.3 69.4% 2.7 77.6% 14.1% One-off penalty income in Q1 2017
Other Key Items
€m Q1 2017 Q1 2018
Capex(1) (13.2) (3.1) Completion of major investment program beginning to
(Adjusted EBITDA – Capex) / Adjusted EBITDA 31.2% 82.3%
materialise in significant cash flow generation
Net Debt(2) 228.6 209.8
Source: Based on unaudited Company financials.
Note: (1) Calculated as “Purchases of property, plant and equipment” plus “Purchases of intangible assets”. (2) Calculated as “Total loans and borrowings” minus “Cash and cash equivalents”.
17An Attractive Investment Proposition – Delivering Shareholder Value
Resilient landlord infrastructure business model
DIVERSIFICATION PROFITABILITY CASH FLOW GENERATION
2017 Revenue Breakdown: 2017 Adjusted EBITDA Margin 2017 Cash Conversion(3)
€121m Peers Average(2) 76% Peers Average(2)
55%
52%
48% Adjusted for
4% 65%
one-off ferry 58%
54%
22% capex of €20m
41%
46%
12%
33%
(1) (1) (1)
PAX Cargo Ferry Other
Airports Ports Ferry Airports Ports Ferry
STRONG DIVIDEND PROFILE
✓ €28m ✓ €30m ✓ 70%
Last 10 years’ average annual dividend (4) 2019-20 minimum annual dividend(5) Minimum payout policy(5) from 2021
Source: Company. Factset.
Note: (1) PAX refers to Passenger Harbours segment, Cargo refers to Cargo Harbours segment, Other includes Botnica revenue. (2) Data sourced from company reports. Airports peers: Aena, AdP, Fraport, Flughafen Wien, Flughafen Zurich. Ports peers: GPH, NCSP, HHLA, Luka Kooper, Global Ports. Ferry peers: Tallink, Viking Line. (3)
Calculated as (Adjusted EBITDA – Capex) / Adjusted EBITDA. (4) Excludes 2018 declared dividend of €105m. (5) The dividend policy excludes any one-off effects and is subject to market conditions, growth and development plans and the need to maintain a reasonable level of liquidity.
18Port of Tallinn: Landlord Port Supporting a Strong Dividend Profile
I. Introduction to Port of Tallinn 2
II. Key Investment Highlights 8
Further Detail: Deep Dive on Select Themes 19
Further Detail: Historical Operational and Financial Results 23Potential Value Upside from Non-Operated Real Estate Portfolio
Prime Real Estate in the City Centre Opportunity Overview
• Strategic opportunity to develop prime real estate covering a total land
N
area of 16.2 ha near Old City Harbour in Tallinn city centre
• Total build-up area of c.460,000 gross m2 above ground (including
W E
160,000m2 extension possibility by land reclamation)
S
Plot 2 • Recent significant increase in land development activity in Tallinn:
Old City Harbour ‒ High demand for residential developments driven by growing
Plot 1
population and tourist arrivals in Tallinn (c. 2,027 dwellings
Plot 7 completed in Q1-Q3 2017 and 2,264 in 2016 vs 1,850 in 2015)
Plot 6 ‒ Growing demand for contemporary and cost effective commercial
Plot 3
Plot 5 space driven by IT sector
Old Town Commercial use(2) Development Concept
Commercial and Residential use(2)
• Key development concept selection criteria for the real estate not
Total land area of 16.2 ha directly related to port activities is to limit real estate development
phase capex exposure to Port of Tallinn (e.g. landlord model)
Plot 1 Plot 2 Plot 3 Plot 5 Plot 6 Plot 7
Envisioned Development Timeline for Non-Operated Real Estate
Masterplan(1) 2030+ Architectural contest for the Construction of infrastructure
completed first stage of development and first project
2017 Q3 2020 Q2 2023
Start detail Start design of first Stage by stage development
planning process stage development (depending on the market situation)
Q1 2018 Q1 2021 2023-2035
Source: Company.
Note: (1) Masterplan does not grant the Company legal ground to perform the development and is a development plan initiated by the Company. (2) Commercial use includes office, commercial, hotel, leisure, terminal, university facilities and existing facilities; Residential use includes residential and university residences.
19Large Scale Investment Driving Demand for Regional Port Infrastructure
North – South(1) East – West(2)
In addition to Rail Baltica, there are ongoing discussions to introduce a Multiple large scale initiatives (e.g. One Belt One Road, HSR Eurasia) to
complete cargo model – combining all Baltic exports to One Belt improve the logistics corridor between Europe, China and rest of Asia
Current route
Rail Baltica
Helsinki
Helsinki
Russia
Tallinn (PAX) & St. Petersburg
Rail Baltica Muuga (Cargo) Tallinn
Riga Moscow
Pärnu
Project Hamburg
Amsterdam Berlin
London Warsaw
Riga
Paris
Panevėžys Lyon
Bremerhaven Kaunas Vilnius Madrid
Hamburg
Amsterdam Bremen Tashkent
Berlin Bialystok
Rotterdam Osnabrück China
Antwerpen Hannover Warszawa
Bruxelles Köln
~€5.8bn High-speed railway connection West Route
Total Investment (o.w. 80% EU funded) ✓ with rest of Europe 8x per day(3)
Length ~870km Railway corridor connecting Berlin
Intermodal logistics terminal at Total Investment ~€115bn
240km/h (PAX) ✓ Muuga Harbour ✓ and Beijing through Poland,
Speed 120km/h (cargo) Belarus, Russia and Kazakhstan
Cargo via Tallinn(3) 5.1 in 2026 Tallinn PAX terminal to be Length ~10,000km
(million tons p.a.) 7.0 in 2055 ✓ connected with Old City
Harbour with new tram line New proposed route to cut
# PAX via Tallinn(3) 1.0 in 2026 Timeline Completed by 2035 ✓ transport time from 17 days to 10
(million trips p.a.) 1.3 in 2055
100% EU and state funded: no
2019 ✓ direct capex exposure to PoT Cargo
• Start of construction Transported 20 in 2050
(million tons p.a.) 5,000 China-Europe high-speed
✓ cargo trains by 2020
2018 2025 # PAX
• Technical design phase • Completion of main railway from Tallinn 37 in 2050
(million trips p.a.)
• Building permits to Lithuania-Poland border
Port of Tallinn is well positioned to benefit from increase in regional passenger and cargo volumes driven by strategic
infrastructure investments into the development of north – south as well as east – west transportation corridors
Note: (1) Based on EY Rail Baltica 2017 Feasibility Study dated 24 April 2017; (2) Based on information reported by Dispatch News Desk and Chinese Ministry of Transport. Inclusion of Estonia in the route has not yet been decided. (3) Base case estimates.
20Theoretical Tunnel Project with Unclear Economic and Technical
Viability
Finest’s Helsinki – Tallinn Tunnel Initiative… … Faces Challenges And Might Be Unviable On Many Levels…
Helsinki Technical viability
Tunnel would be twice the length (103km) of the currently
~103km
longest undersea tunnel (53km) in Japan
~30min
Economic viability
Tallinn
Unit construction cost relative to estimated PAX volumes
disproportionally large compared to similar projects
Disproportionately large financial prospect compared to size of
the Finnish and Estonian Economy
Questionable technical solution
Proposed Tallinn station for the tunnel not optimally positioned
relative to the city center
The tunnel alignment between Helsinki (airport) and Tallinn (airport) would
be approximately 103 kilometers long(1) … And Would Still Have Limited Negative Impact If Completed
According to FinEst there will be more line passengers in 2050 than there
The project is estimated to cost between €13 and 20 billion
are today even with a completed tunnel project
Project assumes 40% EU-funding is achieved(1)
Tunnel Passengers(1) Line Passengers(1)
Construction of the tunnel could commence in 2025 and be completed in
2040 at the earliest(1)
2017 2050 2017 2050
0 ~12,500,000 ~8,800,000 ~10,500,000
The projects estimates 12.5 million tunnel passengers and 4 million
tonnes of cargo in 2050(1)
Source: FinEst.
Note: (1) based on estimates from FinEst link final feasibility study (published 7.2.2018)
21Landlord Port with 4 Harbours without Concession Renewal
Limitations
3 Passenger Harbours Cargo Harbours(2)
1
4
1 2 3 4
Estonia
2
Old City Harbour Saaremaa Harbour Muuga Harbour Paldiski South Harbour
Description • One of the busiest passenger • Potential to host regional and • Biggest cargo harbour in • Primarily handles Estonian
ports in Europe cruise ships Estonia export and import cargo and
• Handles 99.7% of PoT • Handles c.53% of cargo transit cargo
passengers volume of PoT • Outsized goods handling
capability
Terminals / Capabilities Two passenger terminals (A&D) One passenger terminal Containers, Liquid Bulk, Dry Ro-Ro, General Cargo, Dry
incl. Cruise, Ro-Ro Facilities building Bulk, General Cargo, Ro-Ro Bulk, Liquid Bulk
Territory / Aquatory (ha) 56 / 94 14 / 41 567 / 682 119 / 147
Total Length of Quays (km) 5.0 0.4 6.4 1.9
Number of Quays 24 + floating 3 + floating 29 10
Max. Depth / Length of Vessels (m) 11 / 340 10 / 200 18 / 300 14.5 / 230
Warehouse / Open Storage (000’ m2) 22 / 95 - 230 / 695 15 / 540
Oil Tank Capacity (000’ m3) - - ~ 1,550 ~ 397
Development Plans • Conversion to a fully fledged • Preparations underway to • Maximum utilization of the • Development and promotion
passenger harbour start cargo handling activities existing infrastructure of the industrial park
• Utilizing the potential for real for Saaremaa local exports / • Development of LNG • Long term option to construct
estate development on areas imports bunkering terminal(1) a new quay for handling
not needed for harbour • Development and promotion outsized goods
activities of the industrial park
Provider of strategic marine infrastructure on a landlord basis
Source: Company.
Note: (1) Final Investment Decision to be taken by operator. (2) Overview excludes Paljassaare harbour which has minimal ongoing operations and is in the process of being divested.
22Port of Tallinn: Landlord Port Supporting a Strong Dividend Profile
I. Introduction to Port of Tallinn 2
II. Key Investment Highlights 8
Further Detail: Deep Dive on Select Themes 19
Further Detail: Historical Operational and Financial Results 232017 Full Year Operational Results
Passenger Traffic Statistics Cargo Traffic Statistics
Annual 2017 Total cargo traffic (th Annual 2017
# of passengers (th) 2016 2017 2016 2017
Change Share tonnes) Change Share
Total 10,173 10,560 3.8% Total 20,118 19,182 (4.7%)
Tallinn – Helsinki 8,477 8,798 3.8% 83% Containerised (TEU)(1) 202,327 215,451 6.5%
Tallinn – Stockholm 964 1,013 5.1% 10% Containerised 1,778 1,907 7.3% 10%
Tallinn – St. Petersburg 163 83 (49.0%) 1% Other General cargo 589 615 4.4% 3%
Change of route operator
Cruise passengers 474 566 19.4% 5% Dry bulk 3,745 4,146 10.7% 22%
Other 95 100 5.3% 1% Liquid bulk 9,443 7,447 (21.1%) 39%
Signs of stabilisation in Q4 2017 and Q1 2018
Ro-Ro cargo 4,563 5,066 11.0% 26%
# of line PAX ship calls(2) 5,109 5,400 5.7%
# of cruise ship calls 272 316 16.2% # of cargo ship calls 1,791 1,677 (6.4%)
Strong growth across all major routes Increasing volumes across all cargo groups except liquid bulk
Source: Operational figures based on Management numbers.
Note: (1) Twenty-foot equivalent unit. (2) Includes overnight cruises and cargo vessel calls to Group's Passenger harbours and excludes passenger vessel calls to the Group's Cargo harbours.
232015 – 2017 Revenue Evolution
Passenger Harbours Cargo Harbours Ferry Other Group
€m €m €m €m €m
121,3
103,2
93,8
47,5 49,9
44,3 44,9 44,8
39,8
27,1
6,3 4,6 4,6 4,6
0,0
2015 2016 2017 2015 2016 2017 2015 2016 2017 2015 2016 2017 2015 2016 2017
• Growth mainly driven by • Loss of Russian fuel oil • Ferry business has been • Revenue only from ice- • Decline in Cargo Harbours
higher economic activity and shipments in recent years operational since 2016 only breaking agreement with revenue offset by introduction
increasing regular line and has significantly impacted Q4 (started October 1) Estonian Maritime of the Ferry segment
cruise passengers dark product (liquid) volumes • 2017 was first full year of Administration (December 20 • Growth further supported by
• In 2016 and 2017 there was in Muuga operations – April 20 each winter period) the Passenger Harbours
an increase in the frequency • Decline partly offset by strong • No revenues outside ice- segment
of vessel calls growth across other cargo breaking season due to
• Megastar replaced smaller groups significant downturn in
vessel Superstar (bigger demand for offshore services
gross tonnage)
Source: Company.
242015 – 2017 Adjusted EBITDA & Margin Evolution
Passenger Harbours Cargo Harbours Ferry Other Group
€m €m €m €m €m
68.7% 70.8% 66.8% 65.2% 63.5% 58.7% N/A 43.8% 31.0% 63.2% 27.4% 32.6% 66.7% 64.0% 54.8%
66,1 66,5
62,5
33,6 33,3 Start-up costs that could
30,5 29,3 28,4 not be capitalized
Botnica contract lost
23,3
8,4
2,8 2,9 1,3 1,5
-0.1
2015 2016 2017 2015 2016 2017 2015 2016 2017 2015 2016 2017 2015 2016 2017
PAX adjusted EBITDA Cargo adjusted EBITDA Ferry adjusted EBITDA Other adjusted EBITDA Group adjusted EBITDA
Adjusted EBITDA margin, % Adjusted EBITDA margin, % Adjusted EBITDA margin, % Adjusted EBITDA margin, % Adjusted EBITDA margin, %
• Passenger Harbours EBITDA • EBITDA evolution driven by • In 2016, there was a one-time • In 2015 Botnica received one- • Moderate overall EBITDA
has seen moderate growth of decrease in revenues from penalty income of €6.9m from off penalty fee of €3m for growth of 3.2% p.a. in 2015-
4.6% p.a. since 2015 decline in liquid bulk volumes shipyards due to delivery cancellation of summer-time 2017 driven by growth in
• 2017 margin impacted by one- • Margin decrease driven by a delays, which caused a spike charter agreement Passenger Harbours and
off costs: significant fixed cost base in 2016 Ferry EBITDA margin • In 2016 extreme cost-cutting introduction of the Ferry
− Development of Old City • 2017 EBITDA hampered by measures were put in place business
Harbour Masterplan 2030 cost of substitute vessel due to continued downturn in • Changing business mix is the
− Dredging of harbour Hiiumaa which was only partly offshore services market main driver of margin
aquatory offset by penalty income of • Includes equity income from evolution(1)
€3.75m from shipyards Green Marine joint venture
Note: (1) Ferry business typically has lower margins compared to traditional port business .
Source: Company.
25Key Financials Overview
Consolidated Income Statement(1)
IFRS
€m 2015(2) 2016(2) 2016 (restated) 2017
Restatements
Revenues 93.8 95.9 7.3 103.2 121.3
Other income 5.8 15.4 (7.3) 8.1 4.8
Operating expenses (23.5) (29.3) (1.1) (30.3) (41.0)
Personnel expenses (12.4) (14.1) (14.1) (18.0)
Depreciation, amortization and impairment losses (22.5) (17.4) (17.4) (26.4)
Other expenses (0.8) (1.6) 1.1 (0.6) (0.4)
Operating Profit 40.4 48.9 48.9 40.3
Net finance costs (1.3) (1.0) (1.0) (2.3)
Share of profit of equity-accounted investee 0.2 0.4 0.4 0.3
Tax benefit / (expense) (8.4) (8.8) (8.8) (12.0)
Profit for the year 30.9 39.5 39.5 26.4
Operating profit 40.4 48.9 48.9 40.3
Depreciation, amortization and impairment losses (22.5) (17.4) (17.4) (26.4)
Profit/loss from investments in joint venture under equity method
0.2 0.4 0.4 0.3
of accounting
Amortisation of the government grants (included in other income) (0.5) (0.6) (0.6) (0.6)
Adjusted EBITDA 62.5 66.1 66.1 66.5
Adjusted EBITDA Margin 66.7% 68.9% 64.0% 54.8%
Operating Profit Margin 43.0% 51.0% 47.4% 33.2%
Net Profit Margin 32.9% 41.2% 38.3% 21.8%
Source: Company.
Note: (1) 2016 financial information has been restated to reflect the impact of new International Financial Reporting Standards applicable to the Company from FY 2017 onwards. (2) 2015 and 2016 (not restated) are based on the 2016 audited annual report.
26You can also read