Porter Hospital FY 2017 Budget Presentation Green Mountain Care Board - August 18, 2016
←
→
Page content transcription
If your browser does not render page correctly, please read the page content below
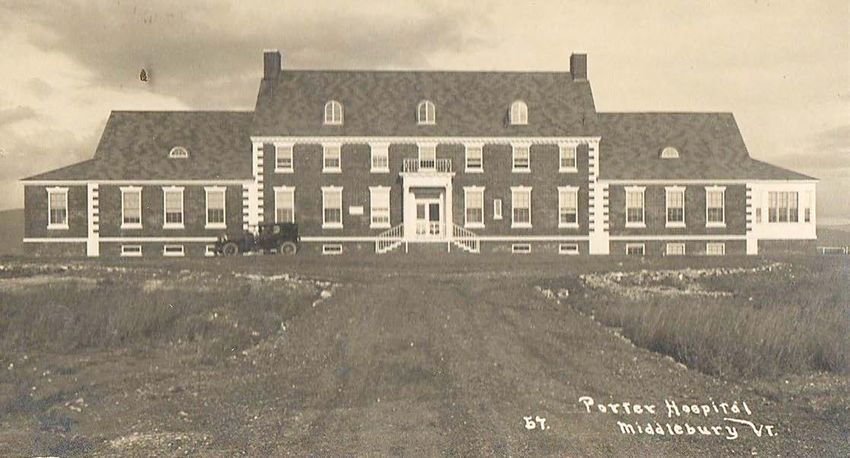
Porter Hospital FY 2017 Budget Presentation
        Green Mountain Care Board

                August 18, 2016

                                              1
Index

• Introduction
• FY 2017 Budget & Support
• Quality & Integration
• CHNA Update
• Organizational Chart
• GMCB Answers to Questions
• FY 2017 Capital Budget

                                  2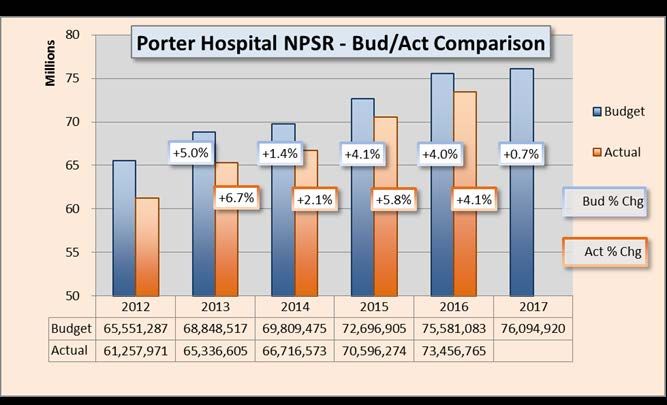
Introductions

Dr. Fred Kniffin – Interim CEO
Steven T. Ciampa – CFO
Dr. Carrie Wulfman – CMO
Peter Igneri – VP of Porter Medical Group
Ron Hallman – VP of Development & Public Relations
Jennifer Bertrand - Controller

                                                     3
FY 2017 Budget Development
Two Channel Approach
• Status Quo – Baseline
• Key Initiatives
4Development of Margin Target
FY 2016 FY 2017
($ in thousands) Budget Budget
Total Expenses $ 77,255 $ 77,327
Depreciation and Amortization $ (3,390) $ (3,289)
Net "Cash" Expenses $ 73,865 $ 74,038
Days in Year 366 365
Total Expense Per Day $ 201.8 $ 202.8
Cash & Investments (Revised Forecast as of 9-30-16) $ 16,933 $ 16,933
Days Cash on Hand 83.9 83.5
Net Change in Days Cash on Hand (0.4)
Margin Target Development:
Required to Maintain DCOH $ 86
5 Days Growth DCOH $ 1,014
Debt Payments $ 717
Pension Funding $ 465
Capital Spending $ 4,006
Subtotal $ 6,288
Less Depreciation & Amortization $ (3,289)
Margin Target $ 2,999
FY 2017 Total Margin Budget Request $ 3,802
Target Variance $ 803
5Sources & Uses Statement
FY 2016 FY 2017
Revised Forecast Budget
($ in thousands)
Net Patient Service Revenue $73,831 $76,095
Other Operating Revenue $2,872 $1,987
340b Revenue $2,966 $2,694
Other Non-Operating Revenue $233 $354
Total Revenue $79,902 $81,129
Total Expenses ($76,448) ($77,327)
Total Margin $3,454 $3,802
Add Back Required Accruals ($500) $139
Depreciation and Amortization $2,903 $3,289
Total Net "Sources" of Cash $5,856 $7,230
Debt Payments ($780) ($717)
Pension Funding ($437) ($465)
Equity Transfer To Affiliate ($2,250) ($2,350)
Capital Spending ($2,300) ($4,006)
Total Net "Uses" of Cash ($5,767) ($7,538)
Net Cash Flow $89 ($308)
Beginning Days Cash on Hand 84.4 84.8
Ending Days Cash on Hand 84.8 83.3
Net Change Days Cash on Hand 0.4 (1.5)
Total Expense Per Day ($201) ($203)
6Comparative Operating Statement
FY 2014 FY 2015 FY 2016 FY 2016 FY 2017 Budget to
Actual Actual Budget Forecast Budget Budget % ∆
REVENUE
Total Gross Patient Revenues 133,682,767 142,245,626 155,893,897 155,541,273 161,257,384
Total Contractual Allowance and Discounts (65,651,131) (68,340,342) (77,384,575) (79,850,592) (83,208,233)
Provision for Bad Debts (2,006,852) (3,256,656) (3,429,666) (2,740,325) (2,460,639)
Disproportionate Share Revenue 691,760 847,101 501,426 506,408 506,408
Net Patient Service Revenue 66,716,544 71,495,729 75,581,083 73,456,765 76,094,920 0.7%
Meaningful Use 751,268 681,617 270,352 459,620 125,001
Total Other Revenue 2,080,942 1,991,031 1,689,570 1,864,684 1,861,662
Other Operating Revenue 2,832,210 2,672,648 1,959,922 2,324,304 1,986,663
TOTAL NET OPERATING REVENUE 69,548,754 74,168,377 77,541,005 75,781,069 78,081,583 0.7%
EXPENSES
Management Contracts 2,247,457 2,710,040 2,232,155 5,149,222 3,898,379
Salaries and Wages Expense 32,200,341 33,942,747 36,576,151 34,631,246 35,025,754
Benefits 8,949,602 8,942,445 9,785,502 9,319,921 9,400,483
Supplies & Expenses 11,533,200 12,190,267 12,243,723 12,519,445 12,558,459
Purchased Services 7,951,025 9,688,046 8,697,407 9,313,022 8,599,722
VT Medicaid Tax 3,910,935 4,046,887 4,016,414 4,180,236 4,180,236
Depreciation and Amortization 4,501,518 3,174,885 3,390,087 3,223,896 3,288,613
Interest 409,809 322,120 313,280 391,004 375,258
TOTAL OPERATING EXPENSES 71,703,887 75,017,437 77,254,719 78,727,992 77,326,904 0.1%
OPERATING MARGIN (2,155,133) (849,060) 286,286 (2,946,923) 754,679
340B Revenue 3,222,965 3,269,714 2,952,914 2,913,656 2,693,560
Other Non-Operating Revenue 718,556 340,404 402,425 305,395 353,714
TOTAL NON-OPERATING REVENUE 3,941,521 3,610,118 3,355,339 3,219,051 3,047,274 -9.2%
TOTAL MARGIN $ 1,786,388 $ 2,761,058 $ 3,641,625 $ 272,128 $ 3,801,953
Total Margin % 2.6% 3.7% 4.7% 0.4% 4.9%
7NPSR Increase Request
FY 2017 NPSR Budget to Budget Increase of 0.7%
Budget to Budget Change %∆ ($ in Millions)
FY 2016 Budget 75,581,085 Charge Increase 1.1
Payor Mix -
FY 2017 Budget 76,094,920 0.7%
Medicare/Medicaid (0.6)
513,835
Commercial Ask 1.2
Utilization (2.4)
Bad Debt 1.0
Charity Care 0.3
DSH -
Total $ 0.5
FY 2017 Healthcare Reform Initiatives:
• ACO Participation
• Continued OneCare Vermont SSP participation through CY 2016.
• Anticipated participation in CHAC SSP for CY 2017.
• Porter, along with 5 other CAHs have made a non-binding
decision to participate in this “non-risk” program.
8NPSR Comparison – Budget / Actual
- Budget FY 2017 vs. Actual FY 2016: 3.6%
- Actual FY 2012 vs. Budget FY 2012: (7.0%)
- Average Annual Budget Increase: 3.0%
- Average Annual Actual Increase: 4.7%
9GPSR Increase Request
Most Hospital Charges Increased by 5.30%.
• Overall Effective Rate of Increase = 3.7%
• No Increase in Price for Physician Services
• Pharmacy, Med/Surg Supplies, and Contracted
Lab Prices are based on cost.
Payor Impact
GPSR NPSR
Medicare 2,354 -
Medicaid 921 -
Commercial 2,078 817
Self-Pay/Other 372 320
Budget to Budget Change 5,725 1,137
Percent Increase vs. FY 2016 Budget 3.68% 1.51%
A 1% increase ≈ $1.1M of GPSR and $0.2M of NPSR.
10Inpatient Utilization
FY 2017 Budget
2015 FY 2016 FY 2016 FY 2017
Actual Budget Forecast Budget
ADMISSIONS:
MEDICAL SURGICAL 1165 1,236 1,133 1,164
OBSTETRICS 371 357 340 379
TOTAL ACUTE HOSPITAL ADMISSIONS 1,536 1,593 1,472 1,543
NEWBORN NURSERY 376 369 362 379
SWING BED 55 66 55 34
TOTAL ADMISSIONS 1,967 2,028 1,888 1,955
AVERAGE LENGTH OF STAY 3.1 3.4 3.3 3.2
PATIENT DAYS:
MEDICAL SURGICAL 4020 4,595 4,124 4,089
OBSTETRICS 870 825 776 884
TOTAL ACUTE HOSPITAL PATIENT DAYS 4,890 5,420 4,900 4,973
NEWBORN NURSERY 800 795 733 810
SWING BED 667 581 557 409
TOTAL PATIENT DAYS 6,357 6,796 6,190 6,192
AVERAGE DAILY CENSUS 17.42 18.62 16.91 16.96
11Outpatient Utilization
FY 2017 Budget
2015 FY 2016 FY 2016 FY 2017
Actual Budget Forecast Budget
EMERGENCY ROOM VISITS 15,374 14,673 15,036 15,196
OP SURGERY PROCEDURES 3,279 3,228 3,350 3,370
PORTER PRACTICE MANAGEMENT VISITS 99,287 107,220 106,875 102,614
• Turnover in Primary Care
• Practice Operation Efficiency
12Expense Drivers
Budget 2016 vs. Budget 2017
VARIANCE
BUDGET FY16 BUDGET FY17
BUD 16 - BUD 17
Porter Hospital 478.1 453.2 (24.9)
PMC (Via Management Contract) 15.9 29.2 13.3
Total Porter Hospital & PMC 494.0 482.4 (11.6)
• Labor
− Reorganization of PMG
− Holistic Management of All PMC Entities
− Compliant with AMS/MGMA Productivity Benchmarks
• Benefits
− Full Year of Self-Insured Health Care Benefit
• Non-Labor Expenses
− Includes Inflation Factor of 2%
− Pharmacy
• Increased use of higher cost medications (E.g. Prevnar and Nexplanon)
− Temporary labor
• Continued demand in Med/Surg and OR.
13FY 2017 Operating Strategy
Key Initiatives
• Helen Porter
• Stabilize Inpatient Operations
• Porter Medical Group
14Quality & Integration Successes
• Quality ratings – Hospital CMS 4 star,
HPHRC 5 star, Press Ganey improvements.
• CHAT (Community Health Action Team)
• Case Management/Transitions of Care
• Customer Service Initiatives
• Integration and Collaboration of Key
Participants: CSAC, Middlebury College, ACHHH, etc.
15Quality & Integration Challenges
• Mental Health Service Deficits
• Addiction Medicine Deficits
• Payment Reform
• Time to Commit to ACO work
16Summary Results: 2015 CHNA Update
Community Needs Aligned With Porter Mission:
• Access to Primary Care
Community Needs Requiring Collaboration:
• Mental Health Services
• Substance Abuse/Opiate Addiction Services
• Obesity/Chronic Disease Management
Community Needs Beyond Porter Mission:
• Dental Services (Medicaid/Adults)
• Homelessness
17Organizational Structure
Porter Medical Center, INC.
PORTER MEDICAL CENTER, INC. PORTER MEDICAL CENTER AUXILIARY
HELEN PORTER HEALTH CARE
PORTER HOSPITAL, INC PORTER REAL ESTATE HOLDINGS, LLC
AND REHABILITATION CENTER
18GMCB Questions & Responses
1) Since the reevaluation of your primary care network, provide an update of the size and scope of your primary
care network presented in the hospital budget.
What changes have occurred? Physicians have dropped by 2 but mid-levels are increasing by 13. Explain this
change. How do you examine the issue of physician capacity or need for your service area?
Our FY 2016 budget for primary care FTEs (Total of MD and Mid-Levels) were 28.8 and our FY 2017 budget
includes 23.7 FTEs. We experienced a closure of one of our sites of service (Porter Internal Medicine). We still
maintain a very high primary care provider per 1,000 resident ratio as compared to Vermont and national
benchmarks. One of our key strategic initiatives is to improve access among the existing primary care providers
such that their annual patient visits and panel sizes are reasonable as compared to surrounding markets.
In the FY 2016 budget submission, there are 15 Mid-Levels who were not reported as Mid-Levels. These Mid-
Levels were reported as non-MD FTEs and should have been reported under the Mid-Level category.
19GMCB Questions & Responses
2) The hospital’s net patient revenues (NPR) are increasing 0.7% over 2016 budget. This easily meets the target as
the hospital has revised its budget base to reflect the changes outlined in their narrative.
a) Explain your NPR changes at the budget hearing using the payer schedule provided in the staff’s
analysis. Specifically explain the amounts for each payer that are not related to the rate increase. The
GMCB is interested in understanding the changes occurring from budget to budget by payer.
The overall budget to budget change in NPR is $0.5M. This change breaks down as follows:
• Change due to requested increase in charges = $1.1M
• Change due to volume = ($2.4M)
• Changes related to Bad Debt / Sliding Scale = $1.3M
• Changes due to price paid by insurers = $0.5M
o Negotiations with commercial payors = $1.1M
o Anticipated reductions in Medicaid PPS = ($0.3M)
o Anticipated Medicare cost report impact = ($0.3M)
b) A $600,000 loss in NPR is identified as budgeted losses due to anticipated changes to reimbursement
for Medicare and Medicaid. Provide an update on the status of these assumptions.
The Medicaid NPR rate variance of ($0.3M) is the anticipated result of future PPS changes unknown
to us at the time of budget submission and based on previous years’ experience.
The Medicare NPR rate variance of ($0.3M) is the anticipated reserve expense as per our
calculation of critical access hospital reimbursement via the Medicare cost report.
20GMCB Questions & Responses
3) The hospital is requesting a 3.7% overall rate increase. Hospital inpatient (4.3%), outpatient (4.6%), and
physician services (0%) are all priced differently. Describe the strategy for pricing services differently.
The difference in inpatient and outpatient percentage of charge increase is due to the distribution of pharmacy
and chargeable medical / surgical supplies between in and outpatient. Porter does not apply a standard charge
increase to these items, whereas their pricing is based on cost, and applied based on tiers of cost. The standard
charge applied to all other procedures is actually 5.3%, but averages out to 4.3% Inpatient, 4.6% inpatient, and
an overall average of 3.7%. No increase is applied to physician services whereas all of Porter’s insurance
payments are based on fee schedules, and not percentage of charge. The only patients who would participate
in a price increase for physician services would be those with no insurance whatsoever (a/k/a Self Pay).
4) The hospital has identified the NPR dollars related to the rate increase at $1,137,777. These dollars will be
earned from payers by raising prices by the effective rate increase. In addition, the hospital identifies NPR dollars
they anticipate as part of their negotiations with insurers of $1,150,595. This is called their “commercial ask”.
Explain the differences from the hospital’s perspective.
As all hospitals try to address the cost shift, continually created by the fact that the Medicaid system reimburses
at a rate significantly below true cost and has no annual update this coming year, we have made our best effort
to negotiate fair and reasonable increases with our commercial insurance contracts (a/k/a, “commercial ask”).
Porter then determined how much of a charge increase might be reasonable to request considering the desire to
achieve an acceptable margin, balanced with continued concerns for charge transparency and consumer
decisions.
21GMCB Questions & Responses
5) Describe the purpose for transferring FTEs to the parent organization and rehiring them under Management
contracts. Explain this rationale – who do they now work for and why? Will this help the hospital reduce overall
administrative and per unit costs? Discuss how this is related to the labor benchmarking work that is intended to
find greater efficiency and reduce overall FTE needs.
The transfer of FTEs to the Parent Company (“Porter Medical Center”, a/k/a “PMC”) is budget neutral, in that it
did not result in any corporate-wide FTE growth. Our labor benchmarking system considers not only hospital
specific paid hours, but also the allocated hours as well as consideration for any temporary labor hours
(including nurse travelers), therefore regardless of the corporate location or use of temporary labor, all labor
hours are considered for the purpose of measuring against labor management targets. The purpose of the
move was to create a more holistic and consistent environment across all business units of PMC. We believe
that this has had a positive effect on intercompany communications and employee engagement.
6) Explain the changes being seen in utilization. Acute admissions are expected to increase over projected 2016
while physician visits are expected to decline. Explain the assumptions used to develop these estimates. Describe
the infusion program and the data and assumptions that were examined to support launching this new service.
The projection for FY 2016 includes the impact of our first quarter experience, which reflected a significant
decrease in acute admissions for both Medical Surgical and Swing Bed. We do not anticipate this experience to
recur in FY 2017; therefore, acute admissions were budgeted at a more comparative level to previous year’s
trends.
Physician visits have declined primarily due to the aforementioned closure of Porter Internal Medicine.
Infusion services had previously been provided on a limited and urgent basis by the nursing staff of our inpatient
unit. We utilized market data provided by VAHHS to identify patients from our HSA who were traveling both
North and South for these services. Recognizing that there was a market opportunity, Porter identified and
repurposed space within our existing building capable of providing this service in a far more patient friendly
environment.
22GMCB Questions & Responses
7) The hospital moved to a self-insured health care insurance product to save costs. What are the trade-offs for
making such a change? What is the risk for the hospital?
The potential risk would be that Porter might incur an atypical increase in claims vs. the most recent five year
trend. We believe that the reinsurance limits of $175,000 per claimant mitigate the risk. $650,000 in reduced
overall program savings is offset by $800,000 of required reserve expenses in FY 2016. An additional reserve of
approximately $400,000 is included in the FY 2017 budget in order to build reserves to an appropriate level.
8) Bad debt and free care are budgeted to drop over 20% from 2016 budget levels. The hospital explains that bad
debt and free care is lower (less cost) because Financial Advocates at Porter have helped more patients obtain
insurance coverage. Quantify the changes the hospital is seeing with bad debt/free care services. Describe any
changes being seen for the number of patients or cases.
When budgeting for bad debt and sliding scale, a recent actual trend rate is applied to gross charges as the basis
for the FY 2017 budget calculation.
The budget to budget decrease for bad debt was based on a decrease in the accounts receivable aging of self-
pay balances during FY 2015. This improvement in the aging was not a consideration for the FY 2016 budget. If
we exclude the anomaly year of FY 2015, and use FY 2014 and FY 2016 revised forecast as a basis, the FY 2017
budget is reasonably comparative.
Self-Pay balances have materially decreased over the last three years, thusly affecting our sliding scale discount
and resulting in a decrease of the trend rate.
23GMCB Questions & Responses
9) Describe the hospital’s efforts with local mental health and other providers to strengthen community health
services. Describe any successes and identify limitations of those efforts.
The Middlebury health service area’s community health action team (CHAT) includes more than 25 local agency
members including the Counseling Service of Addison County (CSAC), Addison County Home Health and Hospice
(ACHHH), the Turning Point Center of Addison County, Blueprint for Health, and Addison Respite Care Home
(ARCH), as well as the newly-formed case management department at Porter Medical Center, help form the
foundation of integration and collaboration that is strengthening Porter’s coordination of care and overall
quality. Successes of these efforts include a decrease in ER visits and readmissions, an increase in hospice care,
and improvements in preventive care metrics. Leaders from several of these organizations, including the
executive directors of both CSAC and ACHHH, now sit on the Porter Medical Center Board.
Limitations we continue to experience are particularly identified in categories of mental health services and
addiction medicine.
10) Are the FY 16 projections for net revenues, expenditures, and surplus as reported still valid? If not, describe
any material changes.
The FY 2016 Projection was based on a continuation of the historical trend in the physician practices at Porter,
which did not consider the improvement strategy that followed soon thereafter. Through the combination of
turnover and specific operational initiatives, the physician practices have experienced discernible improvement
in recent months.
11) What are the hospital’s current plans for CONs identified in 2018 and 2020?
We included place holders of $3.5M for an EMR and $20M for an MOB for future consideration. These
key purchases are under further consideration as we explore affiliation options.
24FY 2017 Capital Budget
FY 2017 Capital Budget = $4.0M
Clinical Replacements Include:
NUCLEAR MEDICINE CAMERA 400,000
ULTRASOUND UNIT (2) 350,000
FULLY DIGITIAL X-RAY EQUIPMENT 129,500
DEFIBRILLATORS 110,000
MINI C ARM 100,000
Infrastructure Improvements Include:
PMA BUILDING RENOVATION 350,000
PARKING LOT REPAIR/RESURFACE 125,000
AFM PRACTICE RENOVATION 100,000
Information Technology:
TOTAL IT REPLACEMENTS & UPDATES 500,000
25QUESTIONS?
26You can also read