Portfolio Update Multi-Cap Growth Equity - Q1 2018 - Lateef Investment ...
←
→
Page content transcription
If your browser does not render page correctly, please read the page content below
Multi-Cap Growth Equity   Q1 2018

     Portfolio Update
  INVESTOR PRESENTATION

   1974            2018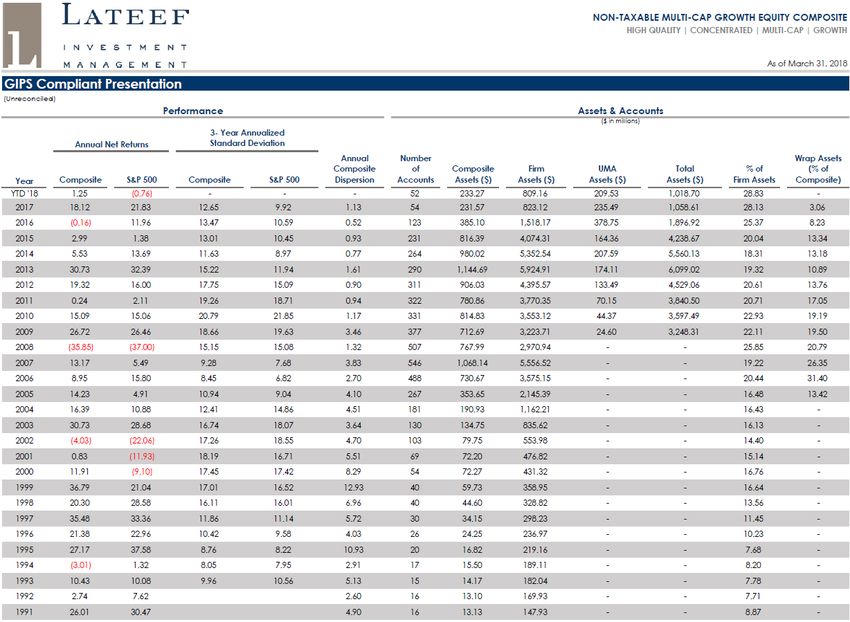
March 31, 2018
                                                                                                                                   LATEEF PERFORMANCE

                                                                               YTD           1 yr          3 yr           5 yr         10 yr         15 yr

          Lateef Multi-Cap Growth Equity*                                      1.25         13.59          5.82          9.45          8.25          10.11
          S&P 500®                                                            -0.76         13.99         10.78         13.31          9.49          10.10

*Performance for Lateef Non-Taxable Multi-Cap Growth Equity Composite (net of fees), as of March 31, 2018. See GIPS Compliant
                          Performance Report with disclosures, as of March 31, 2018, on pages 18-19.

The S&P 500® Index is an unmanaged stock market index and is not available for direct investment. The S&P 500® Index is comprised of 500 common stocks which are generally
representative of the U.S. stock market.
The information presented on this slide supplements the Lateef Non-Taxable Multi-Cap Growth Equity Composite provided in this presentation and is provided as supplemental
information.
Past performance does not guarantee future results. Performance is shown net of fees.                                                FOR INVESTMENT PROFESSIONAL
                                                                                                                                                     1974
                                                                                                                                                                   USE
                                                                                                                                                                    2017
                                                                                                                                                                         ONLY
This document is not complete without the “Important Disclosures” pages.                                                                                                   1.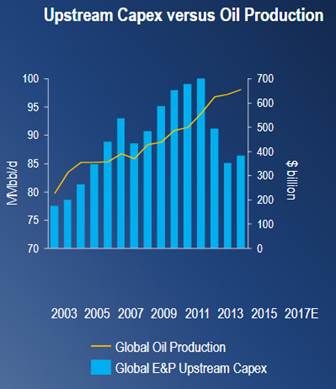
Q1 2018
                                                                                                                                     PORTFOLIO HIGHLIGHTS*

 Leaders                                     Total Mkt.         Performance                 Laggards                                    Total Mkt.          Performance
                                               Return           Contribution                                                              Return            Contribution

 Autodesk                                      19.8%                   1.1%                 Alaska Air                                    -15.3%                  -0.5%

 Keysight Technologies                         25.9%                   1.0%                 Synchrony Financial                           -12.8%                  -0.5%

 XPO Logistics                                 11.2%                   0.7%                 Celgene                                       -14.5%                  -0.4%

                Note: The Total Market Return reflects the stock price performance, including dividend income, for Q1 2018.
                   The holdings identified above do not represent all of the securities purchased, sold, or recommended
                   for advisory clients. To obtain the full contribution to return report for all of the Representative Account
                    holdings for Q1 2018, along with the calculation methodology, please contact us at (415) 461-3800.

  *For the Lateef Multi-Cap Representative Account, an actual account in the Non-Taxable Multi-Cap Growth Equity Composite.
The list of top 3 and bottom 3 holdings should not be considered a recommendation to purchase or sell a particular security, represents only a small percentage of the entire
portfolio and the securities purchased for advisory clients, and may not remain in the portfolio at the time you receive this report. You should not assume that investments in the
securities identified were or will be profitable or that decisions we make in the future will be profitable.
Past performance does not guarantee future results.
See Footnote Disclosure #1 on “Footnote Disclosures” pages.                                                                              FOR INVESTMENT PROFESSIONAL
                                                                                                                                                        1974
                                                                                                                                                                     USE
                                                                                                                                                                      2017
                                                                                                                                                                           ONLY
This document is not complete without the “Important Disclosures” pages.                                                                                                         2.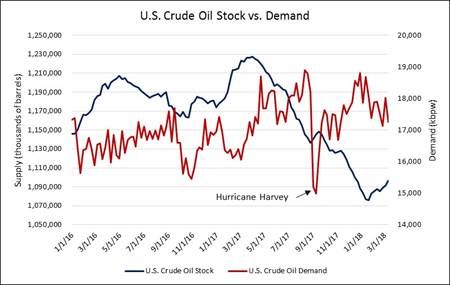
Q1 2017 – Q1 2018
                                                                                                                                 MARKET CAP OVER TIME

                       Mix of Holdings by Market Cap                                                      Weighted Average Market Cap ($ billions)
                                                                                                                                                              $250
                                  16%         12%          8%                                    S&P 500      Lateef
         24%         17%                                                   $100bn+                                                                            $200

                                                                                                                                                              $150
                                              68%          67%
                     70%          64%                                      $10-100bn
         71%                                                                                                                                                  $100

                                                                                                                                                              $50
                                  20%         20%          25%             $2-10bn
          5%         13%
                                                                                                                                                              –
        Q1'17        Q2'17       Q3'17        Q4'17       Q1'18                                Q1'17        Q2'17        Q3'17        Q4'17        Q1'18

The S&P 500® Index is an unmanaged stock market index and is not available for direct investment. The S&P 500® Index is comprised of 500 common stocks which are generally
representative of the U.S. stock market.
See Footnote Disclosure #2 on “Footnote Disclosures” pages.                                                                           FOR INVESTMENT PROFESSIONAL
                                                                                                                                                     1974
                                                                                                                                                                  USE
                                                                                                                                                                   2017
                                                                                                                                                                        ONLY
This document is not complete without the “Important Disclosures” pages.                                                                                                 3.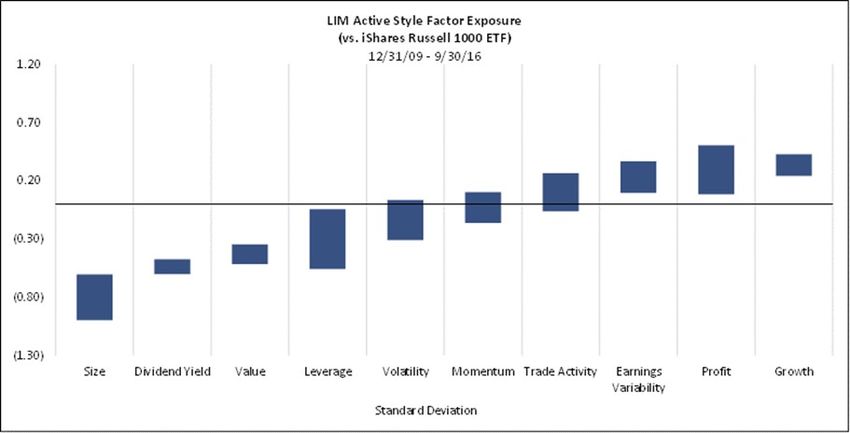
March 31, 2018
                                                                                                                                           MULTI-CAP HOLDINGS

                     CONSUMER DISCRETIONARY                                                                                     INDUSTRIALS

                                                                                                                                 PORTFOLIO HOLDINGS

                                 FINANCIALS                                                                                    HEALTHCARE

                                    ENERGY                                                                                      REAL ESTATE

                                                                    INFORMATION TECHNOLOGY

Current and future portfolio holdings are subject to change and risk. References to these companies are not a solicitation or a recommendation to buy, hold or sell any securities.
See Footnote Disclosure #3 on “Footnote Disclosures” page.                                                                               FOR INVESTMENT PROFESSIONAL USE ONLY
This document is not complete without the “Important Disclosures” pages.                                                                                                            4.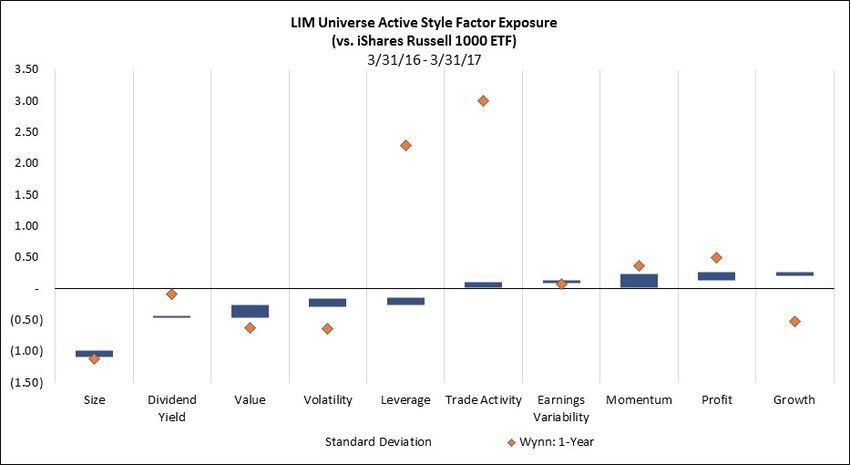
Anadarko Petroleum Corp (APC)– Position purchased March 2018
                                                                                                                                RECENT PURCHASE
 APC Buy Rationale
 Anadarko Petroleum Corporation (APC) is an oil and gas exploration company. After a series of divestitures throughout 2016 and 2017, APC now operates
 primarily domestically in the Delaware Basin, DJ (Denver-Julesburg) Basin, and Gulf of Mexico. Though APC does not have a direct midstream business,
 APC enjoys a unique relationship with Western Gas for the transportation of resources generated in West Texas.

 Our Thesis
 We believe that APC is well-positioned to benefit from multiple stages in the fossil fuel recovery cycle. Our research suggests that oil production is nearing
 a supply crunch, wherein the lack of new exploration capex since 2015 and existing oil well depletion will result in insufficient production to meet steadily-
 growing demand. APC’s assets, which include traditional land rigs, horizontal shale rigs, and deepwater rigs, all stand to increase in volume and profitability
 as industry supply tightens. We further believe that APC’s liquefied natural gas asset in the East African country of Mozambique is an underappreciated
 source of future cash flows that is strategically located to take advantage of Asian and European transitions from coal to natural gas energy production. We
 believe that APC’s growing production volumes coupled with prudent capital spending should lead to an improvement on ROIC from the high-teens to 25%
 over the coming years.

 Opportunities
 Leverage to Oil Recovery: Management divested gassy assets to reorient the portfolio to oil (now 57% oil). The low cost of the DJ and Delaware basins
 (and the high incremental returns of Gulf assets) may yield high shareholder returns when global oil markets come into balance.
 Underappreciated Midstream Asset: APC has a 78% interest in Western Gas Partners, a midstream MLP (master limited partnership) with assets in
 West Texas. Though this asset generates consistent free cash flow for APC, we do not believe this value is reflected in APC’s current stock price. Our due
 diligence indicates that APC management has plans to realize the value of the midstream asset.
 Mozambique LNG Asset: APC is nearing a final investment decision on a Mozambique liquefied natural gas (LNG) field and terminal, which is strategically
 located to take advantage of Asian and European transitions from coal to natural gas energy. Our analysis suggests that this asset would generate $1.5
 billion of free cash flow once operational. We do not believe this asset is reflected in APC’s current price.
 Shareholder-Friendly Capital Allocation: Management recently authorized $3.0 billion in share repurchases, quintupled the annual dividend from $0.20
 to $1.00, and included a cash ROIC target in management compensation. We believe these decisions confirm management’s commitment to disciplined
 capital allocation and new returns-oriented philosophy.

References to companies are not a solicitation or a recommendation to buy, hold or sell any securities.                    FOR INVESTMENT PROFESSIONAL
                                                                                                                                          1974
                                                                                                                                                       USE
                                                                                                                                                        2017
                                                                                                                                                             ONLY
This document is not complete without the “Important Disclosures” pages.                                                                                       5.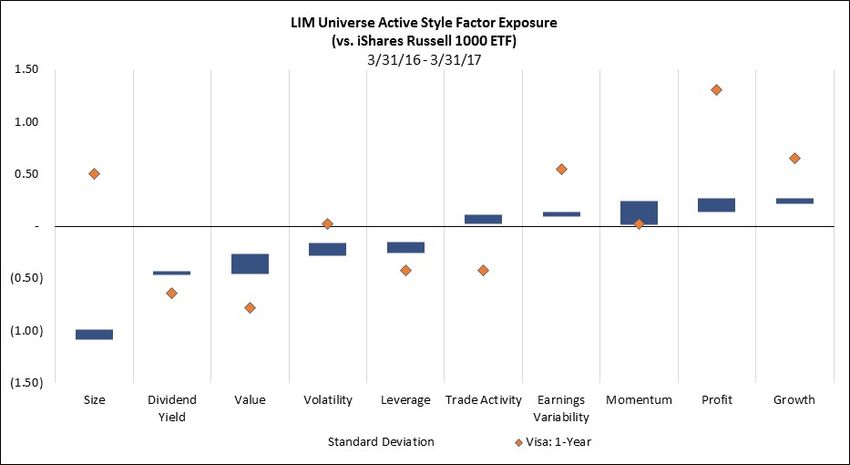
(APC) CONTINUED

Source: Energy Information Admin (EIA) Weekly Petroleum Status Report (3/14/18)

                                                                                                          Source: Schlumberger LTD using IHS Markit, EIA data (12/5/17)

References to companies are not a solicitation or a recommendation to buy, hold or sell any securities.                                 FOR INVESTMENT PROFESSIONAL
                                                                                                                                                       1974
                                                                                                                                                                    USE
                                                                                                                                                                     2017
                                                                                                                                                                          ONLY
This document is not complete without the “Important Disclosures” page.                                                                                                    6.
Flex LTD. (FLEX) – Position purchased February 2018
RECENT PURCHASE
Flex LTD. (FLEX) provides design, engineering, manufacturing, and supply chain services to companies operating in a broad set
of end markets. The company ranks #1 in the U.S. and #2 worldwide behind Hon Hai in electronics manufacturing services (EMS)
market share and is increasingly adding design and engineering services through its Sketch-to-ScaleTM solution. FLEX is
headquartered in San Jose, CA.
Investment Thesis
FLEX’s Sketch-to-ScaleTM Solutions is expanding the company’s addressable market and improving its financial profile. Through
Sketch-to-Scale, FLEX offers more value-added services such as concept design and prototype creation in addition to the
traditional EMS roles of manufacturing and distribution & logistics. By providing more design and engineering services, FLEX has
captured higher margin manufacturing contracts, gained visibility into revenues through longer product lifecycles, and entered
into new industry verticals exposed to megatrends such as the Internet-of-Things (IoT), vehicle electrification, and connected
health. As Sketch-to-Scale contracts grow above the rate of traditional EMS, we believe FLEX should experience an
improvement in growth and profitability.
Opportunities:
• Sketch-to-ScaleTM Solutions is expected to drive growth and profitability over the long term: Sketch-to-Scale has grown from 7%
of sales in FY13 to 23% of sales in FY17. Our analysis indicates that Sketch-to-Scale can account for 40% of company revenues
(and ~60% of EBIT) in FY20.
• Growing addressable market from exposure to megatrends: FLEX is expected to benefit from a growing addressable market
driven by megatrends such as IoT/connectivity, autonomous autos, and connected/digital health.
• Expanding margins profile: Sketch-to-Scale penetration and operational leverage is expected to yield an EBIT CAGR of 10% on
revenue growth of 3% per year. We estimate that Sketch-to-Scale margins are 2x traditional EMS margins of LSD-MSD.
• Returns on capital will inflect after a period of heavy investing: FLEX’s spending on innovation and R&D investments has tripled
since FY13, leading to lower returns. Management expects FY18 to be another year of heavy investment that will set up the
company for future growth. FLEX has a 20% risk-adjusted Return-on-Invested-Capital (ROIC) hurdle for contracts.
• Focus on returning capital to shareholders: Over the past 6 years, FLEX has returned over 50% of its Free Cash Flow to
shareholders through buybacks (retiring 35% of the company’s shares outstanding).
References to companies are not a solicitation or a recommendation to buy, hold or sell any securities. FOR INVESTMENT PROFESSIONAL
1974
USE
2017
ONLY
This document is not complete without the “Important Disclosures” pages. 7.First data corporation (FDC) – Position purchased January 2018
RECENT PURCHASE
Headquartered in New York City, First Data Corporation (FDC) provides merchant acquiring, issuing and network/security solutions to merchants and
financial institutions. FDC serves over 6 million business locations and over 4,000 financial institutions. Through its Global Business Solutions (GBS) segment, FDC
helps merchants conduct non-cash transactions through merchant acquiring, eCommerce enablement, point-of-sale technology, business software and
marketing/loyalty services. In other segments, FDC provides payment processing services and network/security solutions to financial institutions and issuers.
FDC was initially taken private by KKR in 2007 and subsequently went public in 2015.
Investment Thesis
FDC, a leading merchant acquirer, will benefit from growing credit transactions in the U.S. and the secular tailwind of the cash-to-credit transition. We believe
the valuation gap relative to other merchant acquirers will narrow as growth inflects in the company’s North American GBS segment and as the company
lowers leverage. We view the bank joint venture (JV) channel will positively inflect as Wells Fargo improves operations and as digital signups are rolled out in
2018. FDC’s recent acquisitions of CardConnect and BluePay position the company well to participate in the faster growing independent software vendor
channel, which is more sticky than traditional channels. We anticipate FDC’s free cash flow generation will be directed towards debt paydown.
Opportunities:
• Return JV channel back to positive growth: starting in Q4’16, the JV channel underperformed largely due to weakness at Wells Fargo, which was
undergoing scrutiny for aggressive sales tactics. From our analysis, we believe the JV channel is poised to return to positive growth, as easier comparables lie
ahead, bank partners invest in the JV’s and digital signups are enabled on bank websites
• Capture high growth integrated software vendor (ISV) channel and eCommerce: with the 2017 acquisitions of CardConnect and BluePay, we believe FDC
immediately becomes a contender in the faster growing, higher quality ISV channel and eCommerce opportunities.
• Latin America GBS Growth: FDC is expanding internationally into Latin America. FDC currently has 2.5% market share in Brazil and has grown 100% y/y with
only one banking partner. We view FDC as primed to continue its growth in Brazil as FDC looks to add additional bank partners. Further, in Argentina, we view
FDC benefiting from favorable regulation, in which FDC will be allowed to transact with both Visa and Mastercard (prior, FDC could only transact Mastercard
payments).
• Continue Clover point-of-sale (POS) system growth: FDC’s Clover POS system processes $50bn+ of annualized volume and has grown 50%+ y/y. We believe
the Clover system is an underappreciated asset as it creates an open platform for software providers to integrate into, enhancing the POS value and
reducing client churn. We view FDC’s current valuation as ascribing little to no value to Clover. In comparison, competitor Square processes $70bn of
annualized volume, growing 30% y/y.
• Reduce debt burden: Currently, FDC has 6x net leverage. We view FDC will delever to 4x by 2019/2020, in which FDC will be investible to a broader set of
investors. Further, in Q4’18 $3.4bn of 7% unsecured notes becomes callable. We believe FDC will refinance this tranche at FDC’s current secured rate,
potentially realizing a +8% uplift in EPS.
References to companies are not a solicitation or a recommendation to buy, hold or sell any securities. FOR INVESTMENT PROFESSIONAL
1974
USE
2017
ONLY
This document is not complete without the “Important Disclosures” pages. 8.Raymond James Financial (RJF) – Position sold in March 2018
RECENT SALE
Initial Purchase: March 2017
What was our Thesis?
When we initially purchased Raymond James (RJF) in Q1:17, we anticipated that the Company would be a long-term share
gainer in the Asset Management business due to the ability to attract traditional wire house brokers with financial incentives and
more flexible business arrangements. Furthermore, we believed that RJF would benefit in a rising U.S. interest rate environment.
What Changed?
Competitive Landscape Changed: Since making our initial investment, Morgan Stanley, UBS and Citibank all withdrew from
the Protocol for Broker Recruiting, indicating that these banks would threaten legal action against broker teams that
defected to competing firms. We believe that this change in the industry significantly impairs RJF to attract new broker
teams to its platform.
Stock Reached Fair Value: RJF appreciated to our assessment of fair value due to strong results in a rising interest rate
environment.
More Attractive Opportunities with Less Equity Market Exposure: Given that RJF reached our assessment of fair value, we
believe that there are more attractive opportunities in the market today.
References to companies are not a solicitation or a recommendation to buy, hold, or sell any securities. FOR INVESTMENT PROFESSIONAL
1974
USE
2017
ONLY
This document is not complete without the “Important Disclosures” pages. 9.Facebook (FB) – Position sold in March 2018
RECENT SALE
Initial Purchase: March 2015
Company Overview
Facebook, Inc. (FB) owns and operates the social media networks Facebook, Facebook Messenger, Instagram, and WhatsApp.
As of 12/31/17, Facebook had 2.1 billion monthly active users across its suite of products worldwide.
What was our Thesis?
When we initiated our position in FB in Q1:15, we believed that the Company was well-positioned to benefit from the secular
shift of advertising dollars from traditional media to digital media. Furthermore, we anticipated that this advertising revenue
growth would come at high incremental profit margins as the Company did not pay for the content hosted on the platform.
What Changed?
Thesis Realized: Over our holding period, multinational brand advertisers realized the benefit of targeted advertising
informed by personal data. This resulted in increased demand for such advertisements against a limited supply of ad
inventory, and caused revenue to more than double since our initial investment.
Threat of Regulation: Since its inception, Facebook has transformed from a social media company driven by user-
generated content into a media platform that hosts 3rd party content, including “fake news” and other content with
political implications. We now believe that, following recent revelations questioning data security and the ability to
“weaponize” user data, Facebook could be subject to regulatory scrutiny at the expense of its multiple.
Uncertainty of Future Performance: We believe that Facebook’s expense growth guidance could be at risk as the company
spends to self-regulate to avoid formal regulation. This, along with potential backlash from users, reduces our ability to
forecast revenue and expense growth reliably, and thus reduces our conviction in future performance.
References to companies are not a solicitation or a recommendation to buy, hold, or sell any securities. FOR INVESTMENT PROFESSIONAL
1974
USE
2017
ONLY
This document is not complete without the “Important Disclosures” pages. 10.Nielsen Holdings plc (NLSN) – Position sold in February 2018
RECENT SALE
Initial Purchase: June 2014
Company Overview
Nielsen Holdings PLC (NLSN) provides third-party independent measurement data for traditional media companies, Internet
advertising, and retail transactions.
What was our Thesis?
When we initiated our position in 2014, we believed that NLSN was the best-positioned company to bridge the gap between
advertising spend and sales, effectively measuring the return on investment for advertisers. We anticipated that NLSN’s
measurement services would be especially important given the secular growth of Internet-based advertising, which lacked third-
party independent measurement data.
What Changed?
Zero-Based Budgeting Squeeze: consumer packaged goods (CPG) companies have adopted zero-based budgeting as a
cost-savings measure to improve margins against weak sales. As a consequence, NLSN’s discretionary data consulting
business rapidly eroded, which has caused headwinds to the Buy Segment despite a large base of contractual revenue
streams.
Gaps in Data Exposure: our channel checks have revealed that NLSN measurement, while accurate, is slow for a market
that requires sales agility. We now believe that NLSN has significant gaps in the transactional data that advertisers prefer
when making spending decisions.
Bypassed by Facebook and Google: NLSN measurement data is integral for television ratings and is therefore integral for
traditional linear advertising. We believed that third-party independent measurement data would have the same
importance online. We now believe that online platforms like Facebook and Google have diminished the value-add that
NLSN provides in linear media.
References to companies are not a solicitation or a recommendation to buy, hold, or sell any securities. FOR INVESTMENT PROFESSIONAL
1974
USE
2017
ONLY
This document is not complete without the “Important Disclosures” pages. 11.Dollar General (DG) – Position sold in January 2018
RECENT SALE
Initial Purchase: February/March 2016
Company Overview
Dollar General Corp. (DG) operates a chain of 14,321 discount retail stores. DG is an every-day low-price retailer, focused on
perishable food items that drive regular traffic to stores, and is the largest mass market general retailer in the United States.
What was our Thesis?
When we initiated our position in DG, we anticipated that the Company’s store remodel program to increase cooler space for
perishable food items would result in higher-than-expected comparable store sales. We believed that this, combined with zero-
based budgeting and a focus on decreasing store shrink, would result in favorable earnings growth, which would in turn be
returned to shareholders via dividends and share repurchases
What Changed?
New Competition: Since we initiated our position, German discount retailers Aldi and Lidl significantly expanded in the
United States. We believe these retailers’ focus on perishable food presents a formidable challenge to DG as it pursues its
own food-driven strategy with the stigmatic dollar-store branding.
Aggressive Industry Growth: Due to the favorable return-on-investment that dollar store formats offer, DG’s competitors
have announced aggressive expansion campaigns. DG itself targets adding 900 new locations per year. We believe that
this, combined with the entry of similar competition, will result in a saturated market for discount retailing sooner than the
Street anticipates.
Success Priced In: DG currently trades at 22.0x FY18 Adj. EPS, which we believe fairly discounts the Company’s future
growth opportunities and tax-reform benefits. We believe there are more attractive opportunities.
References to companies are not a solicitation or a recommendation to buy, hold, or sell any securities. FOR INVESTMENT PROFESSIONAL
1974
USE
2017
ONLY
This document is not complete without the “Important Disclosures” pages. 12.March 31, 2018
ACTIVE SHARE
Active Share – A measure of the percentage of stock holdings in a manager’s portfolio that differ from the benchmark index.
High active share and high tracking error managers (concentrated stock-pickers) earn the highest positive excess returns.1
1Cremers, Martin and Antti Petajisto, How Active Is Your Fund Manager? A New Measure That Predicts Performance. August 2006.
Securities chosen represent current holdings and may not be representative of the Composite as a whole.
See Footnote Disclosure #4 on “Footnote Disclosures” pages. FOR INVESTMENT PROFESSIONAL
1974
USE
2017
ONLY
This document is not complete without the “Important Disclosures” pages. 13.Lateef Multi-Cap Growth Equity Composite
ROLLING RETURNS
Rolling 1, 3, 5, 10 and 15-Year Returns
Calculated Annually at Year-end from 2000-2017
As of December 31, 2017
These rolling returns are measured against the S&P 500® Index. The S&P 500® Index is an unmanaged stock market index and is not available for direct investment. The S&P 500®
Index is comprised of 500 common stocks which are generally representative of the U.S. stock market.
The information presented on this slide supplements the Lateef Non-Taxable Multi-Cap Growth Equity Composite provided in this presentation and is provided as supplemental
information.
Past performance does not guarantee future results. Performance is shown net of fees.
See Footnote Disclosure #5 on “Footnote Disclosures” pages. FOR INVESTMENT PROFESSIONAL
1974
USE
2017
ONLY
This document is not complete without the “Important Disclosures” pages. 14.Lateef Investment Factor Analysis vs. Russell 1000*
FACTOR ANALYSIS
Lateef’s criteria leads to certain factor characteristics- As we’ve analyzed our criteria and overlay the
historical portfolio holdings, the result is our “Lateef Habitat,” seen below.
This illustrates that we tend to be overweight Growth and Profitability and also tend to be underweight
Value and Dividend Yield.
NOTE: The Russell 1000* is used as the benchmark instead of the S&P 500® because it casts a wider net and covers all our holdings.
*iShares Russell 1000 ETF (IWB).
The Russell 1000® and S&P 500® are unmanaged stock market indices and are not available for direct investment. The S&P 500® Index is comprised of 500 common stocks which
are generally representative of the U.S. stock market.
See Footnote Disclosure #6 on “Footnote Disclosures” pages. FOR INVESTMENT PROFESSIONAL
1974
USE
2017
ONLY
This document is not complete without the “Important Disclosures” pages. 15.Factor Analysis adds a Layer of Risk Management
FACTOR ANALYSIS
Factor Analysis helps inform Investment Team of individual stock’s characteristics relative to historic Lateef Habitat.
Risk Management Performance – Our style favors Growth factors, but being underexposed to Value factors like Dividend Yield and
Value have hurt our recent performance. However, we acknowledge that volatility and earnings variability have been negative
contributors to our overall performance.
As such, we’re using Factor Analysis to provide a layer of risk management going forward. As an example, we trimmed Wynn Resorts*
and added Visa in the third quarter of 2016.
NOTE: The Russell 1000** is used as the benchmark instead of the S&P 500® because it casts a wider net and covers all our holdings.
*Position sold during November 2016.
**iShares Russell 1000 ETF (IWB).
The Russell 1000® and S&P 500® are unmanaged stock market indices and are not available for direct investment. The S&P 500® Index is comprised of 500 common stocks which
are generally representative of the U.S. stock market.
See Footnote Disclosure #7 on “Footnote Disclosures” pages. FOR INVESTMENT PROFESSIONAL
1974
USE
2017
ONLY
This document is not complete without the “Important Disclosures” pages. 16.March 31, 2018
PORTFOLIO CHARACTERISTICS
High Quality Growth Businesses
– Our companies generated positive free cash flow, which we believe will increase over time1,2
– Weighted Average Market Cap of $84.3 Billion vs. $216.1 Billion for S&P 500®
Strong EPS Growth
– 2016 EPS growth of 14%1 vs. 6% for S&P 500®
– 2017 EPS growth of 15.2%1,3,4,5 vs. 10.2% for S&P 500®
– 2018E EPS growth of 20.1%1,5 vs. 16.5% for S&P 500®
Attractive Valuation
– 2018E P/E of 16.4x1 vs. 17.9x for S&P 500®
– 2018E median free cash flow yield of 5.6%1,2
1Autodesk (ADSK) is not included in this metric. Following a business model transition, we expect ADSK to report significant improvement in its FCF, EPS growth, and P/E over the next several
years.
2Progressive (PGR) and Synchrony Financial (SYF) are not included in this metric. FCF is not a useful metric for evaluating financial companies such as PGR and SYF.
3DXC Technology (DXC) is not included in this metric, as the company did not exist in 2016 and was formed through a merger and spinoff.
4Aptiv PLC (APTV) and Delphi Technologies (DLPH) are not included in this metric as the companies recently separated from Delphi Automotive and lack a full year of operating data as
standalone entities.
5Anadarko (APC) is not included in this metric. The business is currently operating at cyclically depressed levels, we expect APC to report significant improvement in its FCF, EPS growth, and
P/E over the next several years.
The S&P 500® Index is an unmanaged stock market index and is not available for direct investment. The S&P 500® Index is comprised of 500 common stocks which are generally
representative of the U.S. stock market.
The information presented on this slide supplements the Lateef Non-Taxable Multi-Cap Growth Equity Composite provided in this presentation and is provided as supplemental
information.
See Footnote Disclosure #8 on “Footnote Disclosures” pages. FOR INVESTMENT PROFESSIONAL
1974
USE
2017
ONLY
This document is not complete without the “Important Disclosures” pages. 17.NON-TAXABLE MULTI-CAP GROWTH EQUITY COMPOSITE This document is not complete without the “Important Disclosures” pages. FOR INVESTMENT PROFESSIONAL USE ONLY Past performance does not guarantee future results. Performance is shown net of fees. 18.
December 31, 2017
                                                                                        NON-TAXABLE MULTI-CAP GROWTH EQUITY COMPOSITE
                                                                                                        DISCLOSURES

This document is not complete without the “Important Disclosures” pages.                                  FOR INVESTMENT PROFESSIONAL USE ONLY
Past performance does not guarantee future results. Performance is shown net of fees.                                                      19.
CONTACT INFORMATION
LATEEF INVESTMENT MANAGEMENT
300 Drakes Landing Road
Suite 210
Greenbrae, CA 94904
Ph: (415) 461-3800
Fx: (415) 461-0436
clientservice@lateef.com
FOR INVESTMENT PROFESSIONAL
1974
USE
2017
ONLY
This document is not complete without the “Important Disclosures” pages. 20.IMPORTANT DISCLOSURES
A. Lateef Investment Management, L.P. (Lateef) is an investment advisory firm established in 1974. Lateef is registered with the
Securities and Exchange Commission (SEC) under the Investment Advisors Act of 1940. Lateef is headquartered in Greenbrae,
California.
B. Past performance is not indicative of future results. The actual return and value of an account will fluctuate and at any point in
time could be worth more or less than the amount initially invested.
C. The Standard & Poor’s 500® (S&P 500®) Index, Russell 3000® Index, and Russell 1000® Index are unmanaged stock market indices
and are not available for direct investment. The S&P 500® is a widely recognized, unmanaged index of 500 common stocks
which are generally representative of the U.S. stock market as a whole. The Russell 3000® is an unmanaged index that
measures the performance of 3,000 largest U.S. stocks, representing about 98% of the total capitalization of the entire U.S.
stock market. The Russell 1000® Index is an unmanaged index that measures the performance of the largest 1,000 companies
in the Russell 3000® Index. This unmanaged index represents the universe of large capitalization stocks from which most active
money managers typically select. The performance of unmanaged indices reflect the reinvestment of dividends on securities
in the index and do not reflect the deductions for fees, expenses or taxes which would affect performance of actively
managed assets.
D. The average market capitalization of portfolios in the composite may differ from the weighted average market capitalization
of the index.
E. The volatility of the index may be greater or less than the volatility of the portfolios in the composite.
F. Results presented are time-weighted total rates of return expressed in U.S. Dollars. Performance results reflect all income, gains
and losses and the reinvestment of interest and other income. All rates of return are reported "NET" of fees. Additional
information regarding the policies for calculating and reporting returns is available upon request.
G. A complete listing and description of all Lateef composites and performance results is available upon request.
This presentation is provided for informational purposes only and is intended for Investment Professional use.
1974 2017
This document is not complete without the “Important Disclosures” pages. 21.Footnote Disclosures
IMPORTANT DISCLOSURES
1) The Leaders and Laggards are the top 3 and bottom 3 contributors to performance for our Multi-Cap Growth Equity
Representative Account (an actual account in the Non-Taxable Multi-Cap Growth Equity Composite), out of a
portfolio that typically has 15-25 holdings. The information was calculated by Thomson Reuters using the
Representative Account’s portfolio holdings.
2) The chart on the left represents the percentage mix of holdings by market capitalization in the Lateef Multi-Cap
Growth Equity strategy as of quarter end from 3/31/17 through 3/31/18. Market capitalization values were obtained
from Bloomberg and holdings are equal weighted. The chart on the right represents the weighted average market
capitalization in the Lateef Multi-Cap Growth Equity strategy and S&P 500® as of quarter end from 3/31/17 through
3/31/18 and was obtained from Bloomberg.
3) The holdings presented represent the largest aggregate positions held across all accounts included in the Lateef
Non-Taxable Multi-Cap Growth Equity Composite, and are classified using Global Industry Classification Standards
(GICS).
4) The Active Share of 95.20% as of 03/31/18 is for the Lateef Multi-Cap Growth Equity Representative Account’s (an
actual account in the Non-Taxable Multi-Cap Growth Equity Composite) holdings and position weights, excluding
cash, compared to the respective weights in the iShares S&P 500 ETF (SPY) as of 03/31/18, and was calculated using
Thomson Reuters.
5) The Rolling Returns bar chart represents the rolling 1, 3, 5, 10 and 15-year returns of the Lateef Non-Taxable Multi-
Cap Growth Equity Composite (“Composite”), which were calculated annually at year-end. The data is as of
December 31, 2017. The returns presented are calculated using the returns of the entire Composite and do not
represent the returns of an actual account in the Composite. These rolling returns are measured against the S&P
500® Index. This presentation is provided for informational purposes only and is intended for Investment Professional use.
1974 2017
This document is not complete without the “Important Disclosures” pages. 22.Footnote Disclosures continued
IMPORTANT DISCLOSURES
6) This chart illustrates the Style Factor Characteristics of the Multi-Cap Growth Equity Representative Account holdings
(an actual account in the Non-Taxable Multi-Cap Growth Equity Composite) compared against the iShares Russell
1000 ETF (IWB), for the period 12/31/2009 to 9/30/2016. The comparison was prepared using Bloomberg’s U.S. Equity
Fundamental Factor Model. Please refer to Bloomberg Style Factor Definitions on the following page for additional
information on these Factors.
7) These charts illustrate the Style Factor Characteristics of individual holdings (Wynn Resorts and Visa, Inc.) compared
to the Lateef Universe’s typical characteristics relative to the iShares Russell 1000 ETF (IWB), for the period 3/31/2016
to 3/31/2017. The comparison was prepared using Bloomberg’s U.S. Equity Fundamental Factor Model. Please refer
to Bloomberg Style Factor Definitions on the following page for additional information on these Factors.
8) Lateef Portfolio Characteristics were calculated internally using actual EPS figures and other financial metrics
provided by SEC filings and Bloomberg. The characteristics are based on the security weights across the Multi-Cap
Growth Equity account holdings as of 03/31/18. The weighted average market capitalization of the Multi-Cap
product’s holdings and S&P 500® are as of 03/31/18, and were provided by Bloomberg on 4/10/18. The 2016, 2017
and 2018E EPS growth of the Multi-Cap product and S&P 500® are median values as of 12/31/16, 12/31/17, and
3/31/18 respectively, as provided by Bloomberg. The 2018E P/E ratio of the Multi-Cap product and S&P 500® are
median values and were calculated using each stock’s end of day prices as of 3/31/18 and 2018 Bloomberg
consensus EPS estimates. The portfolio’s 2018E free cash flow (FCF) yield is an equal-weighted median value as of
03/31/18, and was provided by Bloomberg on 4/10/18.
This presentation is provided for informational purposes only and is intended for Investment Professional use.
1974 2017
This document is not complete without the “Important Disclosures” pages. 23.Bloomberg Style Factor Definitions
IMPORTANT DISCLOSURES
Size is a composite metric distinguishing between large and small stocks.
Value is a composite metric that differentiates “rich” and “cheap” stocks.
Dividend Yield is another dimension of value, but distinct enough to be a stand alone factor.
Leverage is a composite metric to gauge a firm’s level of leverage.
Volatility differentiates more volatile stocks and less volatile ones by quantifying “volatile” from several different
angles.
Momentum separates stocks that have outperformed over the past year and those that have underperformed.
Trade Activity is a turnover based measure. Bloomberg focuses on turnover which is trading volume normalized
by shares outstanding.
Earnings Variability gauges how consistent earnings, cash flows, and sales have been in recent years.
Profitability studies firms’ profit margins to differentiate between money makers and money losers.
Growth aims to capture the difference between high and low growers by using historical fundamental and
forward-looking analyst data.
This publication reflects the opinion of the authors as of the date noted and is subject to change without notice, and is written to express our
investment thesis. The information used in this publication has been developed externally and/or obtained from sources we believe to be
reliable; however, Lateef does not guarantee the accuracy or completeness of such information. This publication is provided for
informational purposes only and is not provided as a sales or advertising communication nor does it constitute investment advice or a
recommendation for any particular investment product or strategy for any particular investor. Economic forecasts and estimated data
reflect subjective judgments and assumptions and unexpected events may occur. Therefore, there can be no assurance that
developments will transpire as may be forecasted in this publication.
This presentation is provided for informational purposes only and is intended for Investment Professional use.
1974 2017
This document is not complete without the “Important Disclosures” pages. 24.You can also read