POSITION ON ESKOM'S REGULATORY CLEARING ACCOUNT ADJUSTMENT APPLICATION 2018/2019
←
→
Page content transcription
If your browser does not render page correctly, please read the page content below
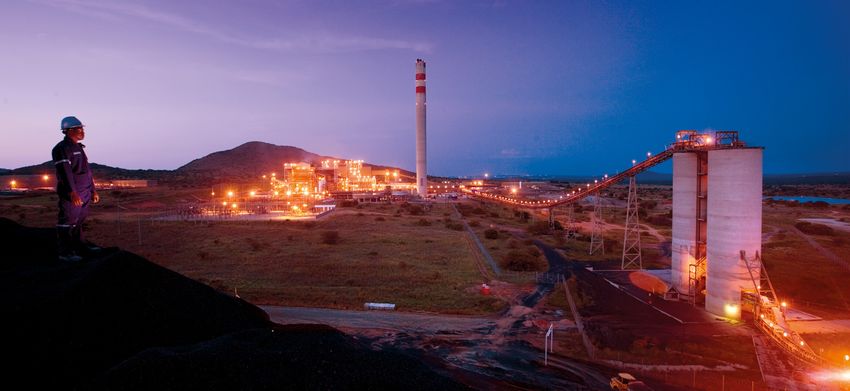
21 February 2020

POSITION ON ESKOM’S
REGULATORY CLEARING ACCOUNT
ADJUSTMENT APPLICATION
2018/2019

  Anglo American Platinum – Polokwane Smelter
THE SOUTH AFRICAN ECONOMY
MINING MATTERS IS IN CRISIS
TO SOUTH AFRICA The South African economy is in an unprecedented
South Africa’s economy is a primary economic crisis, and in the longest economic
downswing since 1945. The nature of this crisis is
commodity intensive economy,
reflected in the following facts:
producing a number of key minerals
• Government debt ballooned from 26% in 2008 to 56%
including PGMs, gold, coal, iron ore, of GDP in 2019, and is probably going to rise further.
diamonds, manganese, chrome and • Unemployment has risen to 29.1% (10 million people
titanium. Almost one fifth of the are unemployed).
economy is dependent on the • State-owned enterprises are a significant source of the
mining sector. fiscal and economic woes, particularly Eskom and SAA.
• In 2018, fixed investment fell by 1.4% to 17.9% of GDP
Notwithstanding the manifold challenges the (compared with a global average of 26.3%).
industry is facing, mining continued to make a
major contribution to the South African economy.
In 2019, the mining industry:
MINING NEEDS AFFORDABLE
Contributed R360.9 billion to GDP
AND RELIABLE ELECTRICITY
Electricity is key to sustaining mining operations and
Contributed R94.7 billion to fixed investment the processing of minerals in South Africa. The mining
industry needs an affordable and reliable supply of
Sold R538.9 billion of primary minerals electricity to operate deep-level and technologically
complex mines and to support the continued
Exported R348.2 billion of its products beneficiation of the country’s mineral resources.
Paid R8.6 billion in royalties The sector is both a supplier of primary energy to
generate electricity (>90%) and a large consumer
Paid R24.3 billion in taxes of electricity, consuming more than 30% of total
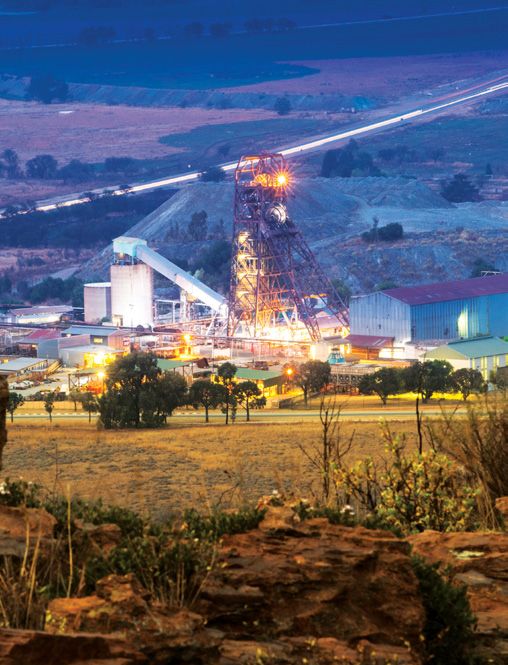
electricity supply if smelters and refineries are Implats – Impala Platinum
Paid R32.9 billion in value added tax taken into account.
in terms of net outflow
Paid R16 million in transfer duties In 2019, the In 2019, 418.5 hours, the
Employed 454,861 people mining sector equivalent of 30 days were
spent around lost due to load shedding/
Paid employees R135.9 billion
R30 billion on curtailment amounting to
Contributed R22.7 billion to PAYE on behalf
of employees electricity estimated production losses of
between R7 billion – R12 billion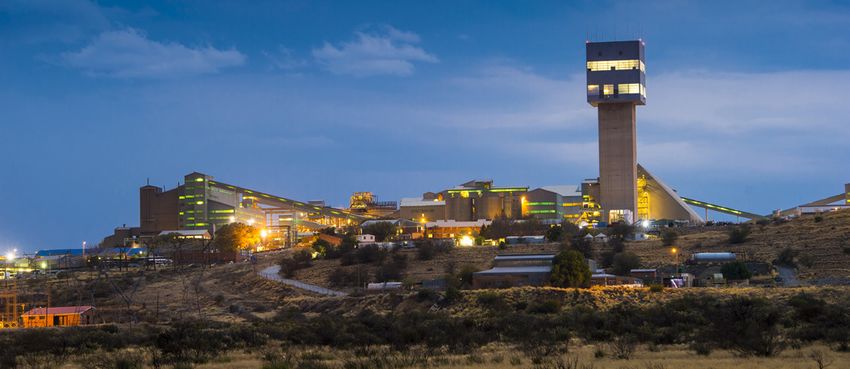
ANALYISING ESKOM’S RCA ESKOM’S PERFORMANCE, UNAFFORDABLE TARIFF INCREASES
2018/2019 APPLICATION AND THE CONSEQUENCES
Eskom has applied for another Regulatory Clearing
Account (RCA) adjustment for the 2018/2019 financial
Historical, and projected plant performance of the Eskom fleet
year. This is in addition to the annual electricity tariff
increases and the Regulatory Clearing Account (related Eskom fleet plant availability
to the MYPD3) increase granted to Eskom by the
90.00 18.00
National Energy Regulator of South Africa (NERSA)
80.00 16.00
in March 2019, which will increase the electricity by
70.00 14.00
PCLF and UCLF (%)
accumulative R655.2 billion (29.5%) by 2021/2022.
60.00 12.00
EAF (%)
The new application, if granted, will effectively increase 50.00 10.00
already high electricity tariffs by R27.3 billion or a 40.00 8.00
further 15% on average. 30.00 6.00
20.00 1.00
The major increased costs Eskom has applied for in its 10.00 2.00
RCA 2019 application are: 0.00 0.00
2010 2011 2012 2013 2014 2015 2016 2017 2018 2019 2020 2021
R5.5
UCLF PCLF EAF Source: NERSA decision 2018/19
in respect of a
revenue variance
(between planned Definitions:
billion and actual) Energy Availability Factor (EAF) –
the percentage of maximum energy
Unplanned Capacity Load Factor (UCLF) –
measures the lost energy due to unplanned
Planned Capability Loss Factor (PCLF) –
measures energy loss during the period
generation that a unit is capable of supplying energy losses resulting from equipment because of planned shutdowns.
to the electrical grid, limited only by planned failures and other plant conditions.
R14.1
and unplanned outages.
in respect of coal
(R12.4billion) and
coal related costs
billion (R1.6billion) Historically, Eskom’s EAF (the maximum amount Some of the reasons for the poor EAF
of energy Eskom’s fleet can produce) was at levels performance includes:
above 85%. The EAF has been in decline since • Lack of and poor planning of maintenance
R3.3
2011 to levels of 77.3% in 2016/2017, improving to procedures by Eskom.
in respect of 78% in 2017/2018. This progress reversed into a
• Poor procurement practices and delays in
operating costs massive regression lately.
procurement (of coal and spare parts) due to
billion In its MYPD 4 application, Eskom projected further additional controls put in place to reduce fraud.
improvements in its performance levels to 80% • Lack of long-term maintenance on units that are
EAF, 10% UCLF (unplanned outages) and 10% PCLF more than 20 years old.
R3.4 in respect of open-
cycle gas turbines
(planned outages) in 2018/2019. However, Eskom
only achieved performance levels of 69.95% EAF,
18.31% UCLF (unplanned outages), 10.18% PCLF
• Failure of Medupi/Kusile and Ingula Power
Stations to reach their nameplate 800MW and
333MW unit production levels respectively, due
billion (OCGTs)
(planned outages). to design deficiencies.
Page 1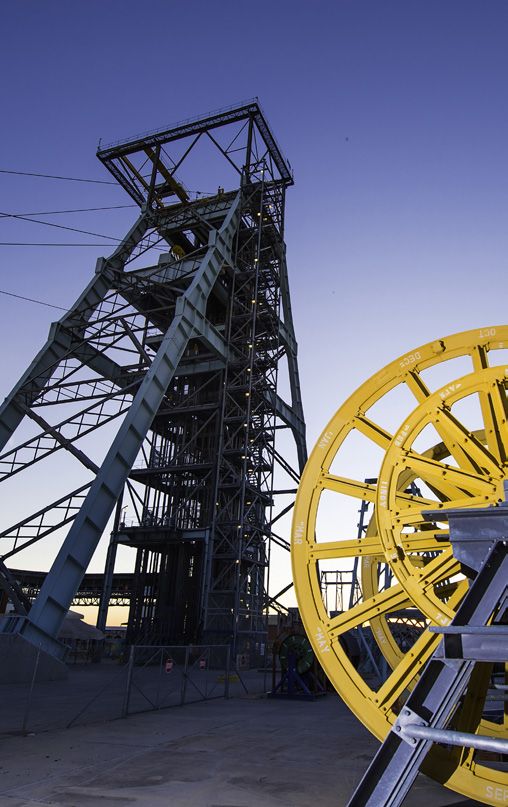
In its RCA application, Eskom indicates that the country experienced load shedding of 418.5 hours or 30 days during
its financial year. The utility estimates that it lost R762 million in revenue. The Minerals Council estimates that due to
the 30 days of load shedding, the mining industry suffered production losses of between R7 billion – R12 billion.
Mining production, EAF & load shedding since 2018
6 0
Sector lower demand:
1,622 GWh = R1.8 billion 50
EAF variation (% change)
GwH Loadshed curtailed
4 100
Mining production, vs
Sector load shedding
Production losses: 150
2
R7-12 billion 200
250
0
300
-2 Eskom losses: 350
R762 million 400
-4 450
01/01
02/01
03/01
04/01
05/01
06/01
07/01
08/01
09/01
10/01
11/01
12/01
01/01
02/01
03/01
04/01
05/01
06/01
07/01
08/01
09/01
01/01
11/01
12/01
2018 2019
Mining production GwH EAF
Sources: Statistics South Africa, Dept of Mineral Resources & Energy, Eskom, Minerals Council South Africa
Eskom did not factor in the consequences of its poor performance on its sales.
Steep electricity tariff increases have resulted in demand from the mining industry for electricity decreasing by
1,622GWh as well, resulting in Eskom losing a further estimated amount of R1.8 billion during the 2018/2019 financial Sibanye-Stillwater – West Wits Gold Plant
year. This was due to loss making mines closing shafts and streamlining operations.
Eskom & mining at an Inflection Point Eskom income from mining at an Inflection Point
48 35 33,000
Eskom revenue from mining (R’billion)
Eskom income from mining (R’billion)
30
43 32,000
GWh sold to mining
Tariff: +8% 25
38 31,000
GWh: -5.3%
20
33 30,000 As predicted by the Minerals Council in its
15
comments on the MYPD 4 application, the
28 29,000 combination of unaffordable and unreliable
10
electricity from Eskom, and the decrease in
23 5 28,000
2015 2016 2017 2018 2019 2020 2021 2022 2023 consumption from customers have resulted in an
2007
2008
2009
2010
2011
2012
2013
2014
2015
2016
2017
2018
2019
2020
2021
2022
2023
inflection point where higher tariff increases will
MYPD4 expected income Actual & forecast RCA impact
6% adjustment: 2049-2023 GWh R’billion
no longer result in higher income for the utility, but
will only serve to accelerate its own ‘death spiral’.
Sources: Eskom, Minerals Council South Africa Sources: Eskom, Minerals Council South Africa
Page 2
REVENUE VARIANCE                                            COAL AND COAL RELATED COSTS
Eskom RCA application                 Eskom is seeking a    Eskom RCA application                    Eskom is seeking to
                                     revenue variance of                                             recover R14.1 billion
                                          R5.450 billion                                                in respect of coal
                                                                                                       (R12.4 billion) and
Electricity generation
                                                                                                        coal related costs
Nersa determination:                        212,701GWh                                                       (R1.6 billion)
Actual achieved by Eskom:                  208,779GWh
                                                            The cost of coal
Difference:                                   3,925GWh
                                                            Nersa determination:                             R39.3 billion
Sales                                                       Actual expenditure by Eskom:                    R49.9 billion
Nersa determination:                        188,082GWh      RCA adjustment:                                    R1.7 billion
Actual achieved by Eskom:                   185,930GWh      Difference:                                      R12.4 billion
Difference:                                    2,152GWh
                                                           Underlying causes: The excessive coal costs, is entirely
Exports to SADC countries                                  due to Eskom opting to sign expensive short- and
Nersa determination:                         13,634GWh     medium-term coal contracts and to reduce investment
Actual achieved by Eskom:                    12,367GWh     in and neglect of the more cost-effective cost-plus
                                                           mines and the even cheaper fixed-price long term coal
Difference:                                    1,267GWh
                                                           contracts, over the years. The latter category mines
Underlying causes: Eskom’s revenue shortfalls are due      also had to revert to more costly short- and medium-
to unavailability of electricity, a function of years of   term supplementary sources of coal, as the lack of new                         Anglo American Coal – Greenside
mismanagement and neglect of plant maintenance.            investment curtailed their production.

                                                           Coal purchases by Eskom during FY2019
                                                                                                                              Cost plus                   Long term         Short- and medium-
                                                                                                                              contracts                    contracts             term contracts

                                                            Nersa assumed share of total volumes                                   38%                           32%                       30%
                                                            Actual share of total volumes                                          33%                           25%                       42%
                                                            Actual coal burnt                                                   38.2Mt                        28.9Mt                     48.6Mt
                                                            Actual coal burnt expenditure                                       R17.2bn                       R7.4bn                   R26.5bn
                                                            Average price per tonne                                       R452/tonne                     R257/tonne                 R555/tonne
                                                            Characteristics                                    Export prices has little                Export price          Eskom argues that
                                                                                                                       direct impact                  has no impact         suppliers use export
                                                                                                                                                  (Cheapest source           prices as reference
                                                                                                                                                          of coal)               during contract
                                                                                                                                                                                    negotiations
                                                                                                                                                                               (Most expensive
     Seriti – Kriel Colliery
                                                           Sources: Eskom, Minerals Council South Africa                                                                        source of coal)

                                                                                         Page 3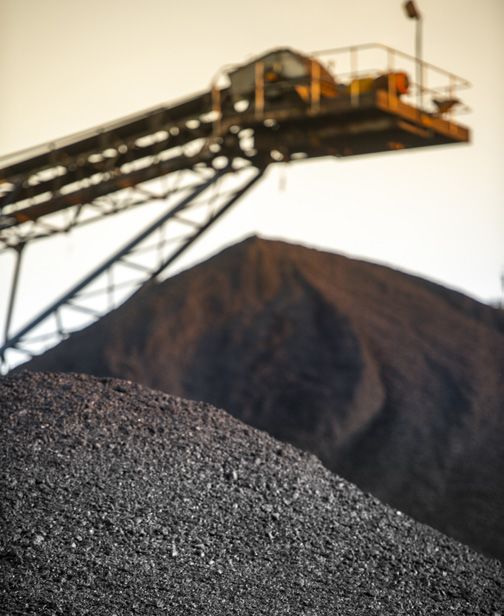
Cost plus contracts
The better performing power stations are supplied by                                                Short- and medium-term pricing contracts
one source of coal with a known grade and quality, in                                               NERSA determined that Eskom would source                      OPERATING COSTS
many instances from cost plus mines.                                                                around 30% of its required coal volumes from
                                                                                                    short- and medium-term contracts. However,                    Operating expenditure includes all costs incurred in
Due to oversupply from some cost plus mines in the                                                                                                                the day-to-day running of the business. These include
                                                                                                    Eskom procured 48.552Mt which represents
past and under investment to replace production,                                                                                                                  manpower costs, maintenance costs, other costs,
                                                                                                    around 42% of its coal from these contracts.
cost plus mines were not able to supply the required                                                                                                              arrears debt and corporate overheads.
amounts of coal themselves. Mines are designed to                                                   At R555 per tonne of coal, the cost per
supply a certain amount of coal tonnages per year. Once                                             tonne of coal procured by way of short- and                   Eskom RCA application                 Eskom is seeking
the amount of coal produced decreases, economies of                                                 medium-term contracts is R205 per tonne more                                                    R3.3 billion in respect
scale decline, resulting in higher unit costs for coal. In                                          expensive than the R350 per tonne allowed                                                          of operating costs
order to supplement the shortages, short- and medium-                                               by NERSA.
term contracts are used to meet Eskom’s requirements.                                                                                                             Employee benefits
                                                                                                    The higher cost of coal from this source can be               Nersa determination:                     R24.314 billion
Cost plus mines supplied 38.2Mt of coal, which was                                                  attributed to contractors referencing export coal             Actual expenditure by Eskom:              R27.522 billion
7Mt less than assumed in the Eskom application, at 15%                                              prices; the inability of small producers to provide           Difference:                               R3.208 billion
higher-than-forecasted rand per tonne prices.                                                       volumes; a higher probability of middlemen
                                                                                                    involved in the supply chain; poor quality of                 Number of employees
Long term fixed price contracts
                                                                                                    coal and the cost of cleaning the coal to the                 Nersa determination:                  32,954 employees
Long term fixed price contracts offer the lowest cost                                               appropriate quality; and transport costs.                     Actual Eskom:                         39,292 employees
option at R261 per tonne and should be the coal of
                                                                                                                                                                  Difference:                            6,323 employees
choice. Minerals Council members have reported that
they offered fixed term price contracts to Eskom, but                                                                                                             Maintenance
that these offers were declined.
                                                              Percentage of coal transported on road vs.                                                          Nersa determination:                        R15.2 billion
                                                              conveyor belt/rail
Eskom only procured 25% of its coal from these                                                                                                                    Actual expenditure by Eskom:                 R14.1 billion
suppliers compared to the NERSA determination of 32%.                                              100%                                                           Difference:                          Eskom underspent
Fixed price contracts supplied 28.9Mt of coal, which is                                                                                                                                                    by R1.1 billion
                                                              Transport by road vs conveyor/rail

8Mt less than planned.                                                                             80%
                                                                                                                                                                  Underlying causes: The overrun in operating costs is a
The decline in coal supply from cost plus mines can                                                60%                                                            consequence of a bloated workforce. A 43% increase in
be attributed to a lack of investment by Eskom into                                                                                                               the size of the workforce since 2007 is responsible for a
the development of new mines due to limited funds.                                                 40%                                                            mere 3.5% additional production capacity. The average
Consequently, Eskom has increasingly relied on other,                                                                                                             cost to company of an Eskom employee amounts
more expensive sources of coal.                                                                    20%                                                            to R700,000 per annum. This far exceeds all other
                                                                                                                                                                  industries. Probably the most exasperating portion of
Eskom blocked investment into new equipment and                                                     0%                                                            the RCA is that Eskom did not use its full maintenance
the opening up of new mining areas at existing mines,                                                       115.6       38.148          28.9         48.552       budget allocation. It is no wonder that Eskom’s EAF
which directly impacted coal production costs at cost                                                       Total       Cost plus     Long term    Short/medium
                                                                                                                                       contract      contract     has fallen from 87.5% to 69.95% over the same period,
plus collieries. At the Exxaro Arnot mine, Eskom refused
                                                                                                                                                                  causing efficiency to deteriorated drastically.
to allocate capital to develop a new and cheaper mining                                            Road     Conveyer/rail       Million tonnes of coal
area resulting in the closure of the Arnot colliery and the
loss of 1,500 jobs.                                            Sources: Eskom, NERSA, Minerals Council South Africa

                                                                                                                            Page 4
OPEN-CYCLE GAS TURBINES
Eskom RCA application Eskom applying for
R3.423 billion
OCGT
Nersa determination: R325 million
Actual expenditure by Eskom: R3.768 billion
Difference: R3.443 billion
Price per unit of electricity
Nersa determination: 93c/kWh
Actual expenditure by Eskom: R3.14/kWh
Difference: R2.21/kWh
Underlying causes: High and costly OCGT usage was a
direct consequence of poor EAF, itself a consequence of Petra Diamonds – Finsch Mine
the long period of mismanagement.
IMPACT ON THE MINING INDUSTRY
Given that the mining sector is a price taker, rising electricity prices are a critical concern
to the South African mining industry. The stepwise increases in electricity tariffs have been
higher than commodity price movements by 12 percentage points since 2009.
Electricity tariff trend vs commodity price changes
60
70
40
50
Percentage Points (%)
Rates of change (%)
20
30
0
10
-20
-10 -40
-30 -60
2000
2001
2002
2003
2004
2005
2006
2007
2008
2009
2010
2011
2012
2013
2014
2015
2016
2017
2018
2019
Rand Refinery
Variance (RHS) Tariff escalation (LHS) Commodities prices (LHS) Sources: Statistics South Africa, World Bank,
SA Reserve Bank, Minerals Council South Africa
Page 5The mining sector’s electricity bill, has increased
to around R30 billion in 2019. Mining production vs Electricity Availability Factor
The total additional increase in the electricity bill 120 6.00
for the mining sector, if the 2019 RCA application
Variation in Eskom elecvricity availabilityin South Africa
were to be granted, would amount to R14.45 115
4.00
billion assuming that no companies will go under.
Monthly mining production (Index)
If the RCA application were granted, the cost of 110
electricity as a percentage of production costs 2.00
would increase from 24.7% to 30.1% across the 105
gold industry, from 22.4% to 26.7% in iron ore, and –
from 13.1% to 15.9% in PGM mining. 100
Should the RCA application be granted, more -2.00
95
than 8,200 jobs would be at risk across the mining
industry. -4.00
90
Eskom is contributing to the inability of mining
to reach its full potential. Electricity supply is 85 -6.00
2000
2001
2002
2003
2004
2005
2006
2007
2008
2009
2010
2011
2012
2013
2014
2015
2016
2017
2018
2019
erratic and tariffs are continuing to rise at an
unsustainable rate, causing losses in production,
and cost structures of the sector to shift towards
Monthly mining production Electricity availability Sources: Statistics South Africa, Dept of Minerals Resources & Energy
greater dependency on electricity.
Mining production variation since 2008 Gross & net fixed investment snapshot
200
70,000
150
60,000
Index (2008 = Base)
100
Rand Million (2010=100)
50 50,000
0 40,000
-50 30,000
-100 20,000
-150 10,000
-200 –
2008 2009 2010 2011 2012 2013 2014 2015 2016 2017 2018 2019 Fixed Investment in new mines have been -10,000
1993
1994
1995
1996
1997
1998
1999
2000
2001
2002
2003
2004
2005
2006
2007
2008
2009
2010
2011
2012
2013
2014
2015
2016
2017
2018
2019
deteriorating since 2011, and coincided with the
Gold (27%) Iron Ore (16%) PGM’s (12%) realisation that electricity was not assured into
Copper (7.5%) Manganese (6.8%) Coal (4.5%) Gross fixed capital formation Net fixed capital formation
the future, after the shocks of the 2007/8 load
Other (4.5%) Other metallic (4.2%) Chrome (2%) Construction of mines
shedding and the double digit tariff increases
Sources: Statistics South Africa, Dept of Mineral Resources & Energy, after that.
Minerals Council South Africa Sources: Quarterly Financial Survey; StatsSA, p0044, Quantec
Page 6You can also read