Positive effects of COVID 19 lockdown on air quality of industrial cities (Ankleshwar and Vapi) of Western India - Nature
←
→
Page content transcription
If your browser does not render page correctly, please read the page content below
www.nature.com/scientificreports
OPEN Positive effects of COVID‑19
lockdown on air quality
of industrial cities (Ankleshwar
and Vapi) of Western India
Ritwik Nigam1, Kanvi Pandya2, Alvarinho J. Luis3, Raja Sengupta4 & Mahender Kotha1*
On January 30, 2020, India recorded its first COVID-19 positive case in Kerala, which was followed by
a nationwide lockdown extended in four different phases from 25th March to 31st May, 2020, and
an unlock period thereafter. The lockdown has led to colossal economic loss to India; however, it has
come as a respite to the environment. Utilizing the air quality index (AQI) data recorded during this
adverse time, the present study is undertaken to assess the impact of lockdown on the air quality of
Ankleshwar and Vapi, Gujarat, India. The AQI data obtained from the Central Pollution Control Board
was assessed for four lockdown phases. We compared air quality data for the unlock phase with a
coinciding period in 2019 to determine the changes in pollutant concentrations during the lockdown,
analyzing daily AQI data for six pollutants (PM10, PM2.5, CO, NO2, O3, and SO2). A meta-analysis of
continuous data was performed to determine the mean and standard deviation of each lockdown
phase, and their differences were computed in percentage in comparison to 2019; along with the
linear correlation analysis and linear regression analysis to determine the relationship among the air
pollutants and their trend for the lockdown days. The results revealed different patterns of gradual
to a rapid reduction in most of the pollutant concentrations (PM10, PM2.5, CO, SO2), and an increment
in ozone concentration was observed due to a drastic reduction in NO2 by 80.18%. Later, increases
in other pollutants were also observed as the restrictions were eased during phase-4 and unlock 1.
The comparison between the two cities found that factors like distance from the Arabian coast and
different industrial setups played a vital role in different emission trends.
The novel coronavirus termed as COVID-19 by World Health Organization (WHO), first emerged in late Decem-
ber 2019 in Wuhan, China. In early March 2020, due to its rapid spread, the WHO declared COVID-19 as a
pandemic. By July 8, 2020, it spread to more than 210 countries worldwide, infecting over 11 million people and
causing 539,026 mortalities1. As COVID-19 is highly transmissible, along with a high mortality rate2, countries
worldwide have taken various precautionary measures, such as large scale COVID-19 screening tests, quaran-
tine, social distancing, wearing of mask, sanitization of hands, etc3. This led to 2–4 weeks of regional lockdowns
to limit the spread of the virus, all of which have subsequently restricted economic activities around the world
leading to different regional repercussions4.
In India, a student who had returned from Wuhan, China, was the first COVID-19 positive case recorded
on January 30 in K erala5. India took unprecedented measures to contain the infection from across borders and
within its territory. International travel and non-essential traveling visas were suspended on March 13, 2020.
The Indian railways shut down its operations on March 23, 2020, for the first time in its history spanning over
167 years. A 21-day nationwide lockdown phase-1 was enforced from March 25 to April 14, which was extended
further until May 31, 2020. Divided into different phases, the lockdown was marked by increasing relaxations
in socio-economic activities in less infected regions. The timeline of the various COVID-19 lockdown phases
in India6 is depicted in Fig. 1.
1
School of Earth, Ocean and Atmospheric Sciences (SEOAS), Goa University, Taleigao Plateau, Goa 403206,
India. 2Department of Geography, Faculty of Science, The Maharaja Sayajirao University of Baroda, Fatehgunj,
Vadodara 390002, India. 3Earth System Science Organization‑National Centre of Polar and Ocean Research,
Ministry of Earth Science, Govt. of India, Headland Sada, Goa 403804, India. 4Department of Geography & McGill
School of Environment, McGill University, Montreal, QC H3A0B9, Canada. *email: mkotha@unigoa.ac.in
Scientific Reports | (2021) 11:4285 | https://doi.org/10.1038/s41598-021-83393-9 1
Vol.:(0123456789)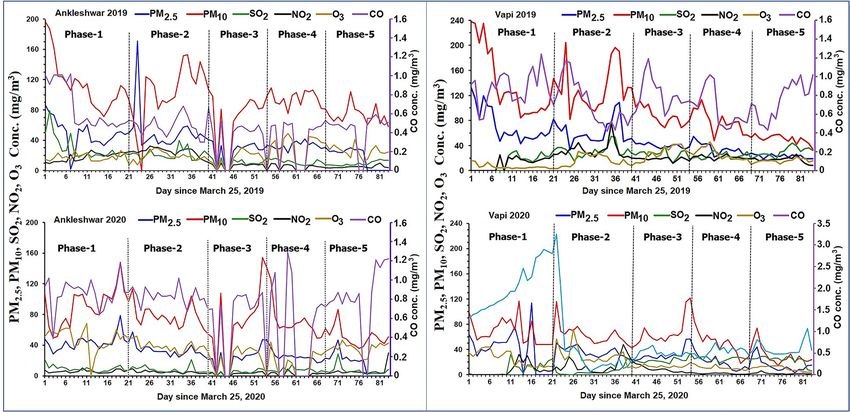
www.nature.com/scientificreports/
Figure 1. COVID-19 timeline of India. (Source: Ministry of Home Affairs, Govt. of India).
While the socio-economic devastation due to COVID-19 has been colossal around the world, which required
"a wartime" plan from every corner of the world7 it has also come as the silver lining for the environment8.
The United Nations Environment Program chief Inger Andersen believes these environmental changes are
temporary7, as the global environment had a small respite before industrial activities resumed since February
2020. Recent studies have reported improvement in air quality due to restrictions placed upon industrial activities
during the lockdown. Climate scientists have indicated that greenhouse gaseous (GHGs) concentration could
drop to levels not seen since World War II. Highly industrialized cities located in cold climate zones observed a
higher reduction in air p ollution9.
Lockdown in various countries viz., France, Germany, Italy, Spain, and China led to shutting down of power
plants, transportation, and other industries which resulted in drastic decrease in concentration levels of GHGs,
NO2, PM2.5, PM10 and CO but spikes in ozone concentration simultaneously, primarily in Europe and large
Chinese cities3,10–14. The air quality changes during COVID-19 lockdown over the Yangtze River Delta Region
suggest that the reduced human activity and industrial operations lead to significant reduction in PM2.5, NO2,
and SO214. Significant improvement in air quality, as evidenced from the reduction in Particulate Matter, NOx,
SO2 and CO, during the COVID19 lockdown period was observed in the Hangzhou m egacity15. Reduction of
NO2 (49%), and CO (37%) concentrations in the USA during lockdown were positively correlated with higher
population density3. The impact of the measures on the air quality is d iscussed16 for the city of Rio de Janeiro,
Brazil by comparing the particulate matter, carbon monoxide, nitrogen dioxide and ozone concentrations during
the partial lockdown with those of the same period of 2019 and also with the weeks prior to the virus outbreak. A
positive impact of the social distancing measures is reported17 on the concentrations of the three main primary
air pollutants (PM10, NO2 and CO) of the São Paulo and Rio the Janeiro, the two most populated cities, wherein,
the CO levels showed the most significant reductions (up to 100%) which was related to light-duty vehicular
emissions. Changes in levels of some air pollutants due to a set of rapid and strict countermeasures limiting
population’s mobility and prohibiting almost all avoidable activities was evaluated in the in Salé city (North-
Western Morocco)18. Barcelona city was assessed19 for air quality using a remote sensing dataset provided by
ESA’s Tropospheric monitoring instrument (TROPOMI) along with local air quality monitoring data to assess
differences in air quality during the lockdown and one month before the lockdown. The observed reductions
were 31% and 51% in NO2 and PM2.5, respectively, due to lockdown. The National Aeronautics and Space Agency
(NASA), using the TROPOMI sensor, observed a reduction of 10–30% in Nitrogen Dioxide (NO2) in central and
eastern China during early 202020. 27% reduction was observed in nitrogen oxides concentration in comparison
to the last five years, and non-uniform trends in O 3 concentrations during the lockdown in California basin
region21. Black carbon reduction due to the lockdown imposed restricted anthropogenic activities is observed in
Hangzhou city of China22. A reduction of 43% and 31% in PM10 and PM2.5, while a 17% increment in O3 concen-
tration during the lockdown period and past 4-year values for different regions of India has also been r eported23.
The common air pollutants in cities and industrial towns are N O2, SO2, PM10, which are responsible for car-
diovascular and respiratory diseases24,25. The primary sources of these pollutants are vehicular exhaust, road dust,
and mainly metal processing i ndustries26,27. The majority of the health benefits were observed with the reduction
in NO2 in 31 provincial capital cities in C hina12. Continuous degradation of air quality in some of the Indian
metropolitan cities (New Delhi, Mumbai, Kolkata, Chennai), that often exceed the standards set by WHO and
Central Pollution Control Board (CPCB), India, cemented their regular presence in the list of top 20 polluted
cities of the w orld28–30. The Ministry of Earth, Forest, and Climate change (MoEFC) under its National Clean
Air Programme (NCAP) launched a five-year action plan in 2019 to reduce by 30% the nationwide concentra-
tion of particulate m atter31. Due to the mandatory lockdown imposed across the country, 88 Indian cities have
observed a drastic reduction in air p ollution23.
Gujarat, which is the industrial state in western India, observed a significant reduction in major air pollutants
between the lockdown period (March 25 to April 20, 2020) mainly due to restrictions on traffic and slowdown
of production at f actories32. According to the CPCB-AQI database, air pollution reduction occurred merely in
four days since the l ockdown33. In Vapi, PM10, PM2.5, NO2, SO2 are the major air pollutants significantly emitted
by transport vehicles and i ndustrial34.
Scientific Reports | (2021) 11:4285 | https://doi.org/10.1038/s41598-021-83393-9 2
Vol:.(1234567890)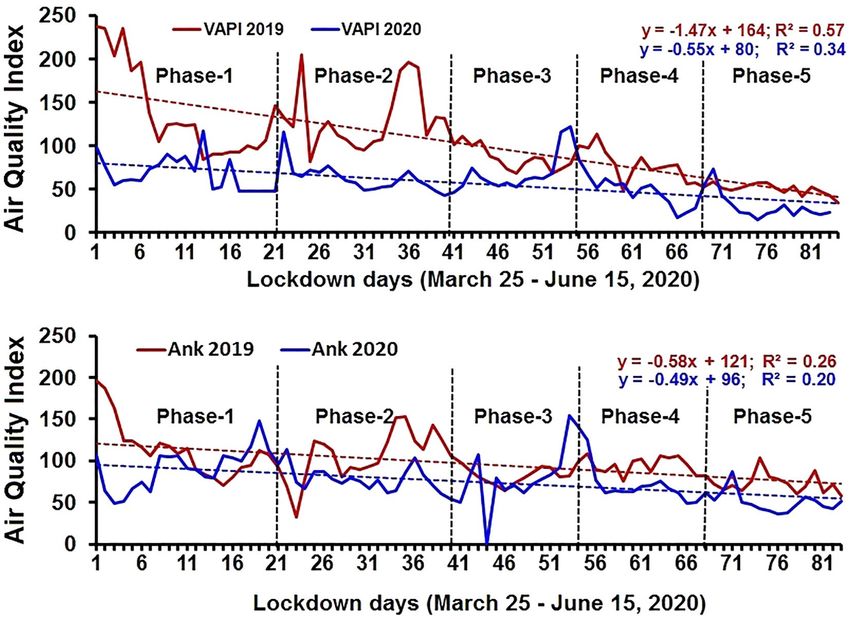
www.nature.com/scientificreports/
Figure 2. The locations of industrialized cities Ankleshwar and Vapi in Gujarat, India.
This present study is undertaken to determine the differences in concentration of six pollutants (PM10, PM2.5,
CO, NO2, O3, and S O2) during the lockdown period (March 25 to June 15, 2020) with the comparable period in
2019, to assess the impact of lockdown on air quality in cities Vapi and Ankleshwar of Gujarat, India.
Study area
Ankleshwar is located at 21.62°N, 73.01°E is a municipality under Bharuch district juridiction in Gujarat, India
(Fig. 2). It is located in the south Gujarat region in between Ahmedabad—Mumbai industrial corridor on the
southern banks of lower reaches of the Narmada river. The city has plain topography with an average elevation
of 15 m above mean sea level. The climate of South Gujarat region is mainly influenced by the Arabian Sea. Pre-
monsoon showers announce the arrival of monsoon only in late june, with hot summer months (March to June),
heavy to moderate monsoon rain (July to September), and moderate winter months (November to February).
Ankleshwar Gujarat Industrial Development Corporation is spread over an area of 1600 hectares and houses
more than 2000 industries with over 1500 chemical plants producing pharmaceuticals, paints, and pesticides.
Vapi, located at 20.3893°N 72.9106°E, is a municipality under the Valsad district in Gujarat, India (Fig. 2),
located at the southernmost tip of Gujarat between Surat in the north and Mumbai (Maharashtra) in the South.
Sandwiched between the union territories of Daman & Diu and Dadar and Nagar Haveli, the city is 7 km inland
from the Arabian sea; thus, experiences coastal tropical weather with annual rainfall ranging from 100 to 120 in.
starting from late June and go on till S eptember35. Vapi is also a major industrial hub, 160 km south of Ankle-
shwar, predominantly housing chemical plants that account for 70% of the total industries in the city. Other
industries are packaging, paper, plastics, and rubber. Vapi is also known as a ‘Paper hub’ as it houses the best
quality Kraft paper manufacturing units in India. The city has the largest Common Effluent Treatment Plant (or
CETP) in A sia36. However, due to ever-increasing air and water pollution, Vapi and Ankleshwar are the most
industrial clusters of Gujarat (especially Vapi regularly makes it to the list of the most polluted cities in India37.
Material and method
The Government of India, in 2016, under its ’Swacch Bharat Mission,’ launched the ’National Air Quality Index’
(NAQI)38. The NAQI bulletin is published daily by the Central Pollution Control Board (CPCB). There are two
different techniques to monitor air quality; online monitoring network and manual monitoring network. The
online monitoring network is more reliable than its counterpart as it provides pollutant concentration data almost
in real-time. The automatic monitoring network AQI consists of monitoring of eight major parameters (Table 1)
Scientific Reports | (2021) 11:4285 | https://doi.org/10.1038/s41598-021-83393-9 3
Vol.:(0123456789)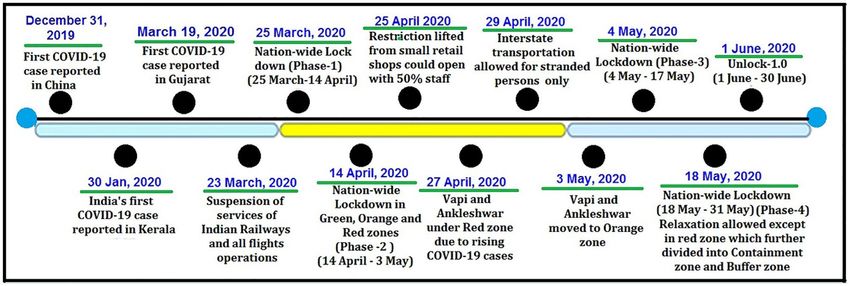
www.nature.com/scientificreports/
AQI Category AQI PM10 PM2.5 NO2 O3 CO SO2
Good 0 - 50 0- 50 0 - 30 0 - 40 0 - 50 0 - 1.0 0 - 40
Satisfactory 51 - 100 51 - 100 31 - 60 41 - 80 51 - 100 1.1 - 2.0 41 - 80
Moderately
101 - 200 101 - 250 61 - 90 81 - 180 101 - 168 2.1- 10 81 - 380
polluted
Poor 201 - 300 251 - 350 91 - 120 181 - 280 169 - 208 10.1 - 17 381 - 800
Very poor 301 – 400 351 - 430 121 - 250 281 - 400 209 - 748* 17.1 - 34 801 - 1600
Severe 401 - 500 430 + 250+ 400+ 748+* 34.1+ 1600+
Table 1. Breakpoints for AQI Scale 0–500 (all pollutants are in units of μg/m3 and CO is expressed in units of
mg/m3). *Hourly monitoring Source: Central Pollution Control Board39.
to compute the index value, while the manual monitoring network AQI considers mainly P M10, SO2, and N
O2
ollutants39. Under the NAQI, the averaging time for pollutants such as: P
p M2.5, PM10, NO2, SO2, Pb, and N
H3 is
24-h whereas, O 3 and CO have the averaging time of 1-h. Except for CO which is measured in mg/m3, all other
seven pollutants are measured in μg/m3.
The breakpoint table of daily NAQI provides numeric values and color codes. The color codes are dependent
on the numeric values: the AQI value between 0 and 50 suggests it as good with minimal impact on health and
shown by dark green color code. Likewise, values in the range of 51–100 are termed as satisfactory (light green)
wherein minor breathing discomfort occurs to sensitive people, range of 101–200 is termed as moderately pol-
luted (yellow), range of 201–300 is termed as Poor (orange), values in the range of 301–400 are termed as very
poor (light red) and, values in the range of 401–500 as listed as severe (dark red)40.
The objective of the NAQI is to assist with monitoring of daily ambient air quality and generate a multi-
temporal database. The AQI keeps vigil on air pollutant concentration levels to determine their violation above
the permissible limits of ambient air quality in the given area. 200 AQI stations are continuously monitoring air
quality across the country40. All India AQI monitoring consists of several organizations like the CPCB, the State
Pollution Control Boards (SPCB), National Environmental Engineering Research Institute (NEERI), Nagpur, and
pollution control committees. The CPCB coordinates with all these agencies to ensure the uniformity, consist-
ency of the air quality data, and provide technical and financial support to them for operating the monitoring
stations38.
The mathematical equation for calculating sub-indices of AQI is as follows:
IHI − ILO
Ip = × (CP − BPLO) + ILO, (1)
BPHI − BPLO
where IP is AQI for pollutant “P” (Rounded to the nearest integer), C P the actual ambient concentration of pol-
lutant “P”, B
PHI the upper-end breakpoint concentration that is greater than or equal to C P, BPLO the lower end
breakpoint concentration that is less than or equal to C P, ILO the sub-index or AQI value corresponding to B PLO,
IHI the sub-index or AQI value corresponding to B PHI.
The total lockdown duration of 84 days was divided into five different periods based on different nationwide
lockdown phases imposed by the Government of India to compare with 2019. The five phases of lockdown (four
lockdowns and one unlock-1.0) had different sets of rules and restrictions for the general public. Phase-1 of the
nationwide lockdown lasted from March 25 to April 14, 2020, with complete restrictions on economic activities.
During the second lockdown phase which lasted for 19 days starting from April 15 to May 3, various parts of
the cities were color-coded into green, orange, and red zones based on the number of COVID-19 positive cases;
the red zones indicating rapidly rising cases had total lockdown, orange zones (moderately rising cases) were
provided with some relaxation, and the green zone (low positive cases) had least restrictions among them. The
third phase lasted for 14 days (May 4–17, 2020), whereas, the fourth phase (labeled as the last period of nation-
wide lockdown with change from the green, orange and red zones to the containment zone and buffer zone)
was extended from May 18–31, 2020. The unlock 1.0 (referred to in the study as ‘phase-5’) commenced on June
1, 2020, with several restrictions uplifted everywhere, except in the containment zones. The differences in the
magnitude of restrictions imposed during various lockdown phases had an indirect impact on the fluctuation
in the air pollutant level due to the restarting of several economic activities in the cities.
The concentration values of six air pollutants ( PM10, PM2.5, NO2, O3, CO, and S O2) during the nationwide
lockdown period in 2020 and for the similar period of 2019 were downloaded from the daily NAQI data portal
Scientific Reports | (2021) 11:4285 | https://doi.org/10.1038/s41598-021-83393-9 4
Vol:.(1234567890)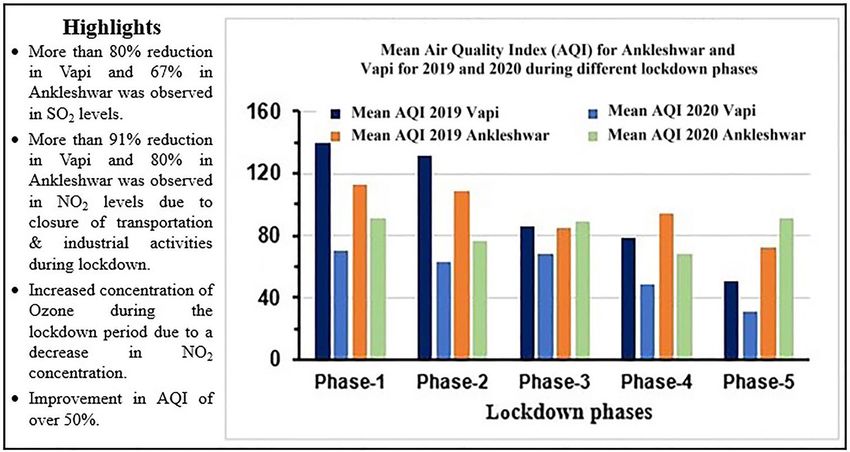
www.nature.com/scientificreports/
Figure 3. Mean concentrations of air pollutants from March 25 to June 15 for the year 2019 and 2020 for
Ankleshwar and Vapi.
PM2.5 PM10 SO2 O3 CO NO2
Mean diff Mean diff Mean diff Mean diff Mean diff Mean diff
Period (%) SD diff (%) (%) SD diff (%) (%) SD diff (%) (%) SD diff (%) (%) SD diff (%) (%) SD diff (%)
Ankleshwar
Phase-1 − 10 − 46 − 19 − 30 − 67 − 75 192 113 30 − 35 − 67 − 67
Phase-2 − 36 − 74 − 29 − 50 − 63 − 38 98 20 74 − 20 − 80 − 71
Phase-3 −6 131 5 231 − 54 − 51 44 35 84 100 − 50 33
Phase-4 − 26 −3 − 27 67 − 30 − 16 − 31 86 91 243 − 37 5
Phase-5 −5 335 24 11 − 28 123 44 −1 150 − 99 27 35
Vapi
Phase-1 − 25 − 24 − 51 − 54 − 32 − 16 310 215 132 194 − 43 − 38
Phase-2 − 40 − 59 − 52 − 56 − 81 − 30 83 64 − 22 225 − 53 −4
Phase-3 − 19 223 − 21 62 − 12 − 39 − 53 − 79 − 38 − 56 − 55 81
Phase-4 − 48 4 − 38 −1 7 − 45 − 59 − 68 − 18 − 50 − 91 − 70
Phase-5 − 35 260 − 36 135 − 24 −9 − 36 30 − 20 − 105 − 86 − 71
Table 2. Mean difference and standard deviation difference (rounded up for clarity) observed during different
lockdown phases of 2020 in comparison to the same period in 2019 for Ankleshwar and Vapi cities.
available at cpcb.nic.in which is maintained by the Ministry of Environment, Forest and Climate Change, Govern-
ment of India40. The Meta-analysis of continuous data was performed using descriptive and inferential statisti-
cal techniques to determine the number of variations (reduction or increase) in the air pollutant levels during
the different phases, to calculate the mean differences. Additionally, standard deviation was also computed to
determine the fluctuation of air pollutants during different periods. Each air pollutant’s mean differences dur-
ing different phases for both the cities were compared to determine the impact of lockdown restrictions at two
different geographical locations with similar economic characteristics. Lastly, a linear regression analysis was
performed to determine the relationship of the AQI values with the different lockdown phases.
Results
The mean distribution of air pollutants during lockdown for COVID-19 and a similar period in 2019 for the two
cities is shown in (Fig. 3 and Table 2). The phase-wise percentage variation of the mean and standard deviation
of pollutants for both cities during the lockdown is shown in Table 3. In Ankleshwar, the maximum decline was
observed in N O2 (80%) during phase-2, while in Vapi the maximum drop was also in N O2 (91%) during phase-4
of lockdown. O 3 increased by 192% and 310% in Ankleshwar and Vapi, respectively during phase-1. S O2 declined
by − 67% during phase-1 and rose to − 28% during unlock 1.0 in Ankleshwar but it dropped to a maximum of
81% during phase-2, followed by an increase to more than 7% in comparison to the 2019 period during phase-4
Scientific Reports | (2021) 11:4285 | https://doi.org/10.1038/s41598-021-83393-9 5
Vol.:(0123456789)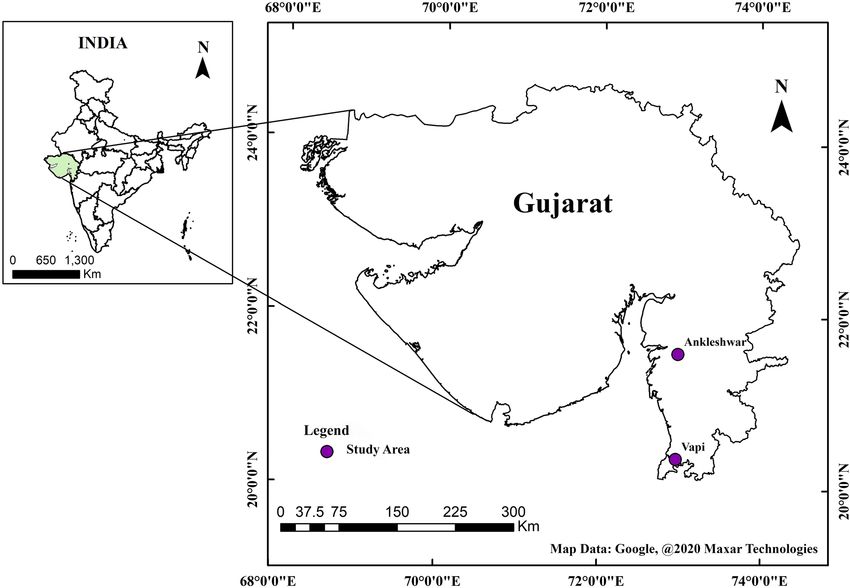
www.nature.com/scientificreports/
Phase 1 (Lockdown 1.0) Phase 2 (Lockdown 2.0) Phase 3 (Lockdown 3.0) Phase 4 (Lockdown 4.0) Phase 5 (Unlock 1.0)
Pollutant Mean Min Max SD Mean Min Max SD Mean Min Max SD Mean Min Max SD Mean Min Max SD
ANKLESWAR 2019
PM 2.5 48.670 1.870 86.410 18.750 50.731 33.470 171.000 30.138 31.881 25.780 38.800 3.995 32.943 23.070 41.660 4.751 26.482 23.870 30.060 2.076
PM 10 113.345 71.150 196.290 33.193 108.501 32.290 152.900 30.094 84.567 64.690 98.580 10.417 94.401 75.380 109.080 10.738 72.949 57.930 104.070 11.814
NO 18.015 9.230 26.670 5.690 24.689 10.610 32.590 5.892 8.139 6.680 9.710 0.823 6.732 3.790 9.340 1.762 4.882 3.130 9.890 1.748
SO 2 28.995 17.500 79.250 15.707 21.488 13.370 39.670 7.089 12.310 7.550 16.990 3.354 10.843 6.400 16.220 3.246 9.448 6.140 14.870 2.990
CO 0.663 0.460 1.020 0.236 0.479 0.300 0.680 0.110 0.439 0.380 0.520 0.043 0.477 0.430 0.530 0.031 0.502 0.430 0.590 0.043
OZONE 17.113 6.920 27.880 5.245 19.184 7.640 29.740 5.582 20.302 10.090 30.680 6.317 41.095 34.490 48.970 4.418 25.217 11.990 41.370 7.538
ANKLESWAR 2020
PM 2.5 43.694 28.540 78.540 10.112 32.439 21.610 57.280 7.735 30.107 20.230 47.270 8.919 24.424 16.970 37.110 4.615 25.259 19.140 46.790 9.012
PM 10 91.413 49.380 148.190 24.285 77.031 54.560 113.200 14.617 88.775 50.010 154.230 33.151 68.518 49.130 125.690 18.244 50.338 35.800 86.550 12.659
NO 5.849 3.400 10.410 1.887 4.894 2.540 9.150 1.669 4.066 2.980 5.500 1.042 4.166 2.640 9.000 2.028 6.219 3.150 29.760 6.582
SO 2 9.434 4.370 21.900 3.972 7.986 2.890 21.250 4.383 6.138 3.360 9.760 1.930 7.567 4.050 14.340 2.711 6.646 2.440 28.480 6.439
CO 0.861 0.390 1.170 0.157 0.826 0.670 1.020 0.088 0.782 0.690 0.870 0.067 0.880 0.540 1.290 0.249 1.251 0.750 5.380 1.252
OZONE 50.023 24.530 68.360 11.155 37.945 27.080 51.960 6.544 29.428 14.270 39.050 8.082 27.741 16.970 44.140 8.762 36.327 21.160 46.690 7.189
VAPI 2019
PM 2.5 72.230 42.780 132.080 26.584 61.099 33.020 108.700 19.346 39.774 34.370 45.260 3.308 35.334 21.940 54.810 9.504 23.391 18.120 27.700 2.975
PM 10 139.818 84.190 238.000 53.067 131.908 82.210 204.250 36.470 86.347 68.580 111.150 13.842 79.172 48.040 113.300 18.160 51.563 41.650 59.060 5.076
NO 23.396 13.730 32.330 6.203 31.212 15.780 54.420 9.916 25.991 12.640 39.550 6.787 23.904 17.190 32.440 5.066 29.682 17.260 44.210 7.869
SO 2 19.142 12.890 25.580 4.045 32.505 19.910 76.030 12.663 18.468 11.810 21.470 2.487 21.428 15.480 26.590 2.745 17.591 9.020 26.150 3.876
CO 0.878 0.540 1.240 0.178 0.714 0.420 1.170 0.241 0.813 0.580 1.190 0.169 0.658 0.440 1.020 0.208 0.734 0.430 1.020 0.188
OZONE 6.216 3.130 15.950 3.785 16.535 3.580 30.890 9.011 28.796 12.410 42.300 10.593 26.639 17.400 45.920 9.252 15.531 10.270 21.530 3.146
VAPI 2020
PM 2.5 43.694 28.540 78.540 10.112 32.439 21.610 57.280 7.735 30.107 20.230 47.270 8.919 24.424 16.970 37.110 4.615 25.259 19.140 46.790 9.012
PM 10 91.413 49.380 148.190 24.285 77.031 54.560 113.200 14.617 88.775 50.010 154.230 33.151 68.518 49.130 125.690 18.244 50.338 35.800 86.550 12.659
NO 5.849 3.400 10.410 1.887 4.894 2.540 9.150 1.669 4.066 2.980 5.500 1.042 4.166 2.640 9.000 2.028 6.219 3.150 29.760 6.582
SO 2 9.434 4.370 21.900 3.972 7.986 2.890 21.250 4.383 6.138 3.360 9.760 1.930 7.567 4.050 14.340 2.711 6.646 2.440 28.480 6.439
CO 0.861 0.390 1.170 0.157 0.826 0.670 1.020 0.088 0.782 0.690 0.870 0.067 0.880 0.540 1.290 0.249 1.251 0.750 5.380 1.252
OZONE 50.023 24.530 68.360 11.155 37.945 27.080 51.960 6.544 29.428 14.270 39.050 8.082 27.741 16.970 44.140 8.762 36.327 21.160 46.690 7.189
Table 3. Variation air pollutant concentrations for pre-COVID19 (2019) and COVID19 (2020) years. All
pollutants are in units of μg/m3 and CO is expressed in units of mg/m3. Min minimum, Max maximum, SD
standard deviation.
in Vapi. PM2.5 ranged between − 36 and − 5% during phase-2 and phase-5, respectively in Ankleshwar. While in
Vapi it ranged between − 48 and − 19% in phase-4 and phase-3, respectively. P M10 also showed a similar trend
but it did not decline below 29% and 52% during phase-2 in Ankleshwar and Vapi, respectively. CO continued to
increase in Ankleshwar from 30% in phase-1 to 150% in phase-5 (unlock 1.0), while in Vapi it had varied from
132% in phase-1 to − 38% in phase-3.
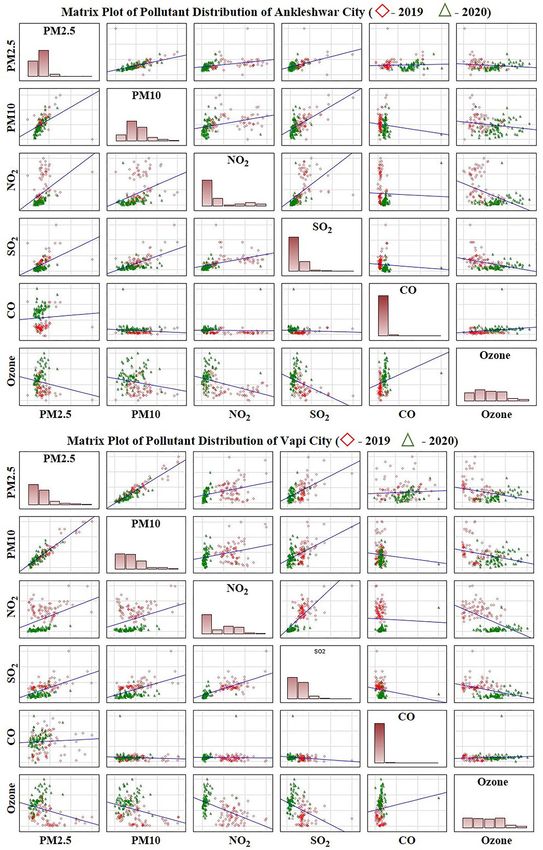
The linear correlations of metadata of each pollutant and linear regression between pollutant concentrations
and lockdown days are shown in the matrix plot (Fig. 4) and regression plot (Fig. 5) respectively. A declining
trend is observed in particulate matter ( PM2.5 and P M10), SO2, and N O2 levels during the COVID-19 lockdown
period, as compared to the pre-COVID-19 year (Table 1). The O 3 concentration increased during the lockdown
period compared to the pre-lockdown due to a decrease in N O2 content. The distribution of CO shows a vari-
able trend. A scatter plot matrix (Fig. 4), a grid (or matrix) of scatter plots, a graphical equivalent of the cor-
relation matrix, is used to assess air pollutant variable data and to visualize the bivariate relationships between
combinations of variables of pre-COVID19 (2019) to COVID19 (2020) in both cities. Each scatter plot in the
matrix visualizes the relationship between a pair of variables, allowing many relationships between several pairs
of all air pollutant variables to be explored at once. The Matrix of scatter plot (Fig. 4) clearly shows the variable
distribution of the pollutant variables from pre-COVID19 (2019) and COVID19 lockdown period (2020) in
all combination of scatter plots. It is also clearly observable from Matrix plot, a positive correlation between
particulate matter (PM2.5 and PM10) with NO2, SO2, and CO. O3 shows a negative correlation with particulate
matter (PM2.5 and PM10), SO2 and NO2.
Further, we also note that the linear regression analysis exhibited a negative correlation between the daily
AQI and the growing number of lockdown days (Fig. 5). The main reason behind the negative correlation could
be the meteorological conditions prevailing in the region. In South Gujarat region during 2020 and 2019 a
southerly gentle breeze with a speed of 2–4 m s‒1 prevailed23 combined with the closure of transport and indus-
tries for a longer continuous period in comparison to the similar pre-COVID-19 p eriod41. We believe that the
prevalence of consistent wind speed and direction in the South Gujarat region during the 2020 lockdown and
similar period of 2019 (along with different restrictions imposed during the lockdown in 2020) has helped in
reducing pollutant levels.
The results of the present study corroborates with other recent similar studies conducted in various cities
across the globe (USA3; China12,13,15; Brazil16; Italy42 India23).
Scientific Reports | (2021) 11:4285 | https://doi.org/10.1038/s41598-021-83393-9 6
Vol:.(1234567890)www.nature.com/scientificreports/
Figure 4. Correlation matrix scatter plot of the air pollutants (The Diagonal Bar Diagrams are the density plots
fo various pollutant variables showing the distribution of data).
Scientific Reports | (2021) 11:4285 | https://doi.org/10.1038/s41598-021-83393-9 7
Vol.:(0123456789)www.nature.com/scientificreports/
Figure 5. Linear regression of AQI for Vapi and Ankleshwar for 2019 and 2020.
Discussion
Environmental degradation due to anthropogenic pollution has become a chronic problem the world over.
In India, haphazard development has led to various problems such as land degradation and air–water quality
degradation, mainly in urban areas. Air pollution has become a severe problem in various metropolitan cities
and industrialized centers across the country. Incomplete combustion of fossil fuels by vehicles and industrial
operations42, and improper disposal of anthropogenic waste are the root causes of the rapid increases in air pol-
lution. In March 2020, the COVID-19 pandemic led to a nationwide lockdown to control the spread of infection.
The total stretch of various phases of lockdown was 68 days, in which the restrictions were eased subsequently.
Although temporarily, the long stretch of restrictions on economic activities provided an opportunity for the
environment to heal itself from the continuous exploitation by human a ctivities8.
It is evident from the recent studies that reductions in most of the pollutants was observed all over India dur-
ing the lockdown period. In a study across 12 cities, located in different spatial segments Indo-Gangetic Plain
(IGP), showed a substantial decrease (35%) of PM2.5 concentrations across the cities located in IGP after imple-
mentation of lockdown43. In Saurashtra and South Gujarat regions in Gujarat state, reductions up to 30–84% in
NO2 concentration was observed, while O3 increased by 16–48% due to reduction in NO2. The average decrease
in AQI values of 58% was mainly observed in industrial cities such as Ahmedabad, Gandhinagar, Jamnagar,
and Rajkot32. The atmospheric pollution level (NO2, PM2.5, and PM10) in Ahmedabad city also showed a sig-
nificant improvement during the study period, implying a positive response of COVID-19 imposed lockdown
on the environmental f ront44. In Delhi, the pollutant level came down to its 5-year low during the first week of
lockdown phase-1, where P M2.5 concentration dropped to 42 μg/m3 (similar to the values observed in March
45
2016) . AQI reduction in Delhi was 49% compared to the previous year, thus improvement of about 60% was
mainly observed in the industrial and transport h ub33. During the lockdown period, reduction in P M2.5 among
all the pollutants was maximum in Gaya, Kanpur, Nagpur, and K olkata23. The results of the study46 of variation
in ambient air quality during COVID-19 lockdown in Chandigarh showed significant reductions in all air pol-
lutants during the first and second phases of the Lockdown. The concentration of PM10, PM2.5, NO2 and SO2
reduced by 55%, 49%, 60% and 19%, and 44%, 37%, 78% and 39% for Delhi and Mumbai, respectively, during
post-lockdown phase leading to a significant improvement in air quality47. The reduction in mean concentration
from the pre-lockdown phase to during lockdown of the main air pollutants is observed in Kolkatta C ity48. In
49
a similar study , on 16 cities designated as Hotspot region covering almost two thirds of India, also reported a
significant reduction in the observed (mean) levels of PM10, PM2.5 and NO2 concentration during the lockdown
period from March 25 to April 25.
The present study to assess the effect of COVID-19 lockdown in reducing air pollution in the two industrial
cities viz., Ankleshwar and Vapi, Gujarat, India substantiate earlier studies. In comparison to a similar period in
2019, Ankleshwar observed a reduction in P M10 (primarily emitted by vehicles) and P M2.5 (caused by dust, ash,
etc.)39 concentrations during phase-1, while in Vapi the concentrations were reduced to almost half of those in
Scientific Reports | (2021) 11:4285 | https://doi.org/10.1038/s41598-021-83393-9 8
Vol:.(1234567890)www.nature.com/scientificreports/
Figure 6. Mean Air Quality Index for Ankleshwar and Vapi for 2019 and 2020 during different lockdown
phases.
the previous year (Fig. 3). The most plausible reason being the total restrictions on vehicular movements and
industrial activities during the lockdown period. Similar drastically decreasing trends were observed for S O2 in
Ankleshwar (highest reduction among all phases) produced by transportation and oil r efineries50,51. Vapi also
recorded a one-third reduction in its mean S O2 values.
Reduction in N O2, (which is emitted by heavy v ehicles52 during all the phases consequently spiked the ozone
concentration in both the cities (reduction in N Ox can increase ozone due to nonlinear relationships just above
the ground level53). CO, which is commonly produced by incomplete combustion of carbon-containing fuels54,
showed rising trends in Ankleshwar during all the phases but dropped in Vapi.
Although rainfall, a significant determinant which helps to lower the pollutant levels occurred negligibly dur-
ing the study period in both the cities, which implies that, in the absence of good amount of rainfall, which is a
vital factor of pollution reduction, the difference in the trends is a result of continuous operation of the majority
of pharmaceutical industries establishments in Ankleshwar during the lockdown. At the same time, Vapi showed
a reduction in CO (except in phase-4 and phase-5) due to the non-operation of the majority of industries during
the lockdown phase. Phase-2 lockdown continued for 14 days during which the PM2.5 along with PM10, SO2,
and NO2 showed decreasing trends, whereas S O2 significantly dropped in all phases in both the cities (Table 2).
During phase-3, with restrictions eased, economic activities were restarted in a gradual manner, which led to
the increasing trend in the pollutants. In Ankleshwar, during phase-4 (lockdown) and phase-5 (unlock-1), PM2.5
and PM10 mean concentrations exhibited an increasing trend due to increased vehicular movement and industrial
operations, but Vapi still showed significant decreasing trends compared to 2019. The continuous operations of
pharmaceutical industries during the lockdown phases, primarily the large-scale production ‘Hydroxychloro-
quine’ which is considered effective in COVID-19 treatment at Zydus Cadila, Vital Pharma and Mangalam Drugs
and Organics located in Ankleshwar and Vapi, and its transportation to the seaports, is probably one of the main
reasons for increases in vehicle-related pollutants (NOx, S O2, CO) since mid-phase-3 due to its global demand.
Which can further be verified from the statement “In Ankleshwar, Vatva and Vapi the major sectors contributing
to air pollution were transport, industries and power plants” given by a senior Gujarat Pollution Control Board
official (John, April 7, 2020). “Construction, road dust re-suspension, and residential activities also contributed
to pollution. In addition landfill fires, operation of DG sets, cooking at restaurants also added to pollution”55.
Concurrently, it is evident from the negative correlation between air quality index values of Ankleshwar and
Vapi and COVID-19 lockdown days (Fig. 5) that the majority of air pollutants decreased since March 25, 2020
as the lockdown period got extended in a phased manner. The most obvious reason was the shutting down of
the industrial and transport sector since the lockdown phase-1 started and as the days progressed, pollutants
were subsequently flushed o ut40.
However, different trends of some pollutants (minimal increment during later phases) are probably due to two
primary causes. First, the diversity in the industrial setup and decline in the number of the on-road v ehicle3,56.
Ankleshwar hosts the majority of pharmaceutical manufacturing plants, while Vapi houses more heterogene-
ous industries, such as pharmaceutical, petrochemical, etc. This difference indirectly influences the emission
of different pollutants (as per the raw material used for the processing) and the transportation of the finished
products to the market.
Secondly, and more importantly, the proximity of Vapi to the Arabian coast (8 km) is significantly lesser than
Ankleshwar (38 km), which also plays a vital role in mixing up and higher fluctuation of pollutant range (due to
sea-land breeze) in comparison to Ankleshwar. These causes suggest the differences in the rate of reduction and
increment of the concentration of pollutants in the two cities. Figure 6 presents a summary of highlights and the
variation in the Air Quality Index (AQI) corresponding to different lockdown phases.
Scientific Reports | (2021) 11:4285 | https://doi.org/10.1038/s41598-021-83393-9 9
Vol.:(0123456789)www.nature.com/scientificreports/
Conclusion
It is undoubtedly evidenced from this study and the others in several cities57, that the lockdown measures
imposed to contain the spread of COVID-19 infection was found to be very effective resulting in a positive
impact during the Pandemic as a blessing in disguise. It not only restricted the spread of infection rate, but also
has given a scope to realize the restoration ability of environment and health with reduced ambient air pollutants
levels leading to improved air quality.
The bold decision to impose strict lockdown measures by the Government of India despite economic losses,
on the positive front, these measures brought significant improvement in air quality. The present study takes into
consideration of the air pollutant observation of all the 5 phases of lockdown period, in contrast to the earlier
studies from different parts of the country, that are restricted to only the earlier phases of lockdown period,
supports the improved air quality due to lockdown measures. This study highlights the air quality index data
of two industrialized cities Ankleshwar and Vapi to determine the trends of different pollutants during all the
lockdown phases of COVID-19 in India. Both cities have been classified as critically polluted in Gujarat during
the last decade58. However, the present study showed a drastic overall reduction of pollutants in both the cities.
The results revealed different patterns of gradual to a rapid reduction in most of the pollutant concentrations
additionally an increment in O3 concentration due to drastic reduction in NO2 by as much as 80.18%. Increases
in other pollutants were also observed as the restrictions were eased during phase-4 and unlock 1.
The different lockdown phases were differentiated based on subsequent relaxation in the norms to restart
economic activities. The world’s largest lockdown event has provided an actual example instead of modeled
scenarios to determine how the pollutants can fluctuate due to different economic restrictions. Due to fear of
infection, individuals embraced the restrictions imposed by the lockdown. Thus, it allowed us to show the levels
of reduction possible to curb pollution levels.
Although the meteorological conditions (specifically rainfall) could also play a role in bringing down the
levels of air pollutions, however, the impact of rainfall is in very minimal in the present study area as no rainfall
is reported during the studied duration. The impact of the meteorological conditions cannot be ignored and
should be considered in the future for understanding the long term trends.
It is obvious that there is clear reduction in the pollutants levels due to COVID-19 related lockdown improv-
ing the air quality in most of parts of the earth as observed from the earlier studies and from the present study.
The system imposed was certainly harsh for the economy. However, a modified mode of various reservations for
the economy could be used to manage pollution levels on a case-to-case basis. The findings of the present study
certainly offers potential scope to plan air pollution reduction strategies. For policymakers, the need for the hour
is to acknowledge the role of lockdown in curbing air pollution and not to lose the lead unintentionally achieved
during this period against rising air pollution to critical levels. It is hoped that the present situation will open the
perspective of humans in understanding deleterious effects of anthropogenic activities.
Data availability
The Daily CPCB AQI data for more than 200 Indian stations as available open-source at https: //app.cpcbcc r.com/
ccr/#/caaqm-dashboard-all/caaqm-landing.
Received: 20 October 2020; Accepted: 29 January 2021
References
1. WHO (World Health Organization). World Health Organization Emergency Dashboard. https://covid19.who.int/region/searo/
countr y/in. Accessed 8 July 2020 (2020)
2. Hu, B., Guo, H., Zhou, P. & Zheng, L. S. Characteristics of SARS-CoV-2 and COVID-19. Nat. Rev. Microbiol. https://doi.
org/10.1038/s41579-020-00459-7 (2020).
3. Chen, L. W. A., Chien, L. C., Li, Y. & Lin, G. Nonuniform impacts of COVID-19 lockdown on air quality over the United States.
Sci. Total Environ. https://doi.org/10.1016/j.scitotenv.2020.141105 (2020).
4. Berman, J. D. & Ebisu, K. Changes in US air pollution during the COVID-19 pandemic. Sci. Total Environ. 739, 139864. https://
doi.org/10.1016/j.scitotenv.2020.139864 (2020) (ISSN 0048–9697).
5. Unnithan, P. S. G. Kerala reports first Coronavirus case in India. India Today News (Jan 30, 2020), India. https://www.indiatoday
.in/india/story/kerala-reports-first-confirmed-novel-coronavirus-case-in-india-1641593-2020-01-30 (2020).
6. MHA (Ministry of Home Affairs), Govt. of India. Circulars For Covid-19. https://www.mha.gov.in/notifi cations/circulars-covid
-19 (2020).
7. UNDP (United Nations Development Programme). Socio-Economic impact of COVID-19. https://www.undp.org/conten t/undp/
en/home/coronavirus/socio-economic-impact-of-covid-19.html. Accessed 8 July 2020 (2020).
8. Ndegwa, S. An environmental silver lining amid COVID-19 cloud. China Global Television Network, Opinion. Retrieved
from https://news.cgtn.com/news/2020-06-06/An-environmental-silver-lining-amid-COVID-19-cloud-R4TpEvr0ty/index.html
(2020).
9. He, G., Pan, Y. & Tanaka, T. The short-term impacts of COVID-19 lockdown on urban air pollution in China. Nat. Sustain. https
://doi.org/10.1038/s41893-020-0581-y (2020).
10. Monserrate, M. A., Ruano, M. A. & Alcalde, L. S. Indirect effects of COVID-19 on the environment. Sci. Total Environ. 728(2020),
138813. https://doi.org/10.1016/j.scitotenv.2020.138813 (2020).
11. European Environmental Agency. Air pollution goes down as Europe takes hard measures to combat. https://www.eea.europa.eu/
highlights/air-pollution-goes-down-as. Accessed 4 October 2020 (2020).
12. Nie, D. et al. Changes of air quality and its associated health and economic burden in 31 provincial capital cities in China during
COVID-19 pandemic. Atmos. Res. https://doi.org/10.1016/j.atmosres.2020.105328 (2020).
13. Shi, X., & Brasseur, G. P. The response in air quality to the reduction of Chinese economic activities during the COVID‐19 outbreak.
Geophysical Research Letters, 47, e2020GL088070. https://doi.org/https://doi.org/10.1029/2020GL088070 (2020).
14. Li, L. et al. Air quality changes during the COVID-19 lockdown over the Yangtze River Delta Region: An insight into the impact
of human activity pattern changes on air pollution variation. Sci. Total Environ. https://doi.org/10.1016/j.scitotenv.2020.139282
(2020).
Scientific Reports | (2021) 11:4285 | https://doi.org/10.1038/s41598-021-83393-9 10
Vol:.(1234567890)www.nature.com/scientificreports/
15. Yuan, Q. et al. Spatiotemporal variations and reduction of air pollutants during the COVID-19 pandemic in a megacity of Yangtze
River Delta in China. Sci. Total Environ. https://doi.org/10.1016/j.scitotenv.2020.141820 (2020).
16. Dantas, G., Siciliano, B., França, B., da Silva, C. M. & Arbilla, G. The impact of COVID-19 partial lockdown on the air quality of
the city of Rio de Janeiro. Brazil Sci. Total Environ. 729, 139085. https://doi.org/10.1016/j.scitotenv.2020.139085 (2020).
17. Siciliano, B. et al. The impact of COVID-19 partial lockdown on primary pollutant concentrations in the atmosphere of Rio de
Janeiro and São Paulo Megacities (Brazil). Bull. Environ. Contam. Toxicol. 105, 2–8. https://doi.org/10.1007/s00128-020-02907-9
(2020).
18. Otmani, A. et al. Impact of COVID-19 lockdown on PM10, S O2 and NO2 concentrations in Salé City (Morocco). Sci. Total Environ.
735, 139541. https://doi.org/10.1016/j.scitotenv.2020.139541 (2020).
19. Tobías, C. et al. Changes in air quality during the lockdown in Barcelona (Spain) one month into the SARS-CoV-2 epidemic. Sci.
Total Environ. 726(1–4), 2020. https://doi.org/10.1016/j.scitotenv.2020.138540 (2020).
20. Patel, K. Airborne nitrogen dioxide plummets over China. https://www.earthobservatory.nasa.gov/images/146362/airborne-nitro
gen-dioxide-plummets-over-china. Accessed 4 October 2020 (2020).
21. Parker, H. A., Hasheminassab, S., Crounse, J. D., Roehl, C. M. & Wennberg, P. O. Impacts of traffic reductions associated with
COVID-19 on Southern California air quality. Geophys. Res. Lett. 47, e2020GL090164. https://doi.org/10.1029/2020GL090164
(2020).
22. Xu, L. et al. Variation in concentration and sources of black carbon in a megacity of China during the COVID-19 pandemic. Am.
Geophys. Union. https://doi.org/10.1029/2020GL090444 (2020).
23. Sharma, S., Zhang, M., Gao, A., Zhang, H. & Kota, S. H. Effect of restricted emissions during COVID-19 on air quality in India.
Sci. Total Environ. 728, 138878. https://doi.org/10.1016/j.scitotenv.2020.138878 (2020).
24. Koken, P. J. et al. Temperature, air pollution and hospitalization for cardiovascular diseases among elderly people in Denver.
Environ. Health Perspect. 111(10), 1312–1317 (2003).
25. LeTertre, A. et al. Short-term effects of particulate air pollution on cardiovascular diseases in eight European cities. J. Epidemiol.
Community Health 56, 773–779 (2002).
26. Thorpe, A. J. & Harrison, R. M. Sources and properties of non-exhaust particulate matter from road traffic: A review. Sci. Total
Environ. 400, 270–282 (2020).
27. He, L. et al. On-road emission measurements of reactive nitrogen compounds from heavy duty diesel trucks in China. Environ.
Pollut. 262, 114280 (2020).
28. Garaga, R., Sahu, S. K. & Kota, S. H. A review of air quality modeling studies in India: local and regional scale. Curr. Pollut. Rep.
4(2018), 59–73 (2018).
29. Kota, S. H. et al. Year-long simulation of gaseous and particulate air pollutants in India. Atmos. Environ. 180, 244–255 (2018).
30. Mukherjee, M. & Agrawal, A. Air pollutant levels are 12 times higher than guidelines in Varanasi, India. Sources Transf. Environ.
Chem. Lett. 16(2018), 1009–1016 (2018).
31. MoEFC. Ministry of Environment, Forest and Climate change, Sundaray, S.N.K. & Bharadwaj DSR (Eds.). National Clean Air
Programme, New Delhi (2019).
32. Selvam, S. et al. SARS-CoV-2 pandemic lockdown: Effects on air quality in the industrialized Gujarat state of India. Sci. Total
Environ. 737, 140391 (2020).
33. Mahato, S., Pal, S. & Ghosh, K. G. Effect of lockdown amid COVID-19 pandemic on air quality of the megacity Delhi, India. Sci.
Total Environ. https://doi.org/10.1016/j.scitotenv.2020.139086 (2020).
34. Sarella, G. & Khambete, A. K. Ambient air quality analysis using air quality index—A case study of Vapi. Int. J. Innov. Res. Sci.
Technol. 1(10), 2349–6010 (2015).
35. IMD (India Meteorological Department). Ministry of Earth Sciences, Government of India. Cumulative rainfall activity. https://
mausam.imd.gov.in/imd_latest/contents/cumulative_rainfall_activity.php (2020).
36. Vapi Green Enviro Limited. CETP Process Flow. http://www.vgelvapi.com/cetp-process-flow.html (2020).
37. Paliwal, A. Vapi tops list of critically polluted city. Down to Earth, News (May 21, 2012). https://www.downtoearth.org.in/news/
vapi-tops-list-of-critically-polluted-areas--38260 (2012).
38. Kambalagere, Y. A Study on Air Quality Index (AQI) of Bengaluru, Karnataka during Lockdown Period to Combat Coronavirus
Disease (Covid-19): Air quality turns ‘better’ from ‘hazardous’. Stud. Indian Place Names 40(69), 2394–3114 (2020).
39. National Air Quality Index - Report of the Expert Committee. Control of Urban Pollution Series (CUPS/82 /2014-15) - Central
Pollution Control Board, Ministry of Environment, Forest and Climate Change, Government of India. https://app.cpcbccr.com/
ccr_docs/FINAL-REPORT_AQI_.pdf (2014).
40. Central Control Room for Air Quality Management- All India. Continuous Stations Status, National Air Quality Index. Central
Pollution Control Board, Ministry of Environment, Forest and Climate Change, Government of India. https://app.cpcbccr.com/
ccr/#/caaqm-dashboard-all/caaqm-landing (2020).
41. The Hindu. Coronavirus lockdown lifts Delhi’s March air quality to 5-year high. https://www.thehindu.com/news/cities/Delhi/
coronavirus-lockdown-lifts-delhis-march-air-quality-to-5-year-high/article31252221.ece. Accessed 24 December 2020. (2020)
42. Popescu, F. & Lonel, I. Anthropogenic air pollution sources. Anthropogen. Air Pollut. Sources Air Qual. Ashok Kumar IntechOpen
https://doi.org/10.5772/9751 (2010).
43. Das, M., Das, A. & Mandal, A. Examining the impact of lockdown (due to COVID-19) on Domestic Violence (DV): An evidences
from India. Asian J. Psychiatry https://doi.org/10.1016/j.ajp.2020.102335 (2020).
44. Aman, M. A., Salman, M. S. & Ali, P. Y. COVID-19 and its impact on environment: Improved pollution levels during the lockdown
period—A case from Ahmedabad. India. Remote Sens. Appl. Soc. Environ. https://doi.org/10.1016/j.rsase.2020.100382 (2020).
45. Jacob, K. Coronavirus lockdown lifts Delhi’s air quality to 5-year high. The Hindu, News, Cities, Delhi (April 3, 2020). https://
www.thehindu.com/news/cities/Delhi/coronavirus-lockdown-lifts-delhis-march-air-quality-to-5-year-high/article31252221.ece
(2020).
46. Mor, S. et al. Impact of COVID-19 lockdown on air quality in Chandigarh, India: understanding the emission sources during
controlled anthropogenic activities. Chemosphere 263, 127978. https://doi.org/10.1016/j.chemosphere.2020.127978 (2020).
47. Kumari, P. & Toshniwal, D. Impact of lockdown measures during COVID-19 on air quality—A case study of India. Int. J. Environ.
Health Res. https://doi.org/10.1080/09603123.2020.1778646 (2020).
48. Sarkar, M., Das, A. & Mukhopadhyay, S. Assessing the immediate impact of COVID-19 lockdown on the air quality of Kolkata
and Howrah, West Bengal, India. Environ. Dev. Sustain. https://doi.org/10.1007/s10668-020-00985-7 (2020).
49. Garg, A., Kumar, A. & Gupta, N. C. Impact of lockdown on ambient air quality in COVID-19 affected hotspot cities of India: Need
to readdress air pollution mitigation policies. Environ. Claims J. 1, 65–76. https://doi.org/10.1080/10406026.2020.1822615 (2021).
50. Tripathi, A. K. & Gautam, M. Biochemical parameters of plants as indicators of air pollution. J. Environ. Biol. 28, 127–132 (2007).
51. Chaudhary, A., Chaudhary, S. & Sharma, Y. K. Study of plants in relation to ambient air quality in Lucknow city, Uttar Pradesh.
Res. Environ. Life Sci. 1, 17–20 (2008).
52. USEPA (United Nations Development Programme). Socio-Economic impact of COVID-19. https: //www.undp.org/conten t/undp/
en/home/coronavirus/socio-economic-impact-of-covid-19.html. Accessed 8 July 2020 (2020).
53. Sillman, S. The relation between ozone, NOx and hydrocarbons in urban and polluted rural environments. Atmos. Environ. 33(12),
1821–1845. https://doi.org/10.1016/S1352-2310(98)00345-8 (1999).
Scientific Reports | (2021) 11:4285 | https://doi.org/10.1038/s41598-021-83393-9 11
Vol.:(0123456789)www.nature.com/scientificreports/
54. Transportation Research Board and National Research Council. The Ongoing Challenge of Managing Carbon Monoxide Pollution
in Fairbanks, Alaska: Interim Report. https://doi.org/10.17226/10378 (The National Academies Press, Washington, DC, 2002).
55. John, P. Lockdown: Off Ventilator, Gujarat’s Industrial Zones Beat Gandhinagar AQI. Times of India, News, City news, Ahmedabad
news. Retrieved from https: //timeso
findi a.indiat imes. com/city/ahmeda bad/lockdo
wn-off-ventil ator- gujara t-indust rial- zones- beat-
gandhinagar-aqi/articleshow/75019420.cms (2020).
56. Giovanni, G. L., Carotenuto, F., Vagnoli, C., Zaldei, A. & Gioli, B. Quantifying road traffic impact on air quality in urban areas: A
Covid19-induced lockdown analysis in Italy. Environ. Pollut. 267, 115682. https://doi.org/10.1016/j.envpol.2020.115682 (2020).
57. Chen, S., Yang, J., Yang, W., Wang, C. & Barnighausen, T. COVID-19 control in China during mass population movements at New
Year. Lancet https://doi.org/10.1016/S0140-6736(20)30421-9 (2020).
58. TOI (Times of India). ‘Pollution down in Vapi, Vatva and Ankleshwar. ‘Pollution down in Vapi, Vatva and Ankleshwar’. https: //times
ofindia.indiatimes.com/city/ahmedabad/Pollution-down-in-Vapi-Vatva-and-Ankleshwar/articleshow/55643664.cms. Accessed
24 July 2020. (2016).
Acknowledgements
The first author (Mr. Ritwik Nigam) acknowledges the financial support provided by the University Grant Com-
mission (UGC), Govt. of India, New Delhi, to conduct this research. The authors also thank the University
Administration for their support.
Author contributions
R.N.: initial manuscript writing, methodology, formal analysis, writing the original draft. K.P.: visualization,
prepared initial figures. A.J.L.: review and prepared figures. R.S.: review and editing. M.K.: review, editing,
analysis, and interpretation.
Competing interests
The authors declare no competing interests.
Additional information
Correspondence and requests for materials should be addressed to M.K.
Reprints and permissions information is available at www.nature.com/reprints.
Publisher’s note Springer Nature remains neutral with regard to jurisdictional claims in published maps and
institutional affiliations.
Open Access This article is licensed under a Creative Commons Attribution 4.0 International
License, which permits use, sharing, adaptation, distribution and reproduction in any medium or
format, as long as you give appropriate credit to the original author(s) and the source, provide a link to the
Creative Commons licence, and indicate if changes were made. The images or other third party material in this
article are included in the article’s Creative Commons licence, unless indicated otherwise in a credit line to the
material. If material is not included in the article’s Creative Commons licence and your intended use is not
permitted by statutory regulation or exceeds the permitted use, you will need to obtain permission directly from
the copyright holder. To view a copy of this licence, visit http://creativecommons.org/licenses/by/4.0/.
© The Author(s) 2021
Scientific Reports | (2021) 11:4285 | https://doi.org/10.1038/s41598-021-83393-9 12
Vol:.(1234567890)You can also read


