Post-harvest losses in potato value chains in Kenya - Analysis and recommendations for reduction strategies
←
→
Page content transcription
If your browser does not render page correctly, please read the page content below
Post-harvest losses in
potato value chains in Kenya
Analysis and recommendations for reduction strategies

Published by
2 Table of CONTENTS
Table of Contents
ABSTRACT 6
EXECUTIVE SUMMARY 7
1 Introduction 11
1.1 Study objective 11
1.2 Concept of food loss 11
1.2.1 The study approach 11
1.2.2 Definition of loss and critical loss points 12
2 Methodology 14
2.1 Sampling of counties and value chain actors 14
2.2 Measurement 17
2.3 Load tracking 18
3 POTATO VALUE CHAIN IN KENYA – SURVEY RESULTS 19
3.1 Background 19
3.2 Potato production 21
3.2.1 Ware potato growers 21
3.2.2 Comparison between contracted and non-contracted farmers 28
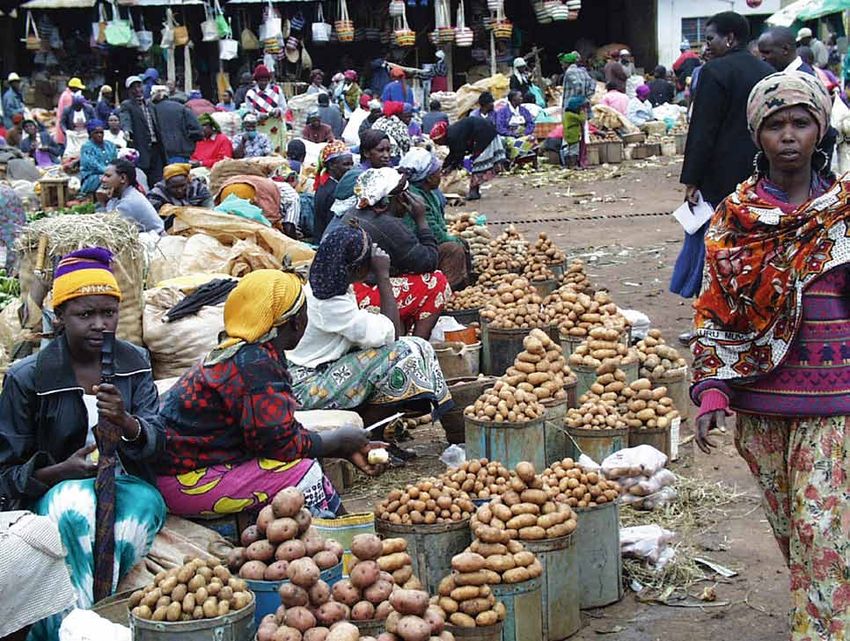
3.3 Potato marketing 30
3.3.1 Brokers at the farm level 30
3.3.2 Wholesale and retail trade 31
3.3.3 Supermarkets 35
3.3.4 Restaurants 35
3.4 Potato processing 36
4 ANALYSIS OF FOOD LOSSES AND OPTIONS FOR FOOD LOSS REDUCTION 38
4.1 Assessment of quantitative and financial losses in the potato value chain 38
4.2 Challenges and options for food loss reduction 43
4.2.1 Seed improvements 43
4.2.2 Improved production and harvesting technologies 44
4.2.3 Improved post-harvest handling 45
4.2.4 Improved conditions for the processing industry 46
4.2.5 Capacity building and agricultural finance 47
4.3 List of important actors in the potato sub-sector 48
ANNEX 51
Annex 1: Surveys details and methodology 51
Annex 2: Further survey data 54
QUESTIONNAIRES 67
REFERENCES 78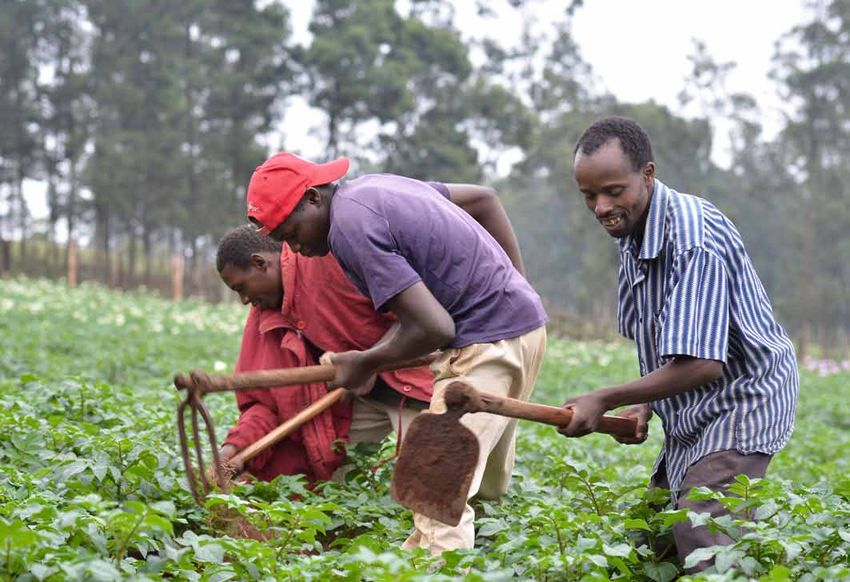
Table of CONTENTS                                                                                       3

List of tables
Table 1:    Critical loss points along the potato value chain                                      13
Table 2:    Breakdown of farmer samples                                                            16
Table 3:    Breakdown of samples of other value chain actors                                       16
Table 4:    Traditional potato measures                                                            18
Table 5:    Traditional measures and their metric conversions                                      18
Table 6:    Main potato producing counties and the total area under potato production in Kenya     19
Table 7:    Land holdings and farming practices                                                    22
Table 8:    Potato varieties grown                                                                 23
Table 9:    Farmers who experience losses during production and harvest                            25
Table 10:   Sorting and grading practices                                                          26
Table 11:   Potato storage practices                                                               26
Table 12:   Losses in storage                                                                      27
Table 13:   Farmers’ transport and marketing practices                                             28
Table 14:   Contracted and non-contracted farmers in Bomet and Nyandarua Counties                  29
Table 15:   Potato traders repacking bags                                                          32
Table 16:   Results of bag tracking in kg                                                          34
Table 17:   Results of opening bags at different markets                                           34
Table 18:   Characteristics of restaurants (multiple choice)                                       36
Table 19:   Market shares of different market channels in the potato value chain                   36
Table 20:   Synopsis of reported damage/loss along the value chain                                 38
Table 21:   Production and loss/damage at the farm level                                           39
Table 22:   Weight and losses at the trader level in kg and % per bag                              40
Table 23:   Average potato purchase prices in October/November 2013                                41
Table 24:   Financial calculation of damage and loss occurring along the ware potato value chain   42
Table 25:   Relevant institutions and actors along the potato value chain                          48
Table 26:   Surveys by county                                                                      51
Table 27:   Study methodology following the FAO’s five-stage approach                              53
Table 28:   Characteristics of potato farmers                                                      54
Table 29:   Farmers’ education levels by gender (%)                                                54
Table 30:   Characteristics of potato traders                                                      54
Table 31:   Traders’ educational levels by gender (%)                                              55
Table 32:   Main challenges farmers face in potato production as a % (multiple choice)             55
Table 33:   Potato seed used by farmers                                                            55
Table 34:   Seasons for potato planting and harvesting expressed – relevance as a %                57
Table 35:   Potato pre-harvesting practices                                                        57
Table 36:   Potato harvesting practices - time and protection from sunlight                        58
Table 37:   Potato harvesting practices - second gathering and handling of leftovers               58
Table 38:   Potato harvesting practices - tools and labour                                         59
Table 39:   Losses experienced on farms                                                            60
Table 40:   Potato marketing practices                                                             61

4                                                                                             Table of CONTENTS

Table 41:   Farm-gate potato prices                                                                         61
Table 42:   Main sourcing and sales markets of traders                                                      63
Table 43:   Most common bag types bought by traders                                                         63
Table 44:   Trader-perceived advantages and disadvantages of the main packaging materials                   64
Table 45:   Traders’ preferences for potato varieties and reasons for these preferences (ranking)           64
Table 46:   Current lowest and highest purchase price                                                       65
Table 47:   Causes of loss and suggested improvements (multiple choice)                                     65
Table 48:   Restauranteurs’ perceptions of the benefits of different potato varieties as a %                66

List of Figures
Figure 1: Synopsis of reported damage and loss occurring within different market channels
          of the potato value chain                                                                          8
Figure 2: Map showing the four counties surveyed                                                            15
Figure 3: Ware potato value chain                                                                           21

List of Graphs
Graph 1:    Causes of damages at retail level                                                               33
Graph 2:    Use and quality of potatoes                                                                     41
Graph 3:    Types of seed used by farmers, as a %                                                           56
Graph 4:    Number of seasons after which farmers renew seed, as a %                                        56
Graph 5:    Months with highest and lowest farm-gate prices – relevance of month in %                       62

List of Photographs
Photograph 1:     The Shangi potato variety                                                                 23
Photograph 2:     Fork jembe                                                                                25
Photograph 3:     Seed potato storage – diffused light store                                                27
Photograph 4:     Brokers on site filling extended bags                                                     30
Photograph 5:     Loading and handling of extended bags at Nairobi’s Wakulima Market                        30
Photograph 6:     Conditions at Nairobi’s Wakulima wholesale market                                         31
Photograph 7:     Retailer selling out of an opened extended bag                                            32
Photograph 8:     Potato sample from load tracking                                                          34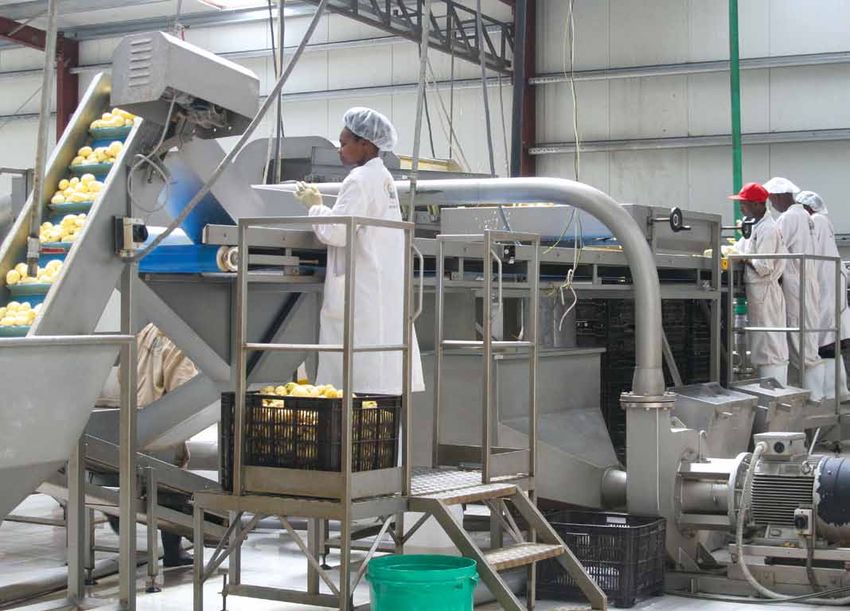
Table of CONTENTS                                                                    5

Abbreviations
BMZ             German Federal Ministry for Economic Cooperation and Development
CIP             International Potato Center
DLS             Diffused light store
EUR             Euro
FAO             Food and Agriculture Organization
FPEAK           Fresh Produce Exporters Association of Kenya
FSP             Food Security Portal
GAP             Good agricultural practices
GFP             German Food Partnership
GIZ             Deutsche Gesellschaft für Internationale Zusammenarbeit (GIZ) GmbH
GIZ PSDA        Private Sector Development in Agriculture Programme
Ha              Hectare
HCDA            Horticultural Crops Development Authority
ILO             International Labour Organization
KARI            Kenyan Agricultural Research Institute
KENFAP          Kenyan National Federation of Agricultural Producers
KENOPOFA        Kenya National Potato Farmers Association
KEPHIS          Kenya Plant Health Inspectorate Service
KES             Kenyan Shilling
KIRDI           Kenya Industrial Research and Development Institute
KFA             Kenya Farmers Association
KfW             KfW Entwicklungsbank
kg              Kilogram
MoALF           Ministry of Agriculture, Livestock and Fisheries
NPCK            National Potato Council of Kenya
PHL             Post-harvest loss
SNRD            Sector Network Rural Development

Currency exchange rate: EUR 1 = KES 118
6 Abstract
Abstract
Potato is the second most important food crop in Kenya trained workforce. With a market share of up to 80 per
after maize and is mostly cultivated by smallholders. cent, the retail level is most affected by this, given that
The Kenyan Government has recognised the critical role any resulting low-quality produce is then supplied to the
potatoes play in alleviating food shortages given that markets. However, the absence of market signals stress-
potato provides higher yields compared to maize and is ing ‘better prices for better quality tubers’ contributes to
less affected by climate change. The issue of food loss is the low performance in potato production.
a highly important factor in securing the stable produc-
tion required to combat hunger and raise incomes. Food The financial assessment of potato damage and loss
security is a priority area of German development policy. along the value chain exposes the economic impact of
Therefore, the German Federal Ministry for Economic this low performance in potato production. Per season,
Cooperation and Development (BMZ) launched the 19 per cent of produce is damaged or lost. Extrapolating
special unit “One World – No Hunger” in order to inten- these losses to the national production level, we can
sify its dedication to alleviate hunger and malnutrition. assume that 815,000 tonnes are damaged or lost each
This study, commissioned by Deutsche Gesellschaft für year, representing a value of around KES 12.9 billion
Internationale Zusammenarbeit (GIZ) on behalf of BMZ, (EUR 109 million).
contributes to these efforts.
This study on post-harvest losses of potato contributes
The survey on food loss in the potato sub-sector was to the efforts of the Kenyan Government and private
completed by 247 potato farmers, more than 70 market- sector to improve the development of the potato value
ers (brokers, traders, retailers and supermarkets), chain. To strengthen market linkages in the potato value
3 processors and 10 restaurants. The farmers interviewed chain, it is necessary to stimulate and enhance coop-
were based in the main production areas and thus were eration and coordination between the different actors.
more commercially oriented, and, although these The introduction of standardised bags along with per-
farmers’ yields come in above average, they are still low weight payment and the expansion of contract farming
in comparison to yields projected by the Kenyan present opportunities to support the market linkage of
Agricultural Research Institute. The survey showed that small-scale farmers. However, an important condition
up to 95 per cent of recorded damage and loss o ccurs at for cooperation is trust between the actors in the value
the production level and is caused in particular by chain.
inappropriate harvesting tools and an insufficiently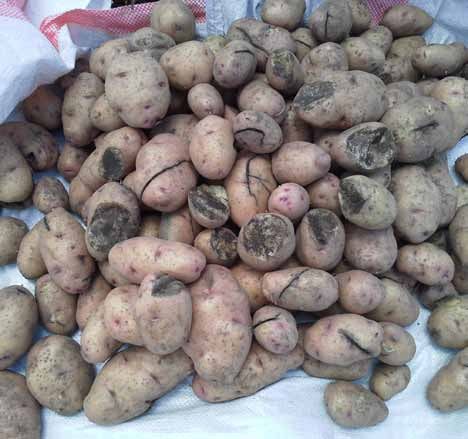
Executive Summary 7
Executive Summary
public and private institutions in Kenya, and also with
Every year, a significant proportion of food produced data from international sources. A verification workshop
for human consumption is lost or wasted. Annual losses representing different actors and institutions in the sub-
have been estimated at about 1.3 billion tonnes by the sector was held to discuss the results and elicit further
UN Food and Agriculture Organization (FAO 2011). In thoughts regarding evaluation and reporting.
light of rising food prices, widespread food insecurity
and growing pressure on natural resources, avoidable Potato is an important food crop in Kenya and is mostly
food loss and waste is not acceptable. The world’s natural cultivated by smallholders. Potatoes are mainly sold on
resources – such as its soil, water, fossil fuels and nutri- the market as fresh produce and are then subsequently
ents – are limited and must be used in a more efficient processed into different foodstuffs at the household or
and responsible manner. industrial level. Many factors contribute to the loss and
damage of produce. At the production level, farmer prac-
The term food wastage, as used by the FAO, encompasses tices engender heavy losses. Land preparation and soil
both food loss and food waste. Wastage occurs along the management are poorly conducted, and pests and dis-
entire food value chain and varies in extent depending eases are ineffectively controlled, leading to low yields.
on the produce and the region. In developing countries, A recent survey showed that bacterial wilt was the most
food loss occurs mostly in the post-harvest stages, during prevalent disease, affecting 77 per cent of potato farmers,
marketing and processing. followed by late blight (67 per cent) and viral diseases
(12 per cent) (Kaguongo et al. 2014).
This study focuses on food loss in the harvesting, pro-
cessing and marketing stages. Its main aim is to improve A shortage of clean seed is also contributing to this loss:
data availability on food loss in an important food value available certified potato seed meets less than 5 per cent
chain in Kenya and to identify options for German of the national demand for seed potato (Gildemacher et
Development Cooperation to engage in food loss reduc- al. 2012). Added to this, there is a shortage of high-yield-
tion programmes.1 ing varieties. The farmers interviewed are based in the
main production areas and are thus more commercially
The scope of the study was to describe a typical value oriented, achieving yields of 13.5 tonnes per hectare per
chain for potatoes (from harvest to retailer), providing season. These yields are above average (7-10 tonnes/ha)
quantitative and qualitative analysis of food loss, detect but are still low when compared to the 25-tonne yields
hot spots for loss, determining the causes of food loss, often realised by professional farmers using certified seed
identifying important actors and partners in the private and sound agricultural practices. However, the absence
and public sectors and the research and donor commu- of market signals stressing ‘better prices for better qual-
nities, and examining the role of these actors in reducing ity tubers’ contributes to the low performance in potato
food loss along value chain. Finally, it aimed to provide production.
recommendations for reducing food loss at the opera-
tional and policy level, and for the future engagement of The survey showed that up to 95 per cent of recorded
the German Federal Ministry for Economic Cooperation damage and loss occurs at the production level and is
and Development (BMZ). caused in particular by inappropriate harvesting tools
and an insufficiently trained workforce. All produce ear-
The survey was completed by 247 potato farmers, more marked for the fresh food market is packed in so-called
than 70 marketers (brokers, traders, retailers and super- extended bags, which farmers and brokers fill with un-
markets), 3 processors and 22 restaurants. Field data have selected harvested potatoes – i.e. they include green, cut,
been supplemented with information available from bruised or rotten produce. Of the potatoes placed on the
market, nearly a quarter are damaged or green. Almost all
of these potatoes are eventually sold, but the quality is-
1 See also the GIZ publication ‘Food Losses in Cassava and
Maize Value Chains in Nigeria. Analysis and Recommenda- sues mean prices must sometimes be lowered.
tions for Reduction Strategies, 2013’.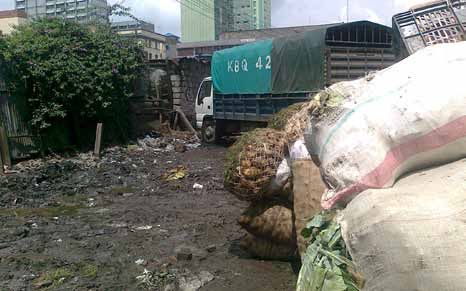
8                                                                                                 Executive Summary

The data on loss in the value chain shown in Figure 1           most affected by the low quality of produce supplied to
below describes the damage and loss reported at each            the markets. Losses reported by the processing industry
stage in the chain (farmers, processors, marketers). The        and supermarkets run from 12 per cent to 25 per cent
percentages are based on different produce quantities           within sector businesses. However, given that their mar-
and are therefore not part of an overall total percentage.      ket share remains small (but growing), this damage and
However, they do expose significant hot spots and chal-         loss only contributes around 5 per cent to the overall
lenges in terms of post-harvest losses. The retail level is     damage and loss occurring along the value chain.

Figure 1: Synopsis of reported damage and loss occurring within different market channels of the potato value chain

                            Reported damage and loss occurring within different market channels

                      Farm level 12.8%                                             Open market 24.4%

           Harvesting                      Storage                Handling/transport                   Sorting
             12.0%                          0.8%                         8.8%                           15.6%

                        Processing 12%                                             Supermarkets 25%

        Varieties/sorting                 Processing                     Quality                      Demand
               10%                           2%                           25%                       not available

The financial assessment of potato damage and loss              maize.2 This being the case, improvements in the potato
along the value chain exposes the economic impact of            sub-sector will also benefit food security in the country.
this low performance in potato production. In each
harvest season, 2,715 kg or 19 per cent of per-hectare          This study on post-harvest losses of potato and its find-
production is damaged or lost, representing a loss of           ings also intend to contribute to the development of the
KES 42,824 (EUR 363) per hectare. Extrapolating these           sub-sector by, in particular, supporting the Kenyan Gov-
per-hectare losses to the national production level,            ernment in its efforts to improve the development of the
we can assume that 815,000 tonnes of produce are                potato value chain. As such, Chapter 3 of this report sets
damaged or lost each year, representing a value of              out the challenges and options for delivering improve-
around KES 12.9 billion (EUR 109 million).                      ments along the ware potato value chain, summarised as
                                                                follows:
The Kenyan Government has recognised potato’s criti-
cal role in alleviating food shortages in the context of
the decreasing production of maize and other staples
(Mwaura 2009). The development of potato production             2	FAO (2009) established the cereal and maize equivalents
                                                                based on the calorie content of selected foods, which
could form part of the solution to overcome such short-
                                                                indicate that five units of potato can replace one unit of
ages given that potatoes have higher yields compared to         maize.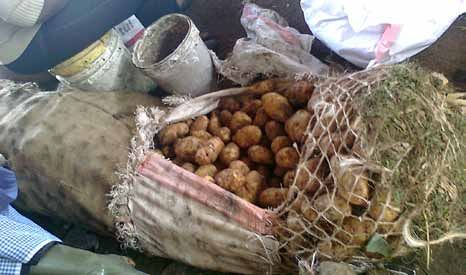
Executive Summary                                                                                                         9

Seed improvements – new varieties and rapid                   holders should also group together to share equipment
multiplication                                                and thereby generate economies of scale.
The limited availability and use of quality seed potato is
a key barrier to increasing productivity in Kenya’s potato    Improved post-harvest handling
sector. To improve certified seed potato supply, research     The currently dominant potato variety is Shangi,3 which
institutes and the private sector have begun introducing      has a short dormancy and begins sprouting after only five
an aeroponics technique in which mini-tubers are grown        to six weeks. As such, it is not suitable for longer-term
from in vitro plants in protected greenhouses. Further-       storage, neither as seed nor as ware potato. Improving
more, after a long period during which Kenya barred           seed and ware potato quality requires new varieties, which,
seed imports, the Kenyan Ministry of Agriculture, Live-       in turn, requires improved on- and off-farm storage and
stock and Fisheries (MoALF) has begun cooperating with        storage technology. Diffused light stores (DLS) and im-
the Dutch Government and private companies on a fast-         proved traditional stores (with charcoal-coated walls) have
track system for rapidly multiplying certified seed.          proved to be useful low-cost storage alternatives, particu-
                                                              larly for storing seed potatoes. However, to date, neither of
A further challenge for seed potato production is the ab-     these storage technologies is widely used in Kenya.
sence of a distribution system for certified seeds. Farm-
ers seeking seed potatoes sometimes must travel more          The Dutch study ‘Value Chain of Seed and Ware Potatoes
than 200 km to reach quality seed providers. Improving        in Kenya’ (Janssens et al. 2013) calculated that modern
the seed potato distribution network is therefore of the      cooled storage facilities should have a minimum capacity
utmost importance for reaching more farmers with cer-         of 100 tonnes to make investment worthwhile. Small-
tified seed.                                                  capacity storage facilities are relatively expensive and
                                                              substantially raise investment and running cost per kg of
Improved production and harvesting technologies               seed potatoes. Consequently, professional modern stor-
Soil fertility is one of the major problems in potato farm-   age is more attractive for the farmers, farmer groups or
ing in Kenya. Fertiliser use in Kenya is low compared to      processors who store big quantities.
the recommended rates of application and this results in
the rapid decline of soil fertility. The biggest complaint    Improved packaging
farmers make is about increasing input costs and this         The Kenyan Government and private sector sought to
factor results in the limited use of agro-inputs. About       improve packaging by means of Legal Notice No 44 of
38 per cent of farmers in Kenya stated that the costs of      2005 and No 113 of 2008, which specify that potato must
fertiliser, fungicide and employee wages have been ris-       be marketed in standard bags of 110 kg. Besides the
ing and that this affects their incomes. Consequently, the    weight, the standard also defined the packaging mate-
lack of funds to buy inputs was reported as an important      rial suitable for potatoes. The implementation of this
problem affecting potato production in Kenya (Kaguongo        law did not result in a real change, as it was not properly
et al. 2008). This being the case, small-scale as well as     enforced. Recently the Government, National Potato
larger-scale farmers should be supported in applying          Council of Kenya (NPCK) and county governments have
good agricultural practices to improve soil fertility, seed   started a new initiative to introduce maximum 50 kg
quality, fertilising and spraying.                            bags in line with the requirements of the International
                                                              Labour Organization (ILO).
On smallholdings, most work is performed manually,
resulting in significant potato damage and loss. As the       As the survey results show, extended bags have severe
survey shows, damage caused by casual labour and har-         impacts on the quality of potatoes marketed. This is
vesting tools represents 7.4 per cent of on-farm losses.      because produce is paid for per bag rather than per kilo-
An ongoing challenge for reducing damage is the presence      gram and bag sizes vary, even within the same categories.
of farms that are too small for mechanisation. As such,
the size of potato production and harvesting machinery        3 Shangi has also been called ‘Zangi’ or ‘Cangi’ in different
in Kenya should be geared towards local needs. Small-         publications.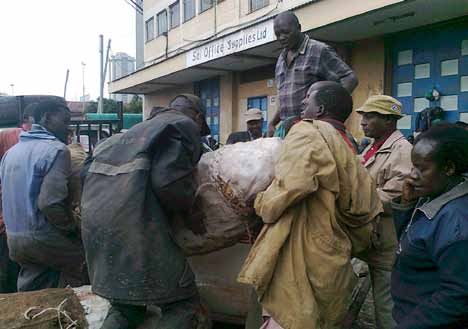
10 Executive Summary
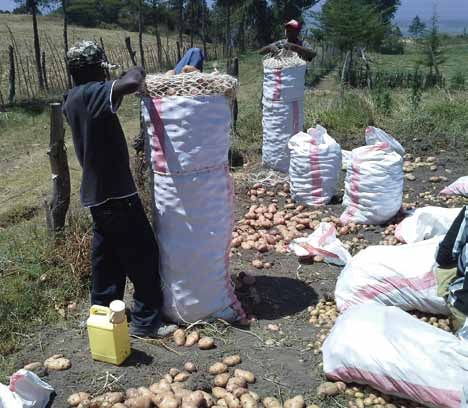
As such, traders prefer to buy extended bags, as they are A further market signal could come from contract farm-
more profitable. This encourages farmers and brokers ing, which helps farmers to exit the vicious circle of
to pack all their potato stock regardless of its quality. In insecure markets and exploitation through extended
addition, the greater difficulty in handling the large bags bags. Contract farming is a well-known arrangement
and the material used to make them cause further for supplying the processing industry, but processors in
damage. Kenya face problems in their cooperations with farmers.
As such, processors and farmers should be supported in
Market signals rewarding quality are required to encour- developing stable business relationships to ensure the
age farmers to deliver better production results. There- provision of suitable varieties, appropriate sorting and
fore, implementing regulations on marketing standards constant supply.
would be a first step towards better quality and the fair
payment of farmers. Firstly, having better bag material Human capacity development
and a lower bag weight decreases spoilage and damage. There is a need to expand farmers’ training on improved
Furthermore, a fixed bag weight would reduce the ex- agronomic and management practices, with the support
ploitation of farmers. Also, the content of a smaller bag of extension services. Priority should be given to inno-
can be better controlled, which helps improve the quality vative approaches that enhance extension and farmer
of produce supplied. To ensure the law is enforced, the training, such as (i) the use of group approaches, (ii) farm-
process to improve packaging should involve brokers, er-led extension that involves, for example, farmer field
local traders, wholesalers, retailers and the county au- schools operating demonstration plots, on-farm trials,
thorities in order to reach an agreement supported by etc., and (iii) the provision of communications technol-
all actors along the value chain. Overall, standards and ogy (ICT) to support agricultural production (Nyagaka et
infrastructure should be established for and awareness al. 2009).
raised about marketing potatoes by weight.
Besides farmers, those involved in trading stock also
Improved conditions for the processing industry need comprehensive training to improve their post-
Kenya has an expanding food processing industry, driven harvest handling, storage, processing and marketing.
by its growing urban population, changing population Relevant training should be provided to operators in the
structure, new eating habits and increasing tourism. The wholesale and retail markets to improve their handling
industry requires potato varieties with better processing and storage of produce with a view to maintaining qual-
qualities to replace the traditional varieties that are ity and reducing physical losses.
assusceptible to bacterial and viral diseases. Processors
are calling for the production of suitable varieties to
meet their needs for better-quality raw material for pro-
cessing.Introduction 11
1 Introduction
1.1 Study objective The study will inform Kenyan partners, GIZ and the
German Food Partnership on how to design appropriate
Potato4 (commonly referred to as Irish potato) is the measures and investments to reduce losses in the potato
second most important food crop in Kenya after maize. value chain and, in general, how to improve efficiency in
Potato production in Kenya is expected to grow and value chains.
could even take the number one spot as food crops like
maize become affected by climate change, e.g. due to
insufficient rainfall. Faced with droughts, farmers are 1.2 Concept of food loss
being encouraged by the government to diversify their
production. The Ministry of Agriculture reported that 1.2.1 The study approach
many farmers are opting to grow potato because it is Although ware potato is the focus of this study on post-
fast-maturing compared to maize and can be used to harvest losses of potato (PHL study), aspects relating to
bridge the gap during shortages of the staple grain. The seed potato use and production at the farm level were
number of farmers abandoning maize is not known but, also taken into consideration.
according to the Ministry, the number of potato farmers
has grown from 500,000 farmers in 2003 to 800,000 in This study looks at losses occurring at the pre-harvest,
2011 ( Thompson Reuters Foundation 2011). harvest, post-harvest and processing stages, as these are
the most relevant in developing countries. Following the
In spite of this popularity, several studies have reported approach taken in the FAO study ‘Global Food Losses and
major constraints in potato production, such as diseases Food Waste (Gustavsson et al. 2011) five system boundaries
and pests mainly spread by diseased seed and the lack of are distinguished in the food supply chains of vegetable
crop rotation. Other problems are the climate (drought, commodities. Food loss/waste should be estimated for
heavy rains), the costs of inputs for smallholders, seed each of these segments in the chains:
quality, soil quality and (post-)harvest losses.
• Pre-harvest: practices affecting the quality of har-
The issue of food loss is a highly important factor in ef- vested potatoes.
forts to combat hunger and raise incomes. However, food
loss also represents wasted production resources such • Harvest: losses due to mechanical damage during
as land, water, energy and inputs. These additional envi- harvesting, as well as crops left in the field due to poor
ronmental impacts of food loss were not included in this harvesting technologies.
study but were evaluated as part of the GIZ study on ‘The
Ecological Footprint of Cassava and Maize Post-Harvest • Post-harvest handling and storage, which includes
Losses in Nigeria’ (2013),5 which showed that food loss losses during post-harvest crop sorting and losses
has a significant impact on the environment. during handling, storage and transportation between
farms and distribution points including losses caused
The aim of this study is to improve the availability of by packaging (extended bags).
data on food loss in the potato value chain in Kenya in
order to identify options for the public and private • Processing, which includes losses due to spillage and
sectors to engage in food loss reduction programmes. degradation during industrial processing, such as:
when crops being sorted are identified as unsuitable
for processing; during washing, peeling, slicing and
4 The relevance of potatoes (Solanum tuberosum) as a
food crop is significant compared to sweet potatoes boiling; during process interruptions; or as a result of
(Ipomoea batatas), which make up only around 20 per cent accidental spillage.
of potato production. In 2011, sweet potato cultivation
occupied 33,000 hectares and provided a yield of 300,267
tonnes, valued at KES 3.6 billion (provisional data, HCDA
2012).
5 See also GIZ 2013b.12 Introduction
• Distribution, which includes losses and waste in the at the end of the food chain (retail and final consump-
marketing system – for example, at wholesale markets, tion) is called ‘food waste’ and is the result of retailer and
supermarkets, retailers and local markets. consumer behaviour.
• Unlike the FAO study, waste occurring during the final Losses include:
consumption stage was not factored into this GIZ PHL
study. • physical losses – products that are not marketable/
consumable, e.g. spoiled, rotten, damaged, green
1.2.2 Definition of loss and critical loss points potatoes
According to FAO, food loss refers to a decrease in edible
food mass throughout the part of the supply chain that • financial losses – lower prices paid due to insufficient
specifically provides edible food for human consump- quality or loss of value due to bad storage facilities
tion. Therefore, food destined for human consumption
that falls out of the human food chain is considered as Critical loss points can occur all along the value chain
food loss or waste. This approach distinguishes between (Table 1). Given that at certain points not all damaged
‘planned’ non-food uses and ‘unplanned’ non-food uses, produce is lost, specifications have been drawn up to
with the latter being counted as loss. Food loss occurring distinguish between losses and other uses.
Financial losses due to low quality of potatoes is a
challenge to retailersIntroduction 13
Table 1: Critical loss points along the potato value chain
Stages Critical loss points Specifications of loss according to the PHL study
Production Energy Audit Subsidy Small potatoes are losses if they are not for used for home
consumption or for seed.
Capital Cost Subsidy
Harvest Planting and harvesting techniques that Volunteer crops (those left on the field and harvested
leave remnants on the fields (volunteer crops) early the following year) are lost if not used for home
consumption.
Harvesting tools cause damage Damaged/cut potatoes: partly for home consumption,
with the rest being losses.
Harvest timing – premature harvesting Green potatoes are losses if they are not used for seed.
(green potatoes) or harvesting in wet
weather
Packing Quantity and quality of produce packed into
extended bags
Size of extended bags
Material of extended bags
Transpor Weight of extended bags does not allow
tation and careful handling
handling Extended bags become heated (affecting
sugar content)
Several stages of loading and unloading prior
to reaching the end customer
Losses due to a lack of access roads or poor
road conditions
Inadequate means of transport
Storage Lack of storage facilities or simple stores
Unsuitable varieties for storage
Stored products are immature, not
disease-free
Market Wet markets (dirt, contamination, weather) Lower prices due to market oversupply/fluctuations are
conditions not losses.
Losses caused by lack of sales are incorporated.
Green potatoes due to sunlight and inadequate Reduction of prices due to low quality (green/cut potatoes)
packaging material (nylon) cause financial losses.
Processing Wrong varieties for processing
Sorting and grading losses Additional labour required to sort/cut potatoes causes
financial losses.
Forced to process by-products Potato peel is not a loss.14 Methodology
2 Methodology
The chosen methodology was based on a five-step Bomet County was selected to gain an understanding
approach (details in Table 27, Annex 1) following that of of contract farming from farmers producing potatoes
the FAO (van Otterdijk 2012). for processors. The production, marketing and handling
practices of contract farmers are influenced by contrac-
1. Screening of food losses including rapid appraisal. tual arrangements. They plant varieties preferred by
2. Survey on food loss assessment. processors, allow the crop to fully mature before harvest
3. Sampling including load-tracking assessment. and, in the main, pack potatoes in standard 110 kg bags.
4. Data analysis, verification workshop and reporting.
5. Synthesis: recommendations and solution finding. Meru County farmers have secured a niche market, sup-
plying potatoes to most of the markets in the drylands
General data for the study were collected from published of northern Kenya, such as Marsabit. They also supply
sources and through key informants, and specific data markets in Meru and Embu Counties. In Meru County,
through questionnaires and group discussions.6 Con- farmers grow potatoes off-season and use irrigation.
ducting a rapid appraisal to determine specific issues Both irrigating and non-irrigating farmers allow the crop
during the preparatory stage proved to be crucial for get- to fully mature before harvesting.
ting a better understanding of the context and for better
preparing the survey. Nakuru County farmers mainly sell in large extended
bags. Farmers are known not to wait until their crops are
Data was collected during the survey from the major fully mature – traders ask farmers to harvest as soon as
participants along the value chain and on the major the crop flowers and farmers also like to harvest early
sources, causes and also quantities of loss and waste. when the prices are high.
A randomised survey was used so that statistically
reliable quantitative data could be obtained on losses at Nyandarua County farmers grow potatoes in all sub-
the defined critical points. Multi-stage sampling was counties as their main crop. Contract farming was in-
employed so that different regions and types of farmer, troduced in 2013 but is not progressing well. Nyandarua
broker and trader were included in the survey. The farmers also tend to harvest potatoes before they are
survey results were discussed in a verification workshop, fully mature to take advantage of high prices. Nyandarua
which provided further input to the reporting. and Nakuru Counties are two of the major sources of
potatoes marketed in Nakuru, Nairobi and Mombasa.
2.1 Sampling of counties and value Ware potato growers/farmers
chain actors All the major potato growing sub-counties in each of the
four selected counties were included in the survey. Two
The farmer survey was conducted in four main potato- sub-counties were selected in Bomet (Bomet Central and
growing counties in Kenya, namely Bomet and Nakuru Bomet East), three in Nakuru (Molo, Kuresoi, Njoro), four
Counties in the Rift Valley area, Nyandarua County in in Nyandarua (Kinangop, Mirangine, Nyandarua North
Central Kenya and Meru County in Eastern Kenya (Fig- and Ol Kalou) and two in Meru (Buuri and Meru Central).
ure 2). These four were purposively selected to provide
a representative overview of potato production, post- The sample size was calculated according to potato
harvest handling and marketing practices in the country. producing households and using information from the
In Bomet and Nyandarua counties contract farming is Seed Potato Sub-sector Master Plan for Kenya 2009-2014
already underway. (Kaguongo et al. 2010).
6 The questionnaires are attached in Annex 3.Methodology 15
South Sudan
Ethiopia
Counties
1 Turkana 25 Nakuru
N
1 6 2 Marsabit 26 Narok
3 Samburu 27 Bomet
4 Laikipia 28 Migori
2 5 Isiolo 29 Kisii
6 Mandera 30 Nyamira
7 Mandera 31 Kericho
8 Garissa 32 Homa Bay
9 Tana River 33 Kisumu
Uganda 10 Lamu 34 Siaya
7 11 Kilifi 35 Vihiga
41 12 Kwale 36 Nandi
13 Taita-Taveta 37 Kakamega
3 14 Kitui 38 Uasin Gishu
Somalia 15 Makueni 39 Elgeyo-Marakwet
44 16 Kajiado 40 Baringo
39 5 17 Machakos 41 West Pokot
45 40
18 Nairobi 42 Mombasa
38
43 19 Kiambu 43 Busia
37 4 20 Murang’a 44 Trans Nzoia
36 23
35 21 Nyeri 45 Bungoma
34
22 Embu 46 Kirinyaga
Lake 33 47 23 Meru 47 Tharaka-Nithi
Victoria 31 24
25 21 24 Nyandarua
32 46 8
30 22
29 27 20
28 19
26 18 17 14
NAIROBI 9
16 15 10
Tanzania
11 0 100 200 300 km
13
0 50 100 150 miles
42
12
©GIZ/Ira Olaleye
Figure 2: Map showing the four counties surveyed
To collect data from farmers, specific questionnaires were ed according to the number of potato producing house-
developed (Annex 3). The questionnaires were used as an holds in the four counties. In Bomet, 52 farms
interview guide for the trained enumerators tasked with (39 individual farmers and 13 contracted farmers) were
collecting information from farmers. Using enumerators included; in Nakuru, 69 farms; in Nyandarua, 73 farms
was important as some of the farmers were not able to (60 individual potato farmers and 13 contracted
read and therefore could not complete the questionnaires farmers); and, in Meru, 53 farms were surveyed. The
without assistance. A sample of 247 randomly selected results in the tables and graphs summarised under ‘all’
farmers was interviewed.7 The sample size was calculat- show the weighted average of the counties.
7 A multi-stage sampling technique was adopted to select and in each sub-location administrative units were listed
the farmers. In each of the counties, all the sub-counties and a sample selected. From each unit, villages were listed
that grow potatoes were listed and then a sample was and a sample selected, and then the farmers who grow and
selected at random. Once the sample of sub-counties was sell potatoes in each village were listed and a sample
obtained, the wards in each sub-county were listed and a selected. On average, a sample of four farmers per village
sample of these was then selected. From here, locations in were interviewed. Farmers with contract farming arrange-
the chosen wards were listed and a sample selected. In each ments were indicated in the questionnaires using the
location, the sub-locations were listed and a sample selected relevant respondent code.16 Methodology
Brokers challenges. On this basis, broker selection was purposive
Brokers’ characteristics are the same in each county and, as they work in groups, it was decided to organise
in terms of how they operate, link up with traders and group discussions. Groups from the sub-counties with
farmers, get paid for the work they do, and grade and the highest potato production and marketing activities
package potatoes, and also in that they face the same were selected (Table 3).
Table 2: Breakdown of farmer samples8
County Sub-county Villages surveyed Number of farmers County sample size
BOMET Bomet Central 9 36 52
Bomet East 4 16
MERU Meru Central 4 17 53
Buuri 9 36
NAKURU Kuresoi 7 28 69
Njoro 5 17
Molo 6 24
NYANDARUA Kinangop 6 24 73
Mirangine 6 24
Nyandarua North 3 12
Ol Kalou 1 13
60 247 247
Table 3: Breakdown of samples of other value chain actors
County Brokers Group Wholesalers Retailers Supermarkets Restaurants Processors
BOMET 1 4 3 1
MERU 1 4 3 1
NAKURU 1 4 3 1 1
NYANDARUA 1 4 3 1 1
MOMBASA 4 3 3
NAIROBI 16 12 2 3 2
4 63 3 10 3
8
8 See also Table 26 in Annex 1.Methodology 17
Wholesalers and retailers 2.2 Measurement
Trader samples were selected at random. The potato
traders present in each market were listed and three With regard to farm size and potato fields, the interview
wholesalers and four retailers were randomly selected discussions with farmers were based on quarter acres
and interviewed. In Nairobi, four different market places (1,000 m2) but that was later changed to one hectare
were included: Wakulima, Gikomba, Kangemi and (10,000 m2). Since farmers use several plots on their farm
Githurai. A total of 63 traders were interviewed: for potatoes, they were asked to quantify according to the
27 wholesalers, 27 retailers, and 9 traders who conducted output of their largest potato plot under production. This
both wholesale and retail operations. approach meant farmers could provide more concrete
answers but also carried the risk that they would overes-
Supermarkets timate output when converting the information to the
Supermarkets are mainly located in the major urban cen- farm scale. All data were finally converted into quantities
tres. In many supermarkets, purchasing is centralised and per hectare.
branches receive weekly goods deliveries. The pattern of
purchasing agricultural produce is similar for most of Since different measures are used for business transac-
the supermarkets, with produce being supplied centrally tions across the surveyed counties, quantities and prices
by a contracted supplier on a weekly basis. Purposive were difficult to standardise. Various measures for the
sampling was used to select the three major supermarket so-called extended bags are currently in use, and all
chains – Nakumatt, Uchumi and Tuskeys – for interviews transactions are calculated in buckets/bags rather than
with branch supervisors. Data were collected from one by weight. The weight and content of extended bags are
branch in Nairobi and one in Nakuru town. assessed according to the number of buckets required to
fill a bag. An average bucket contains 17 kg of potatoes.
Processors
Potato processors who make crisps and chips are few in There are two key measurement terms associated with
Kenya. The main processors are the Nairobi-based com- extended bags: Kamba determines the size of the bag’s
panies Deepa Industries, Norda, Pioneer and Propack, netting top section and Kata determines the additional
and also Midlands, located in Nyandarua county. Pur- pieces of cut bags used to extend a standard bag (Table 4).
posive sampling was used to select three processors for Traders also use different names for different sizes of
interview. bag – for example, Gatabuko corresponds with Kata 2
Kamba 4, or Wa kaguku or Bomb correspond with
Restaurants Kata 2 Kamba 5. Mukurinu describes the closed-bag
Restaurants were sampled randomly from the high packing method used, with bags ranging in size from
streets of selected towns.9 One restaurant was inter- 160 to 200 kg.
viewed in each main town of the four study counties;
in Nairobi and Mombasa, the biggest potato markets in The observed weight per bag type varied by 7 to 10 kg
Kenya, three restaurants were selected in each city. (Table 5). The bag size keeps on changing from one season
to another and from one locality to another depending
on the buyer. Bags tend to be biggest at peak harvesting
seasons and smallest when potatoes are in short supply.
It should be noted that, because the survey was taken in
the off-season period, the range of packaging types used
in the market was fairly limited in many areas.
Three types of bag materials are used to pack and market
9 Sample selection involved picking one restaurant
potato, namely jute, sisal and nylon. Potatoes kept for
located in one of the three main streets of the principal
towns of each of the four study counties. In Nairobi and longer than a week in nylon bags spoil.
Mombasa three restaurants were selected for each city.18 Methodology
Table 4: Traditional potato measures
Packaging types
Non-extended bag Bucket Kamba 6 Kata 210 Mukurinu
Table 5: Traditional measures and their metric conversions
Name of packaging Size Average weight
Bucket 1 bucket 17 kg
Non-extended bag 7 buckets 119 kg
Kata 2 Kamba 4 11 buckets 180-187 kg
Kata 2 Kamba 5 12 buckets 195-204 kg
Mukurinu Different sizes 160-200 kg
2.3 Load tracking The identified bags (of Kata 2 Kamba 5 size) were traced
from their place of origin to their destination market
Bag size, weight and material are expected to have a in Nairobi. At the retail market level (the produce’s final
significant impact on produce quality and losses. To destination and location where bags are opened and re-
measure the impact of extended bags on the quality of packed), each of the bags were weighed and then opened
the potatoes and, thus, on losses, three bags were traced and the various categories of potato in each bag were
along the supply chain. separated out and weighed. To get a broader understand-
ing on the losses caused by the bags, interviews with re-
Starting on a farm in Kanjuiri village in Ol Kalou Sub- tailers included questions related to seasonal effects. 10
County, Nyandarua County, the packing of bags was
observed. Following this, packed bags were opened to
analyse their content. The sorting was performed on the
basis of selecting and weighing green, damaged/cut and 10 Kamba 6 is the size of the netting top section the bag.
Kata 2 indicates the number of additional cut bag pieces
rotten potatoes. Bucket-size samples were taken on the
used for the bag extension panels; in this case, it means two
farm to determine the levels of quality and loss accord- pieces of cut nylon bag are used with half a nylon bag for
ing to the above-mentioned definition. the top section.POTATO VALUE CHAIN IN KENYA – SURVEY RESULTS 19
3 Potato value chain in Kenya –
survey results
3.1 Background smallholders dedicating 0.2 to 0.4 hectares to potato
production, while approximately 17 per cent of potato
Potato is the second most important staple food in Kenya plots belong to larger-scale farmers dedicating 2 to
after maize. The most favourable climatic conditions for 10 hectares to the crop (Janssens et al. 2013). Average
potato cultivation in Kenya are found in areas at altitudes production in Kenya is estimated at 7 to 10 tonnes per
between 1,500 and 3,000 metres above sea level, where hectare (Muthoni et al. 2011), compared to a global
the country’s main staple food, maize, has no compara- average yield of 17 tonnes per hectare (FAOSTAT 2011).
tive advantage. At this altitude, potatoes grow faster than Kenyan farmers achieve up to two harvests per year.
maize and produce more energy and protein per hectare
per day. Potato production areas are found mainly in the The total production area has increased in recent years
highlands of the Central, Eastern and Rift Valley regions and is estimated to have reached 150,000 to 160,000
and on the slopes of Mount Kenya. Also, other regions hectares to date (Table 6).
like Mount Elgon (Bungoma County) in Western Kenya
are prominent production areas (see Figure 2).
Potatoes are grown by up to 800,000 farmers, who are
mainly smallholders.11 It is estimated that 83 per cent
of the land under potato cultivation belongs to
11 The exact number is not known. ‘The National Root and
Tuber Crops Policy’ published by the Ministry of Agriculture
in 2010 estimates the number of farmers to be 790,000. In
2011, the Ministry reported 800,000 farmers.
Table 6: Main potato producing counties and the total area under potato production in Kenya
County Area in ha 2010 2011 2012
Meru 17,463 12,500 18,092
Nyandarua 28,688 30,577 27,520
Nakuru 16,053 16,804 22,566
Bomet 2,900 3,680 2,987
Elgeyo Marakwet 8,311 15,097 20,992
Narok 6,836 7,808 6,292
Kiambu 11,271 10,092 18,769
Nyeri 8,067 6,404 7,821
Bungoma 5,113 6,051 5,321
Estimated total area under potato production 150,000-160,000 ha
Source: HCDA 2012, Kaguongo et al. 2013, and author’s own estimations.20 POTATO VALUE CHAIN IN KENYA – SURVEY RESULTS
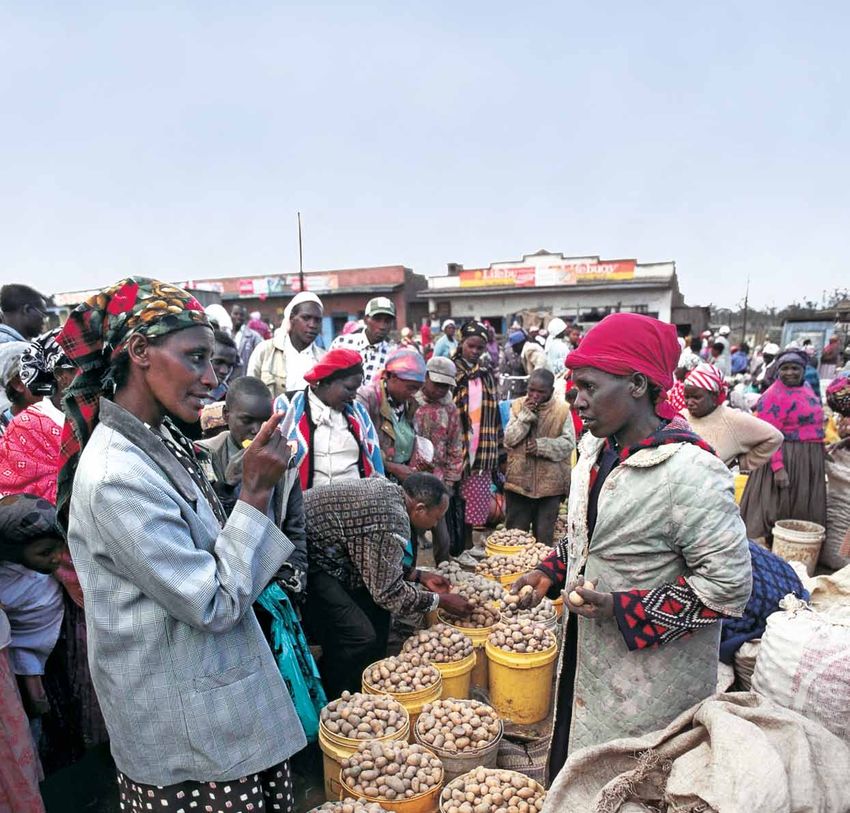
The common packing of potatoes in heavy bags
causes damages
The ware potato value chain is structured rather simply over KES 40 billion or EUR 339 million (1 per cent) to the
(Figure 3) given that most of the potatoes marketed are national economy (Kasina & Nderitu 2010). It therefore
bought and consumed as fresh produce by end-consumers. follows that potato is an important economic crop.
Farmers sell their produce mostly via brokers to local
traders. Local traders take the produce to the wholesale In addition to there being up to 800,000 potato farmers,
markets where, again, brokers organise sales on behalf of another 2.5 million people work in the potato value
the traders. Only farmers engaged in contract farming chain (Kaguongo et al. 2013). Potato is ideal as a food
for the processing industry sell directly to their custom- security crop as it has a short season and provides food
ers. Processing accounts for only around 9 per cent of within just 2.5 to 3 months, especially when planting
marketed produce,12 although a trend towards increasing fast-maturing varieties. At the same time, farmers are
demand for processed products has been observed. assured of a harvest as the crop is drought resistant and
will provide some produce, even with little rain.
Average per capita consumption is estimated at 30 kg
and is expected to rise due to increases in potato
consumption by urban populations (FAO 2013) and rapid
population growth. Present estimates indicate that
around 1 to 1.5 million tonnes of potatoes are marketed
in Kenya per season.13 Currently, potatoes contribute
12 According to NPCK estimates.
13 In 2012, Kenya had a population of 41 million and this is
expected to rise to 50 million by 2020 (Zulu et al. 2012).POTATO VALUE CHAIN IN KENYA – SURVEY RESULTS 21
Figure 3: Ware Potato Value Chain
On-farm Packaging/ Consump-
Stage Processing Wholesale/retail trade
production transport tion
Brokers Brokers Retailers
Farmers
End-
users
Whole-
Operators Local Restaurants
salers
traders House-
holds
Contract Industrial
farmers processors Super-
market
3.2 Potato production The education levels of ware potato growers correspond
with their age (Table 28 in Annex 2). Bomet County,
3.2.1 Ware potato growers where potato production often involves contract farming
The characteristics of the potato farmer sample (Table 28 for processors, there are more young farmers. Farmers in
in Annex 2) indicate the dominance of elder male farm- this County also had the highest levels of literacy, with
ers heading a family of five to six persons (68 per cent 73.1 per cent having completed secondary education and
of the respondents were men, 32 per cent women). That college. Compare this with Nakuru County, for example,
said, the sub-sector is known for being gender-balanced. where farmers had a low literacy level and only 49.3 per
GIZ’s PSDA14 programme conducted labour studies in cent had completed secondary and college education.
selected agriculture sub-sectors and the study on the A comparison of male and female respondents showed
potato sub-sector showed that women (49 per cent) and higher illiteracy among women (10.3 per cent to 2.4 per
men (51 per cent) are nearly equally involved in the op- cent of men) and consequently a lower education level
erations.15 Some operations are heavy-duty in nature, (Table 29 in Annex 2).
meaning they are more likely to be performed by men
(e.g., the handling of extended bags); conversely, women Age and education is known to have an impact on
dominate the retail business. openness to change and innovation and on the com-
mercialisation of agricultural production. Farmers with
higher levels of education tend to be more efficient in
14 http://www.gtzpsda.co.ke/index.php?option=com_conte production. Better performance by more educated farm-
nt&view=article&id=18&Itemid=55
ers may be attributed to the fact that education gives the
15 This runs in contrast to sweet potato production where,
according to the GIZ PSDA study, women perform 75 per farmers the ability to perceive, interpret and respond to
cent of the production activities.22 POTATO VALUE CHAIN IN KENYA – SURVEY RESULTS
new information and improved technology such as ferti- equivalent to 1 to 1.5 million tonnes per season. The
lisers, pesticides and planting materials much faster than farmers interviewed for the study looking at main pro-
their counterpartss (Nyagaka et al. 2009). duction areas harvest on average 13.5 tonnes per hectare
per season, which is higher than the national average.
Land holdings and production methods
Smallholders with farm sizes averaging less than 2 hec- Most farmers produce two potato crops a year because
tares dominate the potato sub-sector in Kenya. Land of the bimodal rainfall in most potato growing areas.
ownership is predominantly freehold. The average farm The long rainy season lasts from March/April to June/
size of surveyed potato farmers was 1.6 hectares (Table 7), July, while the short rainy season lasts from October to
while the average area of land given over to potato December (Table 34 in Annex 2). Among the surveyed
growing was 0.6 hectares, or 35.4 per cent of their overall counties, only farmers from Meru (79.2 per cent) practise
farmland. Nyandarua County had the largest average substantial off-season farming using irrigation, and these
land holding (1.9 hectares), with 0.7 hectares being dedi- off-season crops secure higher prices (Table 7).
cated to potato growing. Conversely, Bomet County had
the smallest average land holding (1.4 hectares) and also The majority of surveyed potato farmers (95.5 per cent)
the smallest area dedicated to potato growing (0.3 hectares). indicate that they practise crop rotation. However, the
effectiveness of this crop rotation could not be deter-
Putting together a serious estimate of harvested and mined as farmers did not report their rotation schedule.
marketed potato in Kenya is difficult as data on produc- It is known that farmers rotate crops with, for example,
tion areas and yields are not systematically collected. maize, beans or cabbages; however, such rotations are
Also, bag sizes used by traders vary from one area to an- not designed for the control of pests and diseases. CIP
other. MoALF and the Horticultural Crops Development reported that 21 per cent of farmers grow potatoes
Authority (HCDA) publish annual production data and, continuously on the same plot and only one out of two
in 2012, HCDA calculated a production of 2.53 million farmers practises some form of rotation (Kaguongo et al.
tonnes on a 143,000-hectare area. The Kenyan Agricul- 2008).
tural Research Institute (KARI) estimates smallholder
yields to be in the region of 7 to 10 tonnes per hectare,
Table 7: Land holdings and farming practices
Bomet Meru Nakuru Nyandarua All
n=52 n=53 n=69 n=73 n=247
Potato yield (kg/ha) 13,243.8 11,888.6 14,950.3 13,629.4 13,551.6
Quantities eaten per farmer family (kg/ha) 1,295.6 2,032.7 1,326.8 1,041.8 1,394.9
Land holding in ha
Total farm size 1.4 1.5 1.6 1.9 1.6
Land for potato production 0.3 0.4 0.7 0.7 0.6
Farming practices (%)
Potato production irrigated 0.0 79.2 8.7 2.7 20.2
Farmer practising crop rotation 100 100 92.8 91.7 95.5POTATO VALUE CHAIN IN KENYA – SURVEY RESULTS 23
Kenya’s soil-borne diseases,16 limited pest management Photograph 1: The Shangi potato variety
and low soil fertility mean current production practices
are not sustainable. This situation is further aggravated
by the remnants left in the field after harvest that pro-
duce so-called volunteer plants in the next season. Even
though crops are rotated, the volunteer plants will carry
diseases from one season into the next. The PHL survey
showed that 97 per cent of interviewed farmers report
leaving volunteer plants in the field, using them mostly
for home consumption. The average quantities remain-
ing in the field are estimated at 0.65 tonnes per hectare,
Given surveyed farmers report an average yield of
13.5 tonnes per hectare, we can deduce that at least
5 per cent of the potato crop is left in the ground. A total
of 53.2 per cent of farmers allow the volunteer plants to
grow for home use, while others uproot the remnants Farmers’ seed system
(Table 37 in Annex 2). More than 60 potato varieties are grown in Kenya, but
relatively few are widely distributed. The dominance
of certain varieties shifts over time. Today, Shangi17
(a farmers’ variety, shown in Photograph 1) and Tigoni
(an officially released variety) are the main varieties be-
cause of market preferences (Table 45 in Annex 2). Shangi
has a very short cooking time, saving energy and cutting
costs, and so is preferred by low-income households. Al-
though most varieties in Kenya have white skin, there is
preference in some regions for red skin varieties.
Table 8: Potato varieties grown
Potato varieties grown in each county Bomet Meru Nakuru Nyandarua All
(% within the county) n=52 n=53 n=69 n=73 n=247
Shangi 30.8 49.1 98.5 100 74.0
Asante 0.0 79.2 5.9 6.8 20.7
Dutch Robjin 96.2 0.0 2.9 0.0 21.1
Tigoni 3.8 0.0 17.6 38.4 17.1
Sherekea 0.0 50.9 5.9 8.2 15.0
Kenya Karibu 7.7 0.0 14.7 23.3 12.6
Tigoni Red 0.0 52.8 0.0 0.0 11.4
Désirée 23.1 3.8 4.4 11 10.2
16 A recent survey showed that bacterial wilt was the most
prevalent disease, affecting 77 per cent of potato farms,
followed by late blight affecting 67 per cent and viral
diseases affecting 12 per cent (Kaguongo et al. 2014). See also
Janssens et al. 2013. 17 Shangi is also called ‘Zangi’ or ‘Cangi’ in other publications.24 POTATO VALUE CHAIN IN KENYA – SURVEY RESULTS
The farmer seed system currently dominates the sub- ing industry and industrial clients generally provide the
sector. Due to limited seed production, the lack of attrac- required seed material.
tive varieties and an insufficient distribution network,
certified seed18 – including clean seed and positive select- On-farm seed multiplication is further supported by
ed seed – only meets around 5 per cent of the national varieties like Shangi; however, the variety is not certi-
demand for seed potato, according to NPCK. The limited fied and clean Shangi seed is not available. So, despite its
availability and use of quality (and certified) seed potato advantages of higher yields and fast growth, the variety is
is a key barrier to increasing productivity in Kenya’s easily affected by disease. Shangi germinates rapidly after
potato sector. Given farmers tend to practise short crop harvest, meaning seed tubers can be planted out within
rotations, seed potato quality is an important factor in just a few weeks. This short dormancy means the seed
improving the sustainability of production. Clean seeds from one season can be planted in the next growing sea-
have the greatest impact on yields followed by irrigation, son. As ware potato, the variety is immediately sold after
fungicides and fertilisers. However, clean seeds have the harvest, given it is not suitable for storage.
lowest adoption rate (Wang’ombe & van Dijk 2013). Of
the farmers interviewed, most (77.7 per cent) used farm- Harvesting practices
ers’ seed, with the main sources being their own harvest A total of 64 per cent of the farmers reported that they do
or seed from neighbouring farms (Table 33 in Annex 2). not harvest potatoes when it is raining. However, those
Only 6.9 per cent of farmers use certified seed purchased who do harvest during the rains experience damage and
from certified seed suppliers (Graph 3 in the Annex 2). loss of up to 1,469 kg/ha, mostly caused by the potatoes
rotting. When converted to the average of surveyed
Only 42 per cent of farmers renewed seed regularly farmers, these losses stand at 344.2 kg/ha (Table 9). Farm-
(Graph 4 in Annex 2). The seed renewal rate was higher in ers tend to harvest during the rains in order to reach the
Bomet and Meru where more than 60 per cent of farmers market early and fetch higher prices. Also, traders force
renewed seed after one to three seasons. Conversely, over farmers to harvest early. A comparison of farmers from
50 per cent of farmers in Nyandarua and Nakuru Coun- Bomet and Nyandarua engaged in contract farming
ties never renewed their seed. Farmers from Meru and (Table 13) clearly indicates the impact of market forces
Bomet showed the highest rate of certified seed applica- on harvesting during the rains – e.g. contracted farmers
tion (30 per cent). Note that in Bomet farmers are much from Bomet report 90 per cent less rain-induced damage
more likely to be involved in producing for the process- than non-contracted farmers in the county. Still, weath-
er conditions also play a role, such as when unexpected
rains occur during a harvest. Annual rainfall patterns are
18 Clean seed: Multiplied at farm level, clean seed
becoming less easy to predict, with both drought and
originates from certified or basic seed and its production
follows guidelines laid down in farmer training programmes unseasonable rainfalls affecting production.
delivered by organisations like MoALF, KARI or GIZ. Most
production guidelines used in the production of certified
seed are also used to produce clean seed – the only differ-
ence is that the sample testing and supervision by KEPHIS is
lacking. Negative selection is used to remove diseased and
weak plants.
Positively selected seeds: Positively selected seeds are
produced from ordinary or farmer-saved seeds through a
process of selection undertaken by farmers who know how
to select and manage good seed. However, Kenyan law
stipulates that certified seed developed in accordance with
strict production guidelines and inspected by the Kenya
Plant Health Inspectorate Service (KEPHIS) are the only
seeds that can be traded. All other seeds – including
positively selected seeds, clean seeds and farmers’ own seeds
– are considered to be non-tradable by law (Kaguongo, W. et
al. 2014).You can also read