Post-Processing Time Dependence of Shrinkage and Mechanical Properties of Injection-Molded Polypropylene - MDPI

 
CONTINUE READING
Post-Processing Time Dependence of Shrinkage and Mechanical Properties of Injection-Molded Polypropylene - MDPI
materials
Article
Post-Processing Time Dependence of Shrinkage and
Mechanical Properties of Injection-Molded Polypropylene
Artur Kościuszko, Dawid Marciniak * and Dariusz Sykutera

                                                Department of Manufacturing Techniques, UTP University of Science and Technology, Kaliskiego 7,
                                                85-796 Bydgoszcz, Poland; artkos@utp.edu.pl (A.K.); sykutera@utp.edu.pl (D.S.)
                                                * Correspondence: dawid.marciniak@utp.edu.pl; Tel.: +48-52-340-87-19

                                                Abstract: Dimensions of the injection-molded semi-crystalline materials (polymeric products) de-
                                                crease with the time that elapses from their formation. The post-molding shrinkage is an effect of
                                                secondary crystallization; the increase in the degree of polymer crystallinity leads to an increase in
                                                stiffness and decrease in impact strength of the polymer material. The aim of this study was to assess
                                                the changes in the values of post-molding shrinkage of polypropylene produced by injection molding
                                                at two different temperatures of the mold (20 ◦ C and 80 ◦ C), and conditioned for 504 h at 23 ◦ C.
                                                Subsequently, the samples were annealed for 24 h at 140 ◦ C in order to conduct their accelerated
                                                aging. The results of shrinkage tests were related to the changes of mechanical properties that
                                                accompany the secondary crystallization. The degree of crystallinity of the conditioned samples was
                                                determined by means of density measurements and differential scanning calorimetry. It was found
                                                that the changes in the length of the moldings that took place after removal from the injection mold
                                                were accompanied by an increase of 20% in the modulus of elasticity, regardless of the conditions
                                                under which the samples were made. The differences in the shrinkage and mechanical properties
                                                of the samples resulting from mold temperature, as determined by tensile test, were removed by
                                                annealing. However, the samples made at two different injection mold temperature values still
                                                significantly differed in impact strength, the values of which were clearly higher for the annealed
       
                                         samples compared to the results determined for the samples immediately after the injection molding.
Citation: Kościuszko, A.; Marciniak,
D.; Sykutera, D. Post-Processing Time
                                                Keywords: injection molding; polypropylene; post-molding shrinkage; 3D scanning; mechanical
Dependence of Shrinkage and Mechan-             properties
ical Properties of Injection-Molded
Polypropylene. Materials 2021, 14, 22.
https://dx.doi.org/10.3390/ma1401
0022                                            1. Introduction
                                                     The injection process is commonly used to produce polymer products, even with com-
Received: 13 November 2020
                                                plex shapes. The injection molded parts are expected to have required dimensions within
Accepted: 21 December 2020
                                                the accepted tolerance range [1]. The moldings should be free from sink marks, voids and
Published: 23 December 2020
                                                warpage [2–4] after the end of the processing cycle. Moreover, the dimensions and shape of
                                                the moldings should be maintained throughout their lifetime. The main problem of precise
Publisher’s Note: MDPI stays neu-
                                                mapping of the dimensions and shape of the injection mold cavity is processing induced
tral with regard to jurisdictional claims
in published maps and institutional
                                                shrinkage, which is a measure of the volume and shape changes due to the cooling condi-
affiliations.
                                                tions by injection molding. Processing shrinkage is defined as the difference (expressed
                                                as a percentage) between the dimensions of the mold cavity and the dimension of the
                                                molded part (at 23 ± 2 ◦ C), related to the cavity dimension. The test of the shrinkage of the
                                                moldings is usually performed 16–24 h after the end of processing cycle (representing the
Copyright: © 2020 by the authors. Li-           primary shrinkage). Nevertheless, after this time, the dimensions of the injection moldings
censee MDPI, Basel, Switzerland. This           of several polymeric materials are not fully stabilized. Depending on the storage and/or
article is an open access article distributed   conditions of use, the dimensional changes of moldings over time may continue up to
under the terms and conditions of the           1000 h from their production, as the secondary shrinkage [5]. This applies in particular
Creative Commons Attribution (CC BY)
                                                to semi-crystalline materials whose glass transition temperature is lower than the service
license (https://creativecommons.org/
                                                temperature.
licenses/by/4.0/).

Materials 2021, 14, 22. https://dx.doi.org/10.3390/ma14010022                                                  https://www.mdpi.com/journal/materials
Post-Processing Time Dependence of Shrinkage and Mechanical Properties of Injection-Molded Polypropylene - MDPI
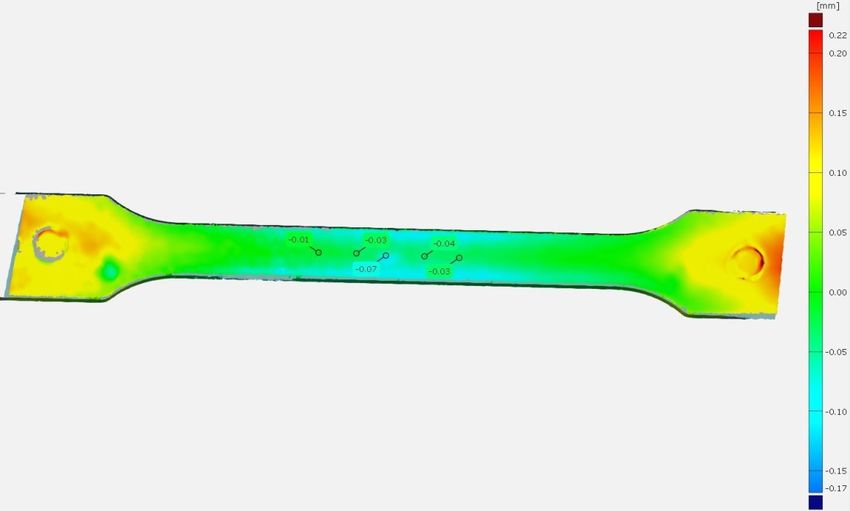
Materials 2021, 14, 22                                                                                          2 of 15

                              Shrinkage is caused by a gradual decrease in the volume of the polymer material
                         during the molded state, as well as after its removal from the mold cavity. The change in
                         the volume of the material is a consequence of thermal expansion. Moreover, the partially
                         crystalline polymers undergo a transformation from an amorphous liquid phase to a
                         partially crystalline solid phase. To describe the phenomena occurring during contraction,
                         graphs of the relationship between pressure (p), volume (v) and temperature (T) are
                         used [6,7]. The content of individual phases in finished products significantly affects
                         their physical properties [8]. An effect of the development of the well-organized structure
                         of macromolecules during crystallization is an increase in the density of the material.
                         Ducić [9] showed that the density of fully crystalline polypropylene (PP) is 0.936 g/cm3
                         and is about 7% higher compared to amorphous PP (0.869 g/cm3 ). A modification of the
                         crystal structure of polypropylene, and thus of mechanical properties, can be achieved
                         by heterogeneous nucleation [10,11]. The development of various crystalline forms, due
                         to the polymorphic character of isotactic polypropylene (iPP), was observed and widely
                         described [12–15]. A number of studies have been conducted to reduce the shrinkage
                         value of injection moldings [16–18]. In the case of thick-walled products, the porous
                         process of polymeric materials is often used. In practice, two porous methods are used:
                         chemical [19,20] and physical (microcellular injection molding) [21,22]. However, the use
                         of this type of modification may reduce the tensile strength and impact strength [23,24] of
                         the polymeric material.
                              Studies involving the assessment of the influence of the post-processing time on the
                         properties of PP have already been conducted by many researchers [25–27]. The authors
                         usually considered long-term conditioning at temperature between 21–23 ◦ C as a type of
                         aging test. Gahleitner [28] considered changes in impact strength and flexural modulus
                         for PP moldings conditioned for less than 10,000 h at 23 ◦ C. Yue [29] conducted the
                         aging process for 6000 h (250 days), testing the stress at yield point and determining the
                         degree of crystallinity of the samples by using the differential scanning calorimetry (DSC)
                         measurements. About a 20% increase of stress at yield was observed for compression
                         molded parts. In contrary to Yue’s work, the results of the investigations published by
                         Sližová [30] seem surprising. The author indicates that after 30 years of storage under
                         changing conditions, the stress at yield point of PP moldings has not changed.
                              The research consisting of the assessment of the influence of the conditioning time
                         on the structure and mechanical properties of polypropylene was usually carried out on
                         films [28], samples cut from sheets or bars or samples obtained by compression mold-
                         ing [9,29,31]. Moreover, the PP structure was often stabilized by annealing prior to the
                         main aging tests. There are a few research studies in this area that deal with the subject of
                         changes occurring in structure and properties of the samples made by injection molding
                         during their conditioning. The samples prepared by the injection method at the variable
                         temperature of the injection mold are used primarily in research aimed at assessing the
                         influence of this process parameters on the structure and mechanical properties of molded
                         parts [32,33]. PP samples produced at a high temperature of the injection mold are usually
                         characterized by a higher degree of crystallinity and stress at the yield point. However, no
                         publication has been found that describes the relationship between the samples’ prepara-
                         tion conditions with the injection molding method, the conditioning time and shrinkage,
                         structure and mechanical properties, using the example of PP molded parts with the same
                         weight.
                              The main aim of this research was to assess the mechanical properties of PP thick-
                         walled molded parts in relation to changes of their shrinkage during post-molding time.
                         The tests were carried out for moldings having the same mass, formed at two different
                         temperature values of the injection mold. Apart from traditional measuring tools, the 3D
                         optical scanning method was used to evaluate the post-molding shrinkage. Moreover, the
                         changes in dimensions and mechanical properties of the test samples were compared with
                         changes in the structure. The results of the carried out research supplement the knowledge
Post-Processing Time Dependence of Shrinkage and Mechanical Properties of Injection-Molded Polypropylene - MDPI
Materials 2021, 14, 22                                                                                            3 of 15

                         on the relationship between the injection moldings parameters and the structure, as well as
                         mechanical properties of conditioned thick-walled PP molded parts.

                         2. Materials and Methods
                         2.1. Material
                              Commercial grade of Moplen HP 500N, an isotactic polypropylene by Basell Orlen
                         Polyolefins (Płock, Poland), was used in our research. This material is proposed for process-
                         ing by injection molding. The mass flow rate (MFR) of Moplen HP 500N was 12 g/10 min
                         (230 ◦ C, 2.16 kg); the modulus of elasticity (E) and tensile strength (Rm), as declared by the
                         manufacturer, were 1550 MPa and 35 MPa, respectively. The polymer was not modified by
                         nucleation.

                         2.2. Samples Preparation
                               The test specimens were made by injection molding using the Engel (Schwertberg,
                         Austria) e-victory 110 hybrid injection molding machine, with a clamping force of 1100 kN.
                         We have used a four-cavity injection mold [34], allowing for the production of universal
                         A-type test samples with their dimensions corresponding to ISO 3167 standard. The length
                         at the mold cavity (LF ) was 168 mm. The thickness of the obtained samples was about 4 mm.
                         The samples were produced at two different injection mold temperature values (TF ), equal
                         to 20 ◦ C (designation PP20) and 80 ◦ C (designation PP80), respectively. A mold temperature
                         of about 20 ◦ C is commonly used in industrial practice to produce PP products, while about
                         80 ◦ C is the upper limit of the mold temperature that can be used for this type of material.
                         The injection mold was thermostated using the HB-160Z1 device produced by HB-Therm
                         (St. Gallen, Switzerland). The temperature of individual zones of the plasticizing system
                         was 230 ◦ C (nozzle), 230 ◦ C, 220 ◦ C, 200 ◦ C and 40 ◦ C at the feed zone. The injection rate
                         was 50 cm3 /s and the holding pressure was 19 MPa. The holding time was set in such
                         a way to assure a similar weight of individual test samples (8.60 ± 0.02 g), regardless of
                         temperature value of the injection mold. For the mold temperature of 20 ◦ C, the holding
                         time was 21 s, and the cooling time was 46 s, while for the TF equaling 80 ◦ C, these values
                         were 45 s and 70 s, respectively. As mentioned above, the differentiation of the holding
                         time was important in obtaining test samples of similar mass. It should be emphasized
                         that in the injection molding, increasing the temperature of the mold, while maintaining
                         constant values of other process parameters, primarily the same duration of the holding
                         phase, results in obtaining moldings of a lower mass. This is due to the phenomenon of PP
                         thermal expansion. By increasing the temperature of the injection mold, it is possible to
                         extend the duration of the holding phase, which is practiced in the industry to increase
                         the dimensional accuracy of molded parts. The result is an increase in mass compared
                         to the mass of molded parts obtained at a lower mold temperature. The samples were
                         conditioned for the period of 504 h at 23 ◦ C and air humidity RH = 50%. After this time,
                         the samples were heated for 24 h at 140 ◦ C (samples signature—504 h A).

                         2.3. Measurements of Moldings Shrinkage
                             The values of linear processing shrinkage (S) were calculated on the basis of the
                         samples length (LT ) with the use of the following formula:

                                                                   L F− LT
                                                            S=             × 100%.                                   (1)
                                                                      LF

                              The measurements were carried out by means of MarCal 16ER caliper by Mahr
                         (Göttingen, Germany) after 1 h, 24 h, 48 h, 72 h, 168 h (7 days), and finally after 504 h
                         (21 days) from the formation of the moldings, at 23 ◦ C always for 10 samples from each
                         measurement series. Moreover, the geometry of the samples was measured after 24 h of
                         annealing at 140 ◦ C, 1 h after the end of annealing. The study of the shrinkage of specimens
                         produced at the mold temperature of 20 ◦ C and 80 ◦ C, characterized by a similar weight,
Materials 2021, 14, 22                                                                                                                               4 of 15

      Materials 2021, 14, x FOR PEER REVIEW                                                                                         4 of 17

                                       was aimed to assess the impact of processing conditions and the conditioning time on the
                                       shrinkage
                                        at the mold value      of PPofmoldings.
                                                       temperature       20 °C and 80 °C, characterized by a similar weight, was aimed
                                        to assess the impact ofshrinkage
                                              Moreover,      the    processing of   the PP samples
                                                                                 conditions               was investigated
                                                                                              and the conditioning                using
                                                                                                                        time on the      the 3D Atos Triple
                                                                                                                                     shrinkage
                                       Scan
                                        value optical     scanner by GOM (Braunschweicg, Germany) equipped with cameras with a
                                               of PP moldings.
                                              Moreover,
                                       resolution     of 5the
                                                            MPx.shrinkage   of the PP samples
                                                                    The preparation       of testwas  investigated
                                                                                                   samples            using the 3D Atos
                                                                                                              for measurement            Triple of marking
                                                                                                                                      consisted
                                        Scan  optical   scanner   by  GOM    (Braunschweicg,     Germany)   equipped
                                       the surface with reference points with a diameter of 1.5 mm, and in matting,       with cameras   with a the surface
                                        resolution of 5 MPx. The preparation of test samples for measurement consisted of mark-
                                       with a powder applied with an aerosol (Figure 1). The geometry measurements were
                                        ing the surface with reference points with a diameter of 1.5 mm, and in matting, the sur-
                                       carried    out for samples conditioned for 1 h, 504 h, as well as after 24 h of annealing. Using
                                        face with a powder applied with an aerosol (Figure 1). The geometry measurements were
                                       the
                                        carried out Inspect
                                             GOM      for samplesSiute  2020 software,
                                                                     conditioned            a comparison
                                                                                   for 1 h, 504               between
                                                                                                h, as well as after         the
                                                                                                                      24 h of   surface Using
                                                                                                                              annealing.  geometry of PP20
                                       sample
                                        the GOM(the      reference
                                                    Inspect  Siute 2020sample)    and
                                                                          software,     PP80 sample
                                                                                     a comparison         afterthe1 surface
                                                                                                     between        h of conditioning,      was carried out
                                                                                                                             geometry of PP20
                                       in  order(the
                                        sample      to reference
                                                        determine      the deviations
                                                                   sample)                 fromafter
                                                                             and PP80 sample       the1reference       surfacewas
                                                                                                         h of conditioning,     (∆h).  A detailed
                                                                                                                                    carried out     analysis
                                        in the
                                       of  order   to determineinthe
                                                differences             deviations from
                                                                     dimensions      was the   reference surface
                                                                                            performed                (Δh). Alocated
                                                                                                           for 5 points       detailedalong
                                                                                                                                       analysis
                                                                                                                                              the symmetry
                                        of theofdifferences
                                       axis                   in dimensions
                                                 the 3 samples,        i.e., in was
                                                                                the performed
                                                                                     measurement  for 5 points
                                                                                                         sectionlocated
                                                                                                                    of thealong
                                                                                                                             testthe symmetry
                                                                                                                                  samples.    Moreover, the
                                        axis of the 3 samples, i.e., in the measurement section of the test samples. Moreover, the
                                       comparison of the samples geometry after 504 h of conditioning and after annealing was
                                        comparison of the samples geometry after 504 h of conditioning and after annealing was
                                       made.
                                        made. TheThePP20PP20andandPP80PP80    samples
                                                                        samples   after 1after  1 h of conditioning
                                                                                          h of conditioning                were thesamples
                                                                                                              were the reference      reference
                                                                                                                                             in samples in
                                       this  case.
                                        this case.

                                       Figure 1. Polypropylene sample prepared for the 3D scanning.
                                       Figure 1. Polypropylene sample prepared for the 3D scanning.
                                       2.4. Measurements of Density
                                       2.4. Measurements of Density
                                             The density of polypropylene samples was determined by an immersion method.
                                             The density were
                                        The measurements     of polypropylene
                                                                  carried out withsamples
                                                                                    the use ofwas  determined
                                                                                               AD 50              by Grańsk,
                                                                                                     balance (Axis,   an immersion
                                                                                                                              Poland), method. The
                                       measurements
                                        equipped with a setwere   carried
                                                              allowing     out withthethe
                                                                       to determine          useofof
                                                                                          mass    theAD    50 balance
                                                                                                      samples             (Axis,
                                                                                                                both, in the      Gra
                                                                                                                             air and  inńsk, Poland),
                                       equipped     with
                                        the immersion      a setwhich
                                                       liquid,    allowing   to determine
                                                                       was methyl              theamass
                                                                                     alcohol with   densityofofthe samples
                                                                                                                0.792          both,
                                                                                                                      g/cm3. The       in the air and
                                                                                                                                   tests
                                        were
                                       in  theperformed
                                                immersion at an  ambient
                                                              liquid,    temperature
                                                                       which            of 23 °Calcohol
                                                                               was methyl        for 10 samples
                                                                                                         with a after   1 h and
                                                                                                                   density        504 h g/cm3 . The
                                                                                                                             of 0.792
                                        from were
                                       tests  removing  the samples
                                                    performed         from
                                                                  at an     the injection
                                                                        ambient           mold and
                                                                                   temperature        23 ◦ C
                                                                                                   ofafter annealing   of the samples.
                                                                                                              for 10 samples     after 1 h and 504 h
                                        The density for single samples was evaluated based on the following formula:
                                       from removing the samples from the injection mold and after annealing of the samples.
                                                                               × based on the following formula:
                                       The density for single samples was evaluated
                                                                          =                                  (2)
                                                                               −
                                                                                 m × ρL
                                                                            ρ=                                          (2)
                                                                                 m − mL

                                       where the symbols m and mL denote the mass of the sample determined in the air and in the
                                       immersion liquid, where the symbol ρL denotes the density of the immersion liquid. The
Materials 2021, 14, 22                                                                                         5 of 15

                         crystallinity of the conditioned PP samples was determined using the density, by means of
                         following formula:
                                                                      ρ − ρA
                                                                             
                                                              ρC
                                                        Xρ =     ×              × 100%                         (3)
                                                               ρ     ρC − ρ A
                         where ρ denotes the density of the tested material and the symbols ρC and ρA denotes
                         the density of the 100% crystalline (0.936 g/cm3 ) and amorphous (0.856 g/cm3 ) phases of
                         PP [9].

                         2.5. Measurements of the Melting Behavior
                              The tests of the thermal properties of the PP samples were carried out by differential
                         scanning calorimetry (DSC) using the DSC 214 Polyma apparatus by Netzsch (Selb, Germany).
                         Samples weighing 8–10 mg were heated to 220 ◦ C in a nitrogen atmosphere. After a two-
                         minute exposure at the set temperature, they were cooled to 25 ◦ C. The heating and cooling
                         rates were 10 ◦ C/min. The tests were carried out for three PP samples after 1 h and 504 h
                         from their removal from the injection mold, as well as for the annealed samples. The results
                         of DSC tests were used to determine the degree of crystallinity (XC ):

                                                                       ∆H
                                                              XC =         × 100%                                 (4)
                                                                       ∆HC

                         where ∆H is the measured enthalpy of melting and ∆HC is the melting enthalpy of the
                         100% crystalline PP.

                         2.6. Measurements of the Tensile Properties
                               The mechanical properties were determined by static elongation test using a universal
                         testing machine Z030 Zwick/Roell (Ulm, Germany) equipped with a measuring head of a
                         nominal load of 30 kN. The extension rate during the measurements of elastic modulus was
                         1 mm/min. The next stage of the measurements was carried out at a speed of 50 mm/min
                         until the samples were broken. The tests were performed at 23 ◦ C for 10 samples from each
                         measurement series.

                         2.7. Measurements of Impact Strength
                             The impact strength of polypropylene samples was determined using the HIT 50
                         pendulum impact tester by Zwick/Roell (Ulm, Germany) with a pendulum of 15 J. The
                         samples of a rectangular shape with dimensions of 80 mm × 10 mm × 4 mm, without a
                         notch, were used in the investigations. The impact took place on the shorter edge of the
                         samples. The tests were performed at 23 ◦ C for 10 samples from each measurement series.

                         3. Results
                         3.1. Shrinkage
                               Linear processing shrinkage of the polypropylene test specimens (mold temperature
                         of 80 ◦ C, measurements after 1 h of conditioning) reached the value of 1.51% (Figure 2).
                         This value was higher in comparison to the moldings produced by the mold temperature of
                         20 ◦ C (1.38%), probably due to the different moldings cooling conditions. Slow cooling of a
                         molding favors the crystallization process, which consequently results in higher shrinkage
                         of PP80 samples. After 24 h of conditioning, the mean shrinkage value was 1.44% (PP20)
                         and 1.55% (PP80), which corresponded to the change in the samples length of about
                         0.05 mm and 0.04 mm, respectively. Significant changes in the length of the moldings
                         were recorded up to 168 h after the end of the injection process, however, even after this
                         time, an increase in the shrinkage value of the polypropylene test specimens was noted.
                         In the case of the samples produced by mold with TF equal to 20 ◦ C, the shrinkage value
                         increased from 1.51% (168 h) to 1.56% (504 h), while for the samples produced in the mold
                         temperature of 80 ◦ C during the same time, an increase in this value from 1.59% to 1.63%
                         was observed. After 504 h of conditioning, the difference in value of shrinkage between the
mic for both PP20 and PP80 samples. The trend line equations are presented in Figure 2.
                         The obtained results confirm that the semi-crystalline polymeric products formed at
                         higher mold temperature are characterized by a higher value of primary shrinkage, which
                         took place in the injection mold, as well as in the first hours after sample preparation. In
                         industrial practice, a high value of primary shrinkage of injection moldings is undesirable,
                         however, it can be controlled by the settings of the parameters of the injection process, for
Materials 2021, 14, 22                                                                                                                 6 of 15
                         example by extending the duration of the holding phase. However, the samples produced
                         at a high temperature of the injection mold are characterized by a lower value of second-
                         ary shrinkage, i.e., a change in the dimensions of the samples, determined in this case from
                         24 h of conditioning. The phenomenon of secondary shrinkage is not only undesirable,
                          PP20
                         but  alsoand  PP80 samples
                                   uncontrolled,           wasresult
                                                   which may    0.07 in
                                                                     percentage     points,
                                                                        some difficulties     while afterthe
                                                                                          in maintaining    1 h,  it was
                                                                                                              dimen-          0.13 percentage
                         sional
                          points.accuracy of polypropylene-molded parts during their usage.

                                                                              SECONDARY
                                          1.65                                 SHRINKAGE

                                          1.60
                                                                              y = 0.0283ln(x)+1.3672; R=0.98

                                          1.55
                          Shrinkage [%]

                                          1.50
                                                                              y = 0.0182ln(x)+1.5029; R=0.98

                                          1.45

                                          1.40
                                                                                                                PP 20
                                                                                                                PP 80
                                          1.35            PRIMARY
                                                     SHRINKAGE UNTIL 24 h

                                                 0        100          200         300           400           500      600
                                                                             Time [h]
                         Figure 2. Changes of mold shrinkage values as a function of the conditioning time.
                         Figure 2. Changes of mold shrinkage values as a function of the conditioning time.
                               The results of shrinkage tests of PP samples annealed after 504 h of conditioning have
                                 The
                         indicated     changes
                                    that          in the shrinkage
                                         if the conditioning            value
                                                               process was      depending
                                                                            carried           on the
                                                                                    out at a higher    conditioning
                                                                                                    temperature  or for time
                                                                                                                        a    are logarithmic
                          for both
                         longer       PP20
                                 period       andhigher
                                         of time,   PP80values
                                                            samples.     The shrinkage
                                                                  of recorded trend line    equations
                                                                                          would           are presented
                                                                                                 be observed.  The value in Figure 2. The
                         of  shrinkage results
                          obtained      of the annealed
                                                  confirmsamples,
                                                              that both
                                                                    the PP20   and PP80, was approximately
                                                                         semi-crystalline                      2% (Table formed at higher
                                                                                                polymeric products
                         1).
                          mold temperature are characterized by a higher value of primaryvalues
                             Thus, it may  be stated that the annealing  may  reduce  the difference in shrinkage  shrinkage, which took
                         between the samples processed in different injection conditions. It is worth noting that the
                          place   in  the   injection   mold,    as   well  as  in the  first  hours    after
                         average length of the annealed samples was approximately 164.5 mm and was smaller by
                                                                                                              sample     preparation. In in-
                          dustrial    practice,    a high   value    of primary     shrinkage    of  injection
                         over 3 mm than the length measured at the cavity of the injection mold. The increase inmoldings     is undesirable,
                         however, it can be controlled by the settings of the parameters of the injection process, for
                         example by extending the duration of the holding phase. However, the samples produced
                         at a high temperature of the injection mold are characterized by a lower value of secondary
                         shrinkage, i.e., a change in the dimensions of the samples, determined in this case from
                         24 h of conditioning. The phenomenon of secondary shrinkage is not only undesirable, but
                         also uncontrolled, which may result in some difficulties in maintaining the dimensional
                         accuracy of polypropylene-molded parts during their usage.
                               The results of shrinkage tests of PP samples annealed after 504 h of conditioning have
                         indicated that if the conditioning process was carried out at a higher temperature or for a
                         longer period of time, higher values of recorded shrinkage would be observed. The value of
                         shrinkage of the annealed samples, both PP20 and PP80, was approximately 2% (Table 1).
                         Thus, it may be stated that the annealing may reduce the difference in shrinkage values
                         between the samples processed in different injection conditions. It is worth noting that the
                         average length of the annealed samples was approximately 164.5 mm and was smaller by
                         over 3 mm than the length measured at the cavity of the injection mold. The increase in the
                         shrinkage value of PP samples after annealing results from the changes in the crystalline
                         structure. Relatively significant changes in the shrinkage value after annealing, amounting
                         to 0.44 (PP20) and 0.37 (PP80) percentage points, respectively, may also be the result of
                         removing residual stresses occurring in the material after the injection process. Moreover,
                         it can be concluded that the difference between the shrinkage values of PP20 and PP80
                         samples decrease along with the extension of the conditioning time.
                               The temperature value of the injection mold also influenced other dimensions of the
                         test samples. Using a 3D optical scanner, the deviations from the reference surface were
                         observed, particularly, the difference in the depth of sink marks on the surface of the
line structure. Relatively significant changes in the shrinkage value after annealing,
                         amounting to 0.44 (PP20) and 0.37 (PP80) percentage points, respectively, may also be the
                         result of removing residual stresses occurring in the material after the injection process.
                         Moreover, it can be concluded that the difference between the shrinkage values of PP20
Materials 2021, 14, 22   and PP80 samples decrease along with the extension of the conditioning time.           7 of 15

                         Table 1. Shrinkage values of annealed samples.

                         samples (∆h). Sample
                                         The PP80 samples afterSample      Length (mm)revealed a superior
                                                                  1 h of conditioning              Shrinkage    (%) of sink
                                                                                                            depth
                                    PP20 504h
                         marks compared          A PP20 samples after
                                             to the                   164.54  ± 0.03conditioning time.2.06
                                                                         the same                      This± 0.2
                                                                                                             is confirmed
                         by the blue  areas
                                    PP80     visible
                                          504h   A on the comparison  164.59  ± 0.03
                                                                          of the scanned PP80 sample      ± grid
                                                                                                        dot
                                                                                                     2.03   0.02 with the
                         reference
                                The temperature value of the injection mold also influenced other dimensionsdepth
                                    model   (Figure  3), which was  the scanned   PP20  sample grid. The   mean   of theof
                         sink  mark  in the measuring    section between   the two  samples  was about  0.04 mm.
                          test samples. Using a 3D optical scanner, the deviations from the reference surface were
                         observed, particularly, the difference in the depth of sink marks on the surface of the sam-
                         Table 1. Shrinkage
                          ples (Δh).        values
                                     The PP80      of annealed
                                               samples   after 1samples.
                                                                  h of conditioning revealed a superior depth of sink
                         marks compared
                                   Sample
                                           to the PP20 samples after the same conditioning time.
                                                            Sample Length (mm)
                                                                                                 This is confirmed
                                                                                              Shrinkage (%)
                         by the blue areas visible on the comparison of the scanned PP80 sample dot grid with the
                                 PP20 504h A
                         reference model (Figure 3), which was164.54  ± 0.03 PP20 sample grid. The
                                                                the scanned                      2.06 ± 0.2
                                                                                                     mean depth of
                                 PP80 504h A                   164.59 ± 0.03                   2.03 ± 0.02
                         sink mark in the measuring section between the two samples was about 0.04 mm.

                          Figure 3.
                         Figure  3. Comparison
                                    ComparisonofofthethePP20
                                                         PP20sample
                                                               samplesurface (reference)
                                                                        surface          withwith
                                                                                 (reference)  the PP80 sample
                                                                                                   the PP80   after 1after
                                                                                                            sample    h of 1 h of
                          conditioning; positive deviation (red), negative deviation (blue).
                         conditioning; positive deviation (red), negative deviation (blue).

                                Conditioning of
                               Conditioning      of the
                                                    the PPPP samples
                                                              samples forfor504
                                                                             504h,
                                                                                 h,similar
                                                                                    similartotothe
                                                                                                 thelinear
                                                                                                      linearcontraction,
                                                                                                               contraction,caused
                                                                                                                               caused anan
                          increase   in  the  depth   of  the  sink  marks.   For  the PP20   sample,     the   sink
                         increase in the depth of the sink marks. For the PP20 sample, the sink mark depth increased  mark   depth    in-
                          creased
                         by  0.04 mmby 0.04   mm compared
                                        compared                  to the
                                                      to the PP20-1       PP20-1 hwhile
                                                                        h sample,    sample,   while
                                                                                          for the   PP80forsamples,
                                                                                                             the PP80the samples,
                                                                                                                             changethe was
                          change   was    0.09 mm    (Table   2). In this case, the  reference  sample     was
                         0.09 mm (Table 2). In this case, the reference sample was PP80-1 h. The consequence of   PP80-1   h. The   con-
                          sequence
                         heating   theoftest
                                          heating  the was
                                             samples     test samples    was an
                                                               an additional      additional
                                                                               increase  in theincrease
                                                                                                  depth of in the
                                                                                                               the sink
                                                                                                                    depth   of theonsink
                                                                                                                         marks        their
                          marks   on  their  surface.  The   values   of Δh in this case reached    the  values
                         surface. The values of ∆h in this case reached the values of 0.07 mm (PP20) and 0.014     of 0.07 mm    (PP20)mm
                          and 0.014
                         (PP80).      mm (PP80).
                                   Moreover,     as aMoreover,
                                                       result of as    a result of conditioning,
                                                                    conditioning,    the differencethein difference
                                                                                                            the depth  in of
                                                                                                                          thesink
                                                                                                                              depth    of
                                                                                                                                   marks
                          sink marks increased between the PP20 and PP80 samples (Figure 4). The mean value of
                         increased between the PP20 and PP80 samples (Figure 4). The mean value of ∆h in this
                          Δh in this case was approximately 0.08 mm. The results of the study of the PP moldings
                         case was approximately 0.08 mm. The results of the study of the PP moldings shrinkage
                          shrinkage carried out with the use of 3D optical scanner indicate that the optical method
                         carried out with the use of 3D optical scanner indicate that the optical method can be used
                         to evaluate even slight changes in the dimensions of injection moldings resulting from
                         secondary shrinkage and annealing.

                         Table 2. Changes in depth of sink marks in the measurement section of conditioned PP samples.

                                                                                               ∆h (mm)
                              Conditioning Time (h)
                                                                               PP20                                  PP80
                                           1                                Reference                             Reference
                                          504                             0.040 ± 0.005                         0.090 ± 0.008
                                         504A                             0.070 ± 0.010                         0.140 ± 0.009
Table 2. Changes in depth of sink marks in the measurement section of conditioned PP samples.

                                                                                                            Δh (mm)
                                    Conditioning Time (h)
                                                                                           PP20                                PP80
Materials 2021, 14, 22
                                                  1                                     Reference                           Reference 8 of 15
                                                 504                                   0.040 ± 0.005                       0.090 ± 0.008
                                                504A                                   0.070 ± 0.010                       0.140 ± 0.009

                          Figure4.4. Comparison
                         Figure      Comparison of
                                                of the
                                                   the PP20
                                                       PP20 sample
                                                             sample surface
                                                                     surface (reference)
                                                                              (reference)with
                                                                                         withthe
                                                                                              thePP80
                                                                                                  PP80sample
                                                                                                        sampleafter
                                                                                                               after504
                                                                                                                     504h hofof
                          conditioningand
                         conditioning   andannealing;
                                            annealing;positive
                                                       positivedeviation
                                                                deviation(red),
                                                                          (red),negative
                                                                                 negativedeviation
                                                                                          deviation(blue).
                                                                                                    (blue).

                         3.2.
                          3.2.Crystalline
                               CrystallineStructure
                                               Structure
                               The
                                The changesofofshrinkage
                                     changes           shrinkagevalues
                                                                     values ofof  the polypropylene
                                                                                    the  polypropylene   samples
                                                                                                             samplesareare
                                                                                                                         alsoalso
                                                                                                                               accompanied
                                                                                                                                    accompanied    by
                         variation
                          by variationin thein material
                                                the materialdensity   (Table
                                                                  density        3). The
                                                                             (Table     3).density   of theofsamples
                                                                                            The density                  determined
                                                                                                               the samples                1 h after
                                                                                                                                 determined        1h
                         removal     of the moldings         from the    mold       was   0.895 g/cm   3                                  3
                          after removal        of the moldings         from     the   mold    was   0.895(PP20)
                                                                                                            g/cm3and      0.899and
                                                                                                                     (PP20)       g/cm 0.899(PP80),
                                                                                                                                                g/cm3
                         respectively.    After 504 After
                          (PP80), respectively.          h of conditioning        at 23 ◦ C, the
                                                                504 h of conditioning          atdensity   of the
                                                                                                  23 °C, the        samples
                                                                                                                density        produced
                                                                                                                           of the    samples   in pro-
                                                                                                                                                  the
                         mold           ◦                                     3                                                                     3
                          duced in the mold at 20 °C increased to 0.902 g/cm , while for the PP80 samples, it grew,
                                at  20    C  increased     to 0.902   g/cm      ,  while  for the PP80
                                                                                                  3       samples,    it grew    to  0.904   g/cm
                         constituting
                          to 0.904 g/cman       increase of approximately
                                            3, constituting                             0.8% and 0.5%,
                                                                an increase of approximately                respectively.
                                                                                                         0.8%                  Although these
                                                                                                                and 0.5%, respectively.           Alt-
                         changes
                          hough these changes are not very high, it may confirm the occurrence ofcrystallization
                                     are  not   very    high,  it may    confirm      the  occurrence     of the  secondary        the secondary
                         during    their conditioning.
                          crystallization      during theirThe        degree of crystallinity
                                                                  conditioning.       The degree of  determined
                                                                                                         crystallinityby determined
                                                                                                                           density (Xρ )by    of den-
                                                                                                                                                  the
                         PP20   samples      increased     by  8.1%   during       504  h of conditioning.     In the
                          sity (Xρ) of the PP20 samples increased by 8.1% during 504 h of conditioning. In the case     case  of  PP80    samples,
                         an
                          of increase    in Xρ by
                             PP80 samples,        an6.1%      wasin
                                                       increase     noted.
                                                                       Xρ byA6.1%  pronounced
                                                                                        was noted.increase    in the density
                                                                                                      A pronounced                wasin
                                                                                                                           increase      observed
                                                                                                                                            the den-
                         after the  annealing      of  the  samples,    where       both  PP20  and  PP80    samples
                          sity was observed after the annealing of the samples, where both PP20 and PP80 samples         had  the   same    density,
                         equal  to  0.911    g/cm   3 , related to an increase in the degree of crystallinity to 70.6%. The same
                          had the same density, equal to 0.911 g/cm , related to an increase in the degree of crystal-
                                                                                      3
                         value
                          linityof
                                 tothe    degree
                                      70.6%.     Theofsame
                                                         crystallinity
                                                               value of  of the
                                                                            the degree
                                                                                    annealed ofPP20   and PP80
                                                                                                crystallinity    ofsamples      justifies
                                                                                                                     the annealed        PP20similar
                                                                                                                                                  and
                         results  of   the   processing      shrinkage     determined         for the  annealed
                          PP80 samples justifies similar results of the processing shrinkage determined for the an-  samples.       The   increase
                         in PP density
                          nealed   samples.  during     conditioning
                                                 The increase       in PPisdensity
                                                                             the effect     of the
                                                                                        during      crystalline structure
                                                                                                 conditioning      is the effectordering      of the
                                                                                                                                    of the crystal-
                         material, which was also confirmed by Dudić in the studies of accelerated aging of PP
                          line structure ordering of the material, which was also confirmed by Dudić in the studies
                         samples obtained by compression molding [9]. The course of secondary crystallization was
                          of accelerated aging of PP samples obtained by compression molding [9]. The course of
                         possible because PP samples were stored at a higher temperature than the glass transition
                         temperature of this polymer.
                               The structural changes taking place in the polymer are also confirmed by the results of
                         calorimetric measurements. Figure 5a,b show the DSC melting curves recorded during the
                         heating of PP samples conditioned for 1 h, 504 h and samples after annealing. The course
                         of the DSC melting curves indicates that PP in moldings is characterized by a α-type
                         crystal structure [31], with the values of the melting point in the range of 167 ◦ C to 171 ◦ C.
                         Therefore, for the evaluation of the crystallinity of the samples, the value of 148 J/g was
                         adopted as the enthalpy of melting α-PP with a 100% degree of crystallinity [35]. The value
                         of melting enthalpy of PP20 samples increased from 91.39 J/g (after 1 h of conditioning)
                         to 94.58 J/g (504 h of conditioning). The increase in the value of the melting enthalpy
                         indicates an increase in the mass fraction of the crystalline phase in the structure. During the
Materials 2021, 14, 22                                                                                                                                                            9 of 15

                                         conditioning of the samples at a higher temperature than the glass transition temperature,
                                         the amorphous phase slowly transformed into the crystalline phase, which resulted in an
                                         increase in the degree of crystallinity by 2.2%. In the case of the PP80 samples, after the
                                         same period of time, an increase in the degree of crystallinity by 0.9% was observed. The
                                         annealing of the conditioned samples resulted in a further increase in the sample’s melting
                                         enthalpy, which corresponded to an increase in the degree of crystallinity to the values
                                         of 73.6% (PP20) and 76.2% (PP80), respectively. The observed values of melting enthalpy
                                         are slightly higher than the values determined by Dudić [8] for annealed samples that
                                         were not conditioned before. Moreover, the recorded course of the DSC melting curves of
                                         the annealed PP samples may indicate that not only quantitative changes (increase in the
                                         degree of crystallinity) but also morphological changes occurred in the crystalline structure
                                         of the material. It may be assumed that the observed total energy effect of melting of the
                                         annealed PP20 and PP80 samples consists of at least two overlapping transformations. This
                                         is indicated, inter alia, by the inflection of the melting curves at a temperature of about
                                         163 ◦ C.

                                         Table 3. Physical properties of PP samples in the function of conditioning time.

                                               Conditioning                          Mold                                    Density                             Melting Enthalpy
                                                                                                                                                   X ρ (%)                          XC (%)
                                                 Time (h)                        Temperature (◦ C)                           (g/cm3 )                                  (J/g)
                                                                                            20                  0.895 ± 0.003                        51.0          91.39 ± 1.13      61.7
                                                                     1
                                                                                            80                  0.899 ± 0.002                        56.0          95.66 ± 0.97      64.6
                                                                                            20                  0.902 ± 0.003                        59.1          94.58 ± 0.95      63.9
                                                                   504
Materials 2021, 14, x FOR PEER REVIEW                                                       80                  0.904 ± 0.003                        62.1              10 ±
                                                                                                                                                                   96.83  of 1.25
                                                                                                                                                                              17     65.5
                                                                                            20                  0.911 ± 0.002                        70.6          109.0 ± 1.21      73.6
                                                               504A
                                                                                            80                  0.911 ± 0.002                        70.6          112.8 ± 1.04      76.2

                                                                                                   (a)                                                             (b)
                                                                   egzo

                                                                                                                                  egzo
                                          Heat flow [mW/mg]

                                                                                                         Heat flow [mW/mg]

                                                                          PP20 1h                                                        PP80 1h
                                                                          PP20 504h                                                      PP80 504h
                                                                          PP20 504h A                                                    PP80 504h A

                                                              50          100         150        200                         50           100          150        200
                                                                                            o                                                                o
                                                                          Temperature [ C]                                               Temperature [ C]

                                 Figure 5.Figure 5. DSC
                                           DSC melting   melting
                                                       curves     curves of conditioned
                                                              of conditioned and annealedand  annealed
                                                                                          PP samples;   PP (a),
                                                                                                      PP20  samples;  PP20 (a), PP80 (b).
                                                                                                                PP80 (b).

                                         3.3. Mechanical Properties
                                 3.3. Mechanical Properties
                                                The changes
                                      The changes    in the PP in  the PP resulting
                                                                structure,  structure, in resulting  in post-molding
                                                                                          post-molding                     shrinkage,
                                                                                                         shrinkage, influence      also influence also
                                 the changes in the mechanical properties. Slow cooling of the polypropylene in the injec- in the injection
                                         the  changes    in the mechanical     properties.   Slow  cooling   of the   polypropylene
                                         mold    at temperature
                                                    the temperature      of 80  ◦ C resulted in an elastic modulus value equal to 1290 MPa
                                 tion mold  at the                 of 80 °C  resulted  in an elastic modulus value equal to 1290
                                         after
                                 MPa after  1 h1ofh conditioning
                                                    of conditioning     (Figure
                                                                   (Figure        6a). value
                                                                            6a). This  This value   is about
                                                                                             is about         10% higher
                                                                                                       10% higher    than in than   in the case of PP20
                                                                                                                              the case
                                 of PP20samples
                                          samples (1160
                                                     (1160 MPa).    PP20 and
                                                            MPa). PP20    andPP80
                                                                                PP80samples
                                                                                       samplestested
                                                                                                 testedafter
                                                                                                         after2424h hand
                                                                                                                       and168
                                                                                                                            168h hwere
                                                                                                                                    were characterized
                                 characterized   by a higher
                                         by a higher      valuevalue  of Young’s
                                                                 of Young’s         modulusby
                                                                                modulus       byapproximately
                                                                                                  approximately 5%    5%and
                                                                                                                          and15%,
                                                                                                                                15%,re- respectively, in
                                 spectively,  in comparison
                                         comparison       withwith   the values
                                                                the values         determined
                                                                              determined     1 h1 after
                                                                                                  h after removingthe
                                                                                                        removing        themoldings
                                                                                                                            moldings from the mold.
                                 from the mold. The results of the tests, which were carried out after 504 h of conditioning,
                                 showed that the E value is still not stabilized. The modulus of elasticity in this case reached
                                 the values of 1440 MPa (PP20) and 1580 MPa (PP80), respectively. It should be noted that
                                 after 504 h, PP80 samples still have an E value higher than 10%.
Materials 2021, 14, 22                                                                                                                                                                         10 of 15

                                        The
                 Materials 2021, 14, x FOR   results
                                           PEER      of the
                                                REVIEW  tests, which were carried out after 504 h of conditioning, showed that the 11                                                                     of 17
                                     E value is still not stabilized. The modulus of elasticity in this case reached the values of
                                     1440 MPa (PP20) and 1580 MPa (PP80), respectively. It should be noted that after 504 h,
                                     PP80 samples still have an E value higher than 10%.

                                                             1700
                                                                                                                                              37
                                                                    (a)                                                                            (b)
                                                             1600
                                                                                                                                              36
                                                                             y = 45.978ln(x)+1244.6; R=0.90
                                                                                                                                                             y = 0.3474ln(x)+34.304; R=0.99
                                      Youn's modulus [MPa]

                                                                                                                     Tensile strength [MPa]
                                                             1500                                                                             35

                                                                             y = 42.636ln(x)+1120.6; R=0.91
                                                                                                                                              34
                                                             1400

                                                                                                                                              33
                                                                                                                                                               y = 0.4304ln(x)+31.04; R=0.95
                                                             1300
                                                                                                                                              32

                                                             1200
                                                                                                              PP20                            31                                    PP20
                                                                                                              PP80                                                                  PP80
                                                             1100                                                                             30
                                                                    0     100 200 300 400 500 600                                                  0   100 200 300 400 500 600

                                                                          Condtioning time [h]                                                         Conditioning time [h]

                                     Figure 6. Changes of the E modulus (a) and tensile strength (b) of PP samples in the function of
                          Figure 6. Changes of the E modulus (a) and tensile strength (b) of PP samples in the function of conditioning time.
                                     conditioning time.
                                                        Similar trends were observed in the case of changes in the tensile strength values (6b).
                                          Similar trends were observed in the case of changes in the tensile strength values (6b).
                                                  After 1 h of conditioning, Rm of PP80 samples was equal to 34.3 MPa, being 10% higher in
                                     After 1 h of conditioning, Rm of PP80 samples was equal to 34.3 MPa, being 10% higher in
                                                  comparison with PP20 samples. The most significant changes in the tensile strength values
                                     comparison with PP20 samples. The most significant changes in the tensile strength values
                                                  were observed up to 48 h of conditioning. After 168 h of conditioning, the increase in Rm
                                     were observed up to 48 h of conditioning. After 168 h of conditioning, the increase in Rm
                                                  value in comparison with the tensile strength after 1 h of conditioning was 7% (33.3 MPa)
                                     value in comparison with the tensile strength after 1 h of conditioning was 7% (33.3 MPa)
                                                  for PP20 and 5% (36.1 MPa) for PP80, respectively. These relative changes in values were
                                     for PP20 and     5% (36.1 MPa)
                                                  significantly         forthan
                                                                   smaller   PP80,  respectively.
                                                                                  those recorded for These    relative changes
                                                                                                         the modulus                in values
                                                                                                                         of elasticity.        wereas in the
                                                                                                                                         However,
                                     significantlycase
                                                     smaller   than  those   recorded   for the  modulus      of elasticity.  However,
                                                        of the modulus of elasticity, a further increase in maximum stress was recorded    as in the after
                                     case of the modulus       of elasticity, Moreover,
                                                  504 h of conditioning.      a further increase    in maximum
                                                                                           the observed     increase stress    wasstrength
                                                                                                                       in tensile    recorded   after condi-
                                                                                                                                              during
                                     504 h of conditioning.     Moreover,   the  observed   increase   in tensile  strength   during   conditioning
                                                  tioning was significantly smaller in comparison with the values determined by Yue for PP
                                     was significantly
                                                  samplessmaller    in comparison
                                                             obtained    by compressionwith the  values[29].
                                                                                             molding       determined     by Yue
                                                                                                               The increase         for PP
                                                                                                                                in the     samples
                                                                                                                                        values  of elasticity
                                     obtained bymodulus
                                                    compression       molding    [29].  The  increase    in the  values    of elasticity  modulus
                                                              and tensile strength is related to the increase in the content of the crystalline
                                     and tensilephase
                                                   strength
                                                          in theis material
                                                                   related to   the increase
                                                                             structure,  whichinis the   content ofbythe
                                                                                                   characterized             crystalline
                                                                                                                         greater           phase
                                                                                                                                   stiffness       in
                                                                                                                                             in comparison
                                     the material    structure,    which   is characterized     by  greater    stiffness   in comparison
                                                  to the amorphous phase. Changes in the mechanical properties of PP samples during con-      to the
                                     amorphousditioning
                                                   phase. Changes
                                                               indicateinthe
                                                                          theneed
                                                                               mechanical    properties
                                                                                    to conduct             of PP samples
                                                                                                  comparative      tests of during
                                                                                                                             injectionconditioning
                                                                                                                                         moldings made of
                                     indicate thethis
                                                    need  to  conduct   comparative      tests of injection   moldings
                                                        material within a defined time after the end of the manufacturing   made   of thisprocess.
                                                                                                                                           materialThis ap-
                                     within a defined
                                                  plies totime
                                                            study after
                                                                    andthe   end of the works
                                                                         development      manufacturing
                                                                                                  as well as process.      This applies
                                                                                                               research related            to study
                                                                                                                                    to quality  control. The
                                     and development
                                                  changesworks
                                                             in theas   well as
                                                                     tensile     research
                                                                              strength      related
                                                                                        values        to quality
                                                                                                 of PP20           control.
                                                                                                            and PP80          The at
                                                                                                                        samples     changes   in the
                                                                                                                                       individual   stages of
                                     tensile strength   values ofare
                                                  conditioning       PP20   and in
                                                                        visible  PP80   samples
                                                                                    Figure   7a,b, at  individual
                                                                                                    which    presentsstages
                                                                                                                         the of  conditioning
                                                                                                                              stress–strain       are of the
                                                                                                                                              curves
                                     visible in Figure
                                                  tested7a,b,    which presents the stress–strain curves of the tested samples.
                                                          samples.
                                          Moreover, on the basis of the analysis of the stress–strain relationship, it can be
                                     concluded that PP80 samples are characterized by significantly lower values of elongation
                                     at break (εb ) in comparison with the PP20 samples. The value of the elongation at break of
                                     PP samples after 1 h of conditioning reached the value of 176% (PP20) and 60.5% (PP80),
                                     respectively, as shown in Figure 8a. This difference results from the lower content of the
                                     amorphous phase in the samples slowly cooled in the injection mold, which is characterized
                                     by a greater elasticity compared to the crystalline phase. As a result of the secondary
Materials 2021, 14, 22                                                                                                                                11 of 15

                                        crystallization taking place during the conditioning, the value of εb gradually decreased
                                        and after 504 h from removing the moldings from the injection mold, it reached the value
                                        of 67.6% for PP20 and 16.9% for the samples injected into the mold at a temperature of
                                        80 ◦ C. Changes in the values of strain at break indicate an increase in brittleness of PP
                                        samples with the passage of their conditioning time. This is also confirmed by the values
                                        of the energy that were absorbed until their destruction during static tension (Figure 7a,b).
                                        For PP20 samples, the absorbed energy value decreased from approximately 183 J for
                                        the sample tested 1 h after injection to 94 J after 504 h of conditioning. The brittleness
                                        of the samples produced at the higher temperature of the injection mold was increased
                                        significantly. Immediately, after 1 h of conditioning, the registered value of absorbed energy
                                        was 66 J. After 504 h of conditioning; this value dropped to about 23 J and was comparable
                                        to the value determined for the PP20 sample after annealing.
                                             Similar changes were observed for the Charpy impact strength up to 168 h of con-
                                        ditioning (Figure 8b). PP20 sample was not damaged after 1 h of conditioning, and the
                                        impact strength value after 24 h was equal to 130 kJ/m2 . After 168 h of conditioning, the
                                        impact strength was 20% lower and reached the value of 104 kJ/m2 ; further conditioning
                                        increased the impact strength to 115 kJ/m2 . A similar trend was observed for PP80 samples.
                                        However, the impact strength 1 h after conditioning was 69.6 kJ/m2 . This value was
                                        significantly lower in comparison with all PP20 samples tested at different conditioning
                                        stages. After 168 h, the determined value of impact strength for PP80 was 47.4 kJ/m2 and
                                        increased to 53.0 kJ/m2 after the next 336 h. The observed increase in impact strength is
                                        probably caused by the changes in the morphology of the PP crystalline structure.
                                             Based on the analysis of the test results, the relationship between the changes in the
                                        value of Young’s modulus (Figure 9a), strain at break (Figure 9b) and the changes in the
                                        shrinkage value for PP samples produced in the injection mold at 20 ◦ C and 80 ◦ C was
                                        determined. The value of Young’s modulus increases linearly with the increase of the
Materials 2021, 14, x FOR PEER REVIEW   shrinkage value, while the relationship between strain at break and shrinkage  12 of is
                                                                                                                             17 inversely

                                        proportional, i.e., as the shrinkage value increases, the strain value decreases. Thus, it can
                                        be concluded that non-destructive shrinkage tests may serve as the basis for estimating the
                                        mechanical properties of polypropylene moldings.

                                                       35                                 (a)                   35                                 (b)
                                                                        PP20 1h                                                  PP80 1h
                                                                        PP20 24h                                                 PP80 24h
                                                       30               PP20 540h
                                                                                                                30               PP80 504h
                                                                        PP20 540h A                                              PP80 504h A

                                                       25                                                       25
                                        Stress [MPa]

                                                                                                 Stress [MPa]

                                                       20                                                       20

                                                       15                                                       15

                                                       10                                                       10
                                                                       ENERGY ABSORPTION                                        ENERGY ABSORPTION

                                                                       1h - 182.7 J                                             1h - 66.16 J
                                                       5               24h - 151.8 J                            5               24h - 42.35 J
                                                                       504h - 94.05 J                                           504h - 23.47 J
                                                                       504hA - 27.63 J                                          504hA - 36.47 J

                                                       0                                                        0
                                                            0   50      100         150    200                       0   50      100         150    200
                                                                     Strain [%]                                               Strain [%]

                                      Figure 7. Selected stress-strain curves of conditioned and annealed PP samples; PP20 (a) and PP80
                                 Figure 7. Selected stress-strain curves of conditioned and annealed PP samples; PP20 (a) and PP80
                                      (b).
                                 (b).

                                     Moreover, on the basis of the analysis of the stress–strain relationship, it can be con-
                                 cluded that PP80 samples are characterized by significantly lower values of elongation at
                                 break (εb) in comparison with the PP20 samples. The value of the elongation at break of
                                 PP samples after 1 h of conditioning reached the value of 176% (PP20) and 60.5% (PP80),
Materials 2021, 14, x FOR PEER REVIEW                                                                                                                                                                 13 of 17

                                 increased to 53.0 kJ/m2 after the next 336 h. The observed increase in impact strength is
  Materials 2021, 14, 22         probably caused by the changes in the morphology of the PP crystalline structure.         12 of 15

                                                                  250
                                                                          (a)                              PP20                                                        (b)                     PP20
                                                                                                                                                      140
                                                                                                           PP80                                                                                PP80
                                                                  200

                                                                                                                     Charpy impact strength [kJ/m ]
                                                                                                                                                      120

                                                                                                                     2
                                         Elongation at brak [%]   150
                                                                                                                                                      100

                                                                                      y=-18.56ln(x)+187.74; R=0.94
                                                                  100
                                                                                                                                                             80

                                                                  50
                                                                                                                                                             60

                                                                   0                                                                                         40
                                                                                      y=-7.701ln(x)+59.75; R=0.95

                                                     0 100 200 300 400 500 600                                                                                         0     100 200 300 400 500 600
                   Materials 2021, 14, x FOR PEER REVIEW                                                                                                                                                         14 of 17
                                                                                Conditioning time [h]                                                                        Conditioning time [h]

                                     Figure 8. Elongation at break (a) and Charpy impact strength (b) of PP samples in the function of
                                 Figure 8. Elongation
                                     conditioning     at break (a) and Charpy impact strength (b) of PP samples in the function of
                                                   time.
                                 conditioning time.
                                                                                                                                                                 250
                                      Based on the analysis of thePP20
                                                                     test results, the relationship between the changes in the
                                          1600
                                 value of Young’samodulus (Figure   PP80
                                                                                               b
                                                                       9a), strain at break (Figure  9b)y=-667.29x+1102.2;
                                                                                                    PP20 and the changes   R=0.98 in the
                                 shrinkage value for PP samples produced in the200      injection mold at 20 °C and 80 °C was
                                 determined. The value of Young’s modulus increases linearlyPP80          y=-403.4x+664.6; R=0.93
                                                                                                       with     the increase of the
                                          1500
                                 shrinkage value, while the relationship between strain at break and shrinkage is inversely
                                         Young's modulus [MPa]

                                                                                                                                        Elongation at brak [%]

                                 proportional, i.e., as the shrinkage value increases, the strain value decreases. Thus, it can
                                                                                       150
                                 be concluded that non-destructive shrinkage tests may serve as the basis for estimating
                                          1400
                                 the mechanical properties of polypropylene moldings.

                                                                                                                                                                 100
                                                                  1300

                                                                                                                                                                 50
                                                                  1200
                                                                                     PP20 y=1615.1x-1097.3; R=0.97

                                                                                                                                                                                 PP20
                                                                  1100               PP80 y=2602.1x-2670.9; R=0.95                                                0
                                                                                                                                                                                 PP80

                                                                        1.35 1.40 1.45 1.50 1.55 1.60 1.65                                                         1.35 1.40 1.45 1.50 1.55 1.60 1.65
                                                                                    Shrinkage [%]                                                                                 Shrinkage [%]

                                        Figure 9. Correlation between young’s modulus (a), elongation (b) at break and shrinkage.
                                         Figure 9. Correlation between young’s modulus (a), elongation (b) at break and shrinkage.
                                             Annealing of the conditioned PP20 and PP80 samples for 24 h at 140 ◦ C resulted in an
                                                           Annealing
                                        increase in the value          of the conditioned
                                                               of the modulus                PP20
                                                                                 of elasticity    and4).
                                                                                               (Table  PP80   samplesthe
                                                                                                         Moreover,      fordifference
                                                                                                                             24 h at 140 °C resulted in
                                                                                                                                       between
                                                     an  increase in the  value  of the modulus    of elasticity (Table  4). Moreover,
                                        E values of the samples processed under different conditions decreased. The determined           the difference
                                        values were equal to 1650 MPa (PP20) and 1710 MPa (PP80), respectively. The annealed PP20 The de-
                                                     between   E values  of the samples   processed   under  different conditions   decreased.
                                                     termined values were equal to 1650 MPa (PP20) and 1710 MPa (PP80), respectively. The
                                        and PP80 samples      were also characterized by similar values of tensile strength (35 MPa)
                                                     annealed PP20 and PP80 samples were also characterized by similar values of tensile
                                        and elongation at break (20%). However, in the case of PP20 samples, annealing resulted in
                                                     strength (35 MPa) and elongation at break (20%). However, in the case of PP20 samples,
                                        an increase in the maximum stress, while for PP80, its decrease was recorded. The similar
                                                     annealing resulted in an increase in the maximum stress, while for PP80, its decrease was
                                        values of mechanical properties determined during the static tensile test of two series of
                                                     recorded. The similar values of mechanical properties determined during the static tensile
                                        samples are convergent with the results of shrinkage and the degree of crystallinity tests.
                                                     test of two series of samples are convergent with the results of shrinkage and the degree
                                                     of crystallinity tests. Moreover, annealing resulted in a significant increase in the impact
                                                     strength of the samples in comparison with the values recorded after 504 h of condition-
                                                     ing. In the case of PP20, the determined value was equal to 220 kJ/m2, while for PP80, it
                                                     was 90.8 kJ/m2. The Charpy impact strength values confirm the upward tendency of this
Materials 2021, 14, 22                                                                                           13 of 15

                         Moreover, annealing resulted in a significant increase in the impact strength of the samples
                         in comparison with the values recorded after 504 h of conditioning. In the case of PP20, the
                         determined value was equal to 220 kJ/m2 , while for PP80, it was 90.8 kJ/m2 . The Charpy
                         impact strength values confirm the upward tendency of this parameter value observed
                         for the samples conditioned for 504 h. The observed increase in the impact strength of
                         PP samples after annealing is caused by the changes in the morphology of the material’s
                         crystalline structure, which are difficult to be clearly assessed on the basis of the conducted
                         tests results obtained with the use of the differential scanning calorimetry method. Changes
                         in the morphology of the crystalline structure may, for example, involve the transition
                         of the α-PP phase to the β-PP phase, which is characterized by a higher impact strength
                         value [13,15].

                         Table 4. Mechanical properties of PP conditioned samples after annealing.

                              Mold                Young’s              Tensile         Elongation at   Impact Strength
                          Temperature (◦ C)     Modulus (MPa)      Strength (MPa)        Break (%)        (kJ/m2 )
                                  20               1650 ± 30          34.8 ± 0.15        22.1 ± 2.6      220.1 ± 4.9
                                  80               1710 ± 16          34.9 ± 0.25        21.4 ± 4.7      90.8 ± 17.4

                         4. Conclusions
                               It has been confirmed that the post-molding time significantly affects the shrinkage
                         and mechanical properties of the isotactic polypropylene molded parts obtained at a
                         temperature of 20 ◦ C and 80 ◦ C of the injection mold. Namely, the tensile strength and
                         Young’s modulus increased, the value of both parameters being the higher the longer the
                         post-molding time was determined. This may be clearly observed in the case of the changes
                         in Young’s modulus. For both types of samples, the modulus of elasticity increased by
                         about 5% and 20% after 24 h and 504 h of conditioning, respectively, in comparison to the
                         value determined for the samples after 1 h of conditioning. At the same time, the elongation
                         at break and the impact strength have been reduced. The exception is the observed impact
                         strength value increase for the samples conditioned during 504 h, as well as after annealing
                         of all PP molded parts. Moreover, a clear difference between the impact strength values of
                         the annealed PP20 and PP80 samples was observed. It should be emphasized that these
                         values were higher than those recorded immediately after the samples were made. It was
                         found that the temperature of the mold cavity, the conditioning time and the final annealing
                         process caused significant changes in the structure of PP molded parts, which resulted in
                         an increase in shrinkage and significant changes in mechanical properties. PP samples
                         produced in the mold cavities at a temperature of 80 ◦ C were characterized by a higher
                         value of shrinkage, degree of crystallinity, Young’s modulus and tensile strength compared
                         to PP20 samples of the same mass and thickness. Finally, it may be concluded that the
                         processing conditions, in this case the mold temperature, as well as the post-processing
                         ageing of the isotactic polypropylene, may significantly modify the structure and properties
                         of the PP products, which should be considered by the processing industry.

                         5. Future Works
                              The increase in impact strength observed in these studies for the PP molded pieces
                         conditioned for a long time, as well as its further growth after final annealing, should be
                         an inspiration for further research. It would be advisable to consider making attempts to
                         determine the influence of the parameters of the injection molding process, in particular the
                         temperature of the mold cavity, on the changes in the structure of PP molded parts of various
                         thicknesses. Further work should be focused on explaining whether morphological changes
                         are responsible for the increase in impact strength of PP samples a long time after their
                         manufacturing and/or after annealing. For this purpose, it would be necessary to use X-ray
                         tests and repeat the DSC tests under very slow heating conditions. The obtained results
                         may be very important for the production of PP molded pieces in industrial conditions,
                         especially for the products thicker than 2.5 mm.
Materials 2021, 14, 22                                                                                                            14 of 15

                                  Author Contributions: A.K.: methodology, investigation, writing; D.M.: investigation, visualization;
                                  D.S.: formal analysis, supervision. All authors have read and agreed to the published version of the
                                  manuscript.
                                  Funding: This research received no external funding.
                                  Data Availability Statement: The data presented in this study are available on request from the
                                  corresponding author.
                                  Conflicts of Interest: The authors declare no conflict of interest.

References
1.    Baur, E.; Osswald, T.A.; Rudolph, N. Plastics Handbook; Hanser Publications: Munich, Germany, 2019; pp. 61–69.
2.    Azaman, M.; Sapuan, S.; Sulaiman, S.; Zainudin, E.; Khalina, A. Shrinkages and warpage in the processability of wood-filled
      polypropylene composite thin-walled parts formed by injection molding. Mater. Des. 2013, 52, 1018–1026. [CrossRef]
3.    Heidari, B.S.; Moghaddam, A.H.; Davachi, S.M.; Khamani, S.; Alihosseini, A. Optimization of process parameters in plastic
      injection molding for minimizing the volumetric shrinkage and warpage using radial basis function (RBF) coupled with the
      k-fold cross validation technique. J. Polym. Eng. 2019, 39, 481–492. [CrossRef]
4.    Bensingh, R.J.; Boopathy, S.R.; Jebaraj, C. Minimization of variation in volumetric shrinkage and deflection on injection molding
      of Bi-aspheric lens using numerical simulation. J. Mech. Sci. Technol. 2016, 30, 5143–5152. [CrossRef]
5.    Zawistowski, H.; Zi˛eba, S. Ustawianie Procesu Wtryskiwania Tworzyw Termoplastycznych; Wydawnictwo Poradników i Ksia˛żek
      Technicznych: Warsaw, Poland, 2015; pp. 33–36.
6.    Kowalska, B. Injection molding contraction and p-v-T relation. Polimery 2007, 52, 280–285. [CrossRef]
7.    Rojo, E.; Fernández, M.; Muñoz, M.E.; Santamaria, A. Relation between PVT measurements and linear viscosity in isotactic and
      syndiotactic polypropylenes. Polymer 2006, 47, 7853–7858. [CrossRef]
8.    Kowalska, B. Study on crystallization of polymers during the injection molding. Polimery 2007, 52, 83–87. [CrossRef]
9.    Dudić, D.; Djoković, V.; Kostoski, D. The high temperature secondary crystallisation of aged isotactic polypropylene. Polym. Test.
      2004, 23, 621–627. [CrossRef]
10.   Barczewski, M.; Dudziec, B.; Dobrzyńska-Mizera, M.; Sterzynski, T. Synthesis and Influence of Sodium Benzoate Silsesquioxane
      Based Nucleating Agent on Thermal and Mechanical Properties of Isotactic Polypropylene. J. Macromol. Sci. Part A 2014, 51,
      907–913. [CrossRef]
11.   Sterzyński, T.; Øysaed, H.; Øysæd, H. Structure modification of isotactic polypropylene by bi-component nucleating systems.
      Polym. Eng. Sci. 2004, 44, 352–361. [CrossRef]
12.   Sterzyński, T.; Lambla, M.; Georgi, F.; Thomas, M. Studies of the Trans-Quinacridone Nucleation of Poly-(ethylene-b-propylene).
      Int. Polym. Process. 1997, 12, 64–71. [CrossRef]
13.   Garbarczyk, J.; Paukszta, D. Influence of additives on the structure and properties of polymers. Colloid Polym. Sci. 1985, 263,
      985–990. [CrossRef]
14.   Paukszta, D.; Garbarczyk, J. Crystallisation of isotactic polypropylene with β-nucleating agents under elevated pressure. Fibres
      Text. East. Eur. 2003, 11, 50–53.
15.   Nakamura, K.; Shimizu, S.; Umemoto, S.; Thierry, A.; Lotz, B.; Okui, N. Temperature Dependence of Crystal Growth Rate for α
      and β Forms of Isotactic Polypropylene. Polym. J. 2008, 40, 915–922. [CrossRef]
16.   Kosciuszko, A.; Czyzewski, P.; Wajer, Ł.; Osciak, A.; Bielinski, M. Properties of polypropylene composites filled with microsilica
      waste. Polimery 2020, 65, 99–104. [CrossRef]
17.   Ryu, Y.; Sohn, J.S.; Kweon, B.C.; Cha, S.W. Shrinkage Optimization in Talc- and Glass-Fiber-Reinforced Polypropylene Composites.
      Materials 2019, 12, 764. [CrossRef]
18.   Mulle, M.; Wafai, H.; Yudhanto, A.; Lubineau, G.; Yaldiz, R.; Schijve, W.; Verghese, N. Influence of process-induced shrinkage and
      annealing on the thermomechanical behavior of glass fiber-reinforced polypropylene. Compos. Sci. Technol. 2019, 170, 183–189.
      [CrossRef]
19.   Palutkiewicz, P.; Garbacz, T. The Influence of Blowing Agent Addition, Glass Fiber Filler Content and Mold Temperature on
      Selected Properties, Surface State and Structure of Injection Molded Parts from Polyamide. Cell. Polym. 2016, 35, 159–192.
      [CrossRef]
20.   Garbacz, T.; Palutkiewicz, P. Effectiveness of Blowing Agents in the Cellular Injection Molding Process. Cell. Polym. 2015, 34,
      189–214. [CrossRef]
21.   Sykutera, D.; Szewczykowski, P.; Roch, M.; Wajer, L.; Grabowski, M.; Bielinski, M. Effect of nitrogen content on physical properties
      of glass fiber reinforced polyamide 6 prepared by microcellular injection molding. Polimery 2018, 63, 743–749. [CrossRef]
22.   Szostak, M.; Krzywdzinska, P.; Barczewski, M. MuCell and InduMold technologies in production of high quality automotive
      parts from polymer materials. Polimery 2018, 63, 145–152. [CrossRef]
23.   Su, B.; Zhou, Y.-G.; Dong, B.; Yan, C. Effect of Compatibility on the Foaming Behavior of Injection Molded Polypropylene and
      Polycarbonate Blend Parts. Polymers 2019, 11, 300. [CrossRef] [PubMed]
24.   Bociaga,
            ˛    E.; Palutkiewicz, P. Effects of blowing agent content and injection moulding conditions on selected properties and
      surface quality of polypropylene moulded parts. Polimery 2012, 57, 38–48. [CrossRef]
You can also read