POVERTY AMIDST PLENTY IV: SURVIVING THE ECONOMIC DOWNTURN
←
→
Page content transcription
If your browser does not render page correctly, please read the page content below
POVERTY AMIDST PLENTY IV:
SURVIVING THE ECONOMIC DOWNTURN

Fourth Edition, 2012

Poverty Amidst Plenty IV: Surviving the Economic Downturn. Fourth Edition. Annapolis, MD:
Community Foundation of Anne Arundel County 2012.

Prepared and written for the Community Foundation of Anne Arundel County by
Dr. Pamela M. Brown and Dr. Karen Pell, with assistance from Allison Holstrom and Julie
Vanskiver.

Copyright © Community Foundation of Anne Arundel County, 2012

                                              i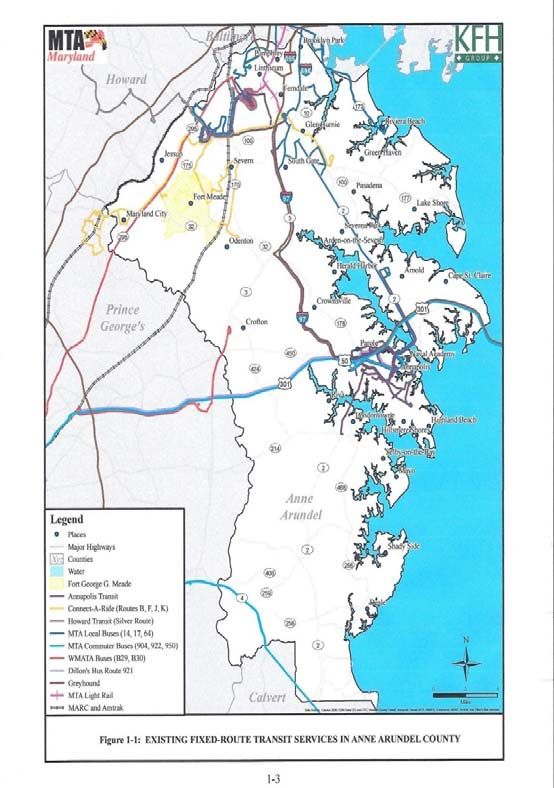
Preface

Poverty Amidst Plenty IV uses the most recent 2010 US Census data, where possible,
recognizing that there are still areas awaiting more complex analyses for county data. The
American Community Survey, 2010 (1-year estimates) was used for more specific data estimated
from the 2010 census. Other sources included many county documents posted online. It is
noteworthy that some sources were reluctant to share county data and redirected researcher
requests to published state-wide data, which was often not as recent.

The 2012 needs assessment draws on qualitative data gathered from 11 key informants and 11
focus groups, for a total number of 105 participants representing public housing, the arts, the
environment, human services, the not-for-profit sector, health, mental health, early childhood and
consumers of services. Interviews and conversations were recorded, with the permission of
participants, and transcribed verbatim. The data were read and reread until dominant themes
emerged which became the sub-text of the report. All participants gave permission for their
words to be used in the final report although their identities are protected. We are indebted to the
many residents who gave their time freely to ensure a wide range of experiences and opinions
may be heard throughout the chapters.

The authors take full responsibility for the interpretations and analyses presented here. They do
not necessarily represent the interpretations or views of the Community Foundation of Anne
Arundel County, the Anne Arundel Partnership for Children and Families, or the boards,
officers, or donors of these organizations or of any other organizations with which the authors
are affiliated. The report has only one fundamental goal: To help frame an informed discussion
about trends and needs in Anne Arundel County, Maryland, and to contribute to planning and
actions that address those needs.

                                                 ii
Foreword
The Community Foundation of Anne Arundel County (CFAAC) is pleased to present this Needs
Assessment report to the residents of Anne Arundel County. We are deeply appreciative to Dr.
Pamela Brown and the Partnership for Children, Youth, and Families and Dr. Karen Pell for
compiling the data and drafting this report.
CFAAC is dedicated to harnessing our community’s tremendous resources in order to address
our toughest challenges and embrace our most inspiring opportunities. Our mission is to connect
people who care to contribute to causes that matter in our community. Through philanthropy and
action, we can make meaningful, lasting, and positive change together.
Unquestionably, the recession and ongoing economic downturn have caused hardship for our
citizens and tested the strength of the social safety net. Direct service providers have struggled to
meet budget goals with fewer resources, while at the same time opening their doors wider to
serve a burgeoning number of community members in need. Yet these same challenging
economic factors are also creating a unique opportunity for program innovation and stakeholder
collaboration. The resulting new partnerships created to share tools and insights have helped
break down agency silos in order to develop effective cross-sector strategies that support
community solutions.
When selected government services were absorbed into the nonprofit sector in the 1990s, the
County devoted a portion of its annual budget to these services in recognition of the public
sector’s continued responsibility to support vital social programs. Now however, government is
not fiscally able to provide the same level of support. As a result, nonprofit organizations are
challenged to fill that budget gap while continuing to provide crucial services to the community.
It is here that CFAAC plays the important role of building a permanent base of local assets that
will sustain nonprofit agencies and the good work that they do to improve the quality of life for
all Anne Arundel County residents.
To this end, CFAAC is committed to achieving a lasting positive impact on our entire
community through fostering philanthropy. Our focus is not solely on Annapolis. Rather,
CFAAC believes that the Anne Arundel County community is linked together as one through
interconnected neighborhoods. Our attention, interest, and giving will reach all corners of the
County. In fact, in an effort to spread our energy and resources where need is greatest, CFAAC
will devote resources and attention to the northern portion of the County, specifically Glen
Burnie, Brooklyn Park, and Pasadena, all areas noted in the report as having elevated needs.
Additionally, the Needs Assessment highlights three pressing issues that were identified time and
again by focus group members interviewed for this report – affordable child care, affordable
housing, and transportation. Without these building blocks, it is nearly impossible for struggling
community members to build independent, self-sufficient lives and be afforded the dignity of
providing for themselves and their families into the future. A combination of public will and
pressure, government action, and public-private partnerships will be necessary if we are to tackle
these important issues. They are vital to the future growth and vibrancy of our community.
iiiThis fourth edition of Poverty Amidst Plenty should be considered a call to action to the entire
Anne Arundel County community. By tracking key measures of community well being and
developing action items to address those needs, the report serves as a yardstick with which we
can measure progress every two years.
We hope this report will inform our fund holders, donors, nonprofit grantees, professional
advisor partners, and the community at-large by underscoring the gravity of local challenges and
the importance of their participation in critical conversations centered on community solutions.
It is our hope that individuals, families, businesses, and civic and faith-based organizations will
use this Needs Assessment to find issues of shared interest, align their efforts and resources, and
join with CFAAC to improve the quality of life for all of our residents.
CFAAC, itself a nonprofit organization, is one of the largest funders of charitable organizations
in Anne Arundel County. Established in 1998, CFAAC is supported by local donors and
governed by a board of distinguished, private citizens. The Community Foundation manages
over $3.1 million spread among 55+ funds including donor-advised, field-of-interest, and impact
area funds. Over the years, we have made more than $3.5 million in grants to local nonprofits.
Last year, grants totaled over $700,000 with most funding given in our Impact Areas of
Economic Opportunity and Youth & Education. To address the most pressing needs of our
community we are also focusing on the following Impact Areas: Arts & Culture, Environment,
and Health. This report reflects our targeted focus in these areas.
Now in our fourteenth year, there is much to celebrate, including our successful efforts to
educate the community of critical needs, convene diverse stakeholders who can help create a
better future for our community members, and build the capacity and effectiveness of nonprofits.
At the same time, however, we know that as a community, we can make an even larger impact
on the quality of life for all. Together we can truly “move the needle.” We hope the Needs
Assessment that follows will spur you to action, including sharing the message with friends and
colleagues.
Fred “Bud” Billups Bess Langbein
Chairman, Board of Trustees Executive Director
Community Foundation of Anne Arundel County
914 Bay Ridge Road, Suite 220
Annapolis, MD 21403
www.cfaac.org
For more information please contact,
Bess Langbein, Executive Director at 410-280-1102 or bess@\cfaac.org.
ivSummary of Principal Findings1
Population Change: The most recent 2010 census gives the total population of Anne Arundel
County as 537,656. Growth has slowed since the high decades of the 1970’s and 80’s with only a
10% increase in overall figures since the 2000 census. The County is becoming increasingly
diverse; the greatest growth occurring in the Hispanic/Latino population. From 1990-2010 that
population almost quadrupled, registering an increase of 383%.
Impact of the Recession: The 2012 assessment reveals some of the major impacts of the
economic downturn, not just for low income families but for ordinary middle income families
struggling to make ends meet, families in which one or both parents have lost jobs and may be
paying a mortgage on a home worth far less than the price they paid. For all income levels these
stressors are resulting in increased depression and anxiety.
Cost of Living: Anne Arundel County is one of the top three most expensive places to live in
Maryland. Housing costs have doubled since 2001, which is the highest increase in the state,
according to the recently released 2012 Self Sufficiency Standard for Maryland. This report
shows that a family consisting of one adult and a preschool child would need an income of
$58,048 and above to live independently in Anne Arundel County.
Family Income: 2010 census estimates report that the median family income in Anne Arundel
County is $97,974 although there are still nearly 27,000 families earning less than $50,000 (see
Table 2.3). The median income for people in the workforce is $41,876 and when that amount is
tied to the Maryland Self Sufficiency Standard of $58,048, there remains an income gap of
$16,172. A 2010 survey of three subsidized and public housing complexes in the City of
Annapolis fixed the median income within those complexes at $15,000 leaving residents with an
income gap of over $43,000 and little hope for self-sufficiency.
The Most Compelling Needs: Affordable Housing, Transportation, Quality Child Care:
For Anne Arundel County residents attempting to live independent and productive lives there are
three main barriers to self-sufficiency; housing, transportation and quality child care. These three
basic necessities impact every aspect of family life including employment, access to college,
school stability, health care, good mental health, recreation, and physical activity. These issues
cannot be fixed, entirely, by good programming and grants. It will take political will and courage
from policy makers to address such fundamental barriers to self-sufficiency and their consequent
impact on the economic health of our county.
Homelessness: The County’s homeless numbers, especially for families with children, are
growing. According to the most recent Homeless Management Information Systems (HMIS)
report, 3,605 people are homeless; of those numbers 72.6% report they are not chronically
homeless, 4.2% are veterans, 10.5% report being victims of domestic violence, and only 15.9%
are employed. More than 1,100 are children. The number of homeless children has essentially
doubled since 2008, with some variation from year to year.
1
Family size is defined differently based on the source of information. The federal government defines it one way
and many other sources define it differently. Wherever possible in this report, the specific meaning of family is
described in the text or a footnote in order to be clear and avoid confusion when comparing figures.
vPoverty and Single Parents: Of the 197,569 family households in the county, 28,936 are led by
single parents (male or female); the female heads of households predominate (20,196). Economic
well being for households headed by a single parent is fragile. There are 2,925 single parent
households in which income in the last 12 months was estimated below the federal poverty level
of $23,0502 for a family of four; 2,400 of those households were headed by single females. A
single parent caring for a preschool-aged child needs to earn $27.48 per hour to be self-sufficient
and a single parent with two children, a preschooler and school-aged child needs $32.13 per hour
to meet the family’s basic needs.
Children and Youth: Youth are the promise for the future of Anne Arundel County. Their care
and development from birth, through early childhood, are key to the economic and social vitality
of the county and their success as they struggle through the teenage years and transition into
adulthood. Fortunately, there is some good news to report on some of the eight objectives that
the State of Maryland has identified for assessing child well-being:
• Anne Arundel County has lowered its teen birth rate from 2.1% in 2007 to 1.8% in 2010.
• The mortality rate for infants has decreased consistently over the last four years.
• Anne Arundel County Public Schools (AACPS) uses the Maryland Model for School
Readiness assessment as an early measure of child development. The trend in Anne
Arundel County is very positive with steady growth in the percentage of children entering
school ready to learn over the last five years, reaching 86% in 2011 and remaining at that
rate for 2012.
• AACPS is performing better overall than statewide numbers; students score from three to
nine percentage points higher than Maryland students overall.
• Behavior in school has improved. Data from the Office of Safe and Orderly Schools in
AACPS showed a decline by more than 53% over six years in disciplinary referrals at the
County level.
In a number of other areas, however, the record is not quite as encouraging. For example:
• When student performance is analyzed using Free and Reduced Meals Students
(FARMS) data as an indicator of economic need, Anne Arundel County math and science
scores drop significantly. While students in the FARMS program in Anne Arundel
County do better than like students statewide, there is a troubling gap in performance. For
example, according to 2010-2011 MSA scores, only 76. 2% of Anne Arundel County 8th
grade FARMS students scored proficient in reading in comparison with 87.2% of all
students. For Math proficiency the gap is much wider with only 51.3% of 8th grade
FARMS students scoring proficient or advanced as opposed to 71.2% of all students.
• FARMS students are also missing instructional time at greater rates than students overall.
The FARMS truancy rate escalates as students move up grades, doubling from
elementary to middle, and then growing to more than one in four students in high school.
2
US Government, Health and Human Services, 2012 Poverty Guidelines;
http://aspe.hhs.gov/poverty/12poverty.shtml. Retrieved May 15, 2012.
vi• Mental health services for children are sorely lacking. The system by which the public
school system offers school based mental health was given high marks but there are
waiting lists. Other issues include the lack of mental health providers, especially
psychiatrists, willing to accept Medicaid and MCHIP and the low numbers of bilingual
therapists.
• Transition Aged Youth: The cohort of youth aged 16-24 are experiencing many
transitions, socially, developmentally and economically. They are the age group most
often referenced during this needs assessment as “forgotten” or “lost;” a reference to the
fact that this group is not tracked by any system as a cohort. In almost every focus group
participants commented that the 16-24 age group needs special attention in the school
setting, especially for those who do not want to go to college. There should be
“apprenticeships, job training, and certification programs.”
• There is a steady growth in drug abuse among adolescents, often coupled with gang
activity. Underage alcohol use continues to be reported as a ‘community norm.’
• Participants noted the need for more afterschool programs and mentors to be that “one
caring adult” for children, before they get involved in alcohol, drugs, crime and gangs.
Health: Overall, the county ranks tenth of the 24 Maryland jurisdictions for health vitality per
the County Health Rankings, 2012. Issues related to obesity are rising; 26% of adults in the
county are obese. The most recent study of obesity in children in the county was conducted in
2006. Those data show that 15.6% of children ages 2 to 19 were overweight with 16.9%
additionally at risk of being overweight. Obesity is one of two goals for the new Local Health
Improvement Coalition, a collaboration of public and private stakeholders led by the Anne
Arundel County Department of Health. The other goal is related to co-occurring disorders; a
term to describe residents who are battling substance abuse and mental health issues
concurrently.
Mental Health: Most focus group members who work in service agencies reported that, in 2012,
they are seeing a higher rate of depression among those they serve. They attribute this to the
downturn in the economy and the reduction in community services available to those in need.
According to the Centers for Disease Control Behavioral Risk Factor Surveillance System
(BRFSS), in Anne Arundel County the average number of poor mental health days over a 30 day
period is reported as 3.5, which exceeds the national average of 2.3 and the Maryland average of
3.3. Additionally, the Anne Arundel County Mental Health Agency reports that the county saw
an 18% increase in the number of consumers of services in 2010.
Substance Abuse: Mental health professionals interviewed for this assessment noted that there
are not enough substance abuse counselors or programs; only one in 28 people who need
substance abuse treatment get it. Twenty to twenty-five percent of substance abuse users have an
underlying disorder, often depression. The group presenting with ‘co-occurring’ disorders
(mental health and substance abuse) is growing.
The Environment: Environmental stewardship in the county is enhanced by a large number of
groups and initiatives. Participants noted that the county is lacking a “single entity or champion”
to pull together and align the many volunteer and professional efforts to improve the
environment. Similarly, there is not an integrated report card to monitor the environment and its
impact on health in a more formal way.
viiPoverty Amidst Plenty, 2012
Introduction ___________________________________________________________ 1
Chapter 1: The Most Compelling Needs____________________________________ 5
Affordable Housing __________________________________________________ 5
Public and Alternative Transportation Networks ____________________________ 9
Access to Quality Child Care __________________________________________ 12
Chapter 2: Self Sufficiency Through Economic Opportunity _________________ 14
Poverty ___________________________________________________________ 14
The Self Sufficiency Standard _________________________________________ 15
What We Are Doing Well ____________________________________________ 19
Needs and Gaps In Services ___________________________________________ 19
Chapter 3: Youth Development and Education _____________________________ 20
Children Entering School Ready to Learn ________________________________ 20
Children Successful in School _________________________________________ 21
Students Graduating Successfully ______________________________________ 23
Youth Aged 16-24 Transitioning to Self Sufficiency _______________________ 24
What We Are Doing Well ____________________________________________ 25
Needs and Gaps In Services ___________________________________________ 26
Chapter 4: Health and Environment _____________________________________ 28
General Health Indicators_____________________________________________ 28
Specific Health Indicators ____________________________________________ 31
Mental Health ______________________________________________________ 32
What We Are Doing Well ____________________________________________ 33
Needs and Gaps In Services ___________________________________________ 33
The Environment of Anne Arundel County _______________________________ 34
What We Are Doing Well ____________________________________________ 35
Needs and Gaps In Services ___________________________________________ 36
Chapter 5: Safe Communities ___________________________________________ 37
Children Safe in Families and Communities ______________________________ 37
Risky Behaviors ____________________________________________________ 38
Disproportionate Minority Contact Issues ________________________________ 41
What We Are Doing Well ____________________________________________ 42
Needs and Gaps In Services ___________________________________________ 43
Conclusion/Recommendations ___________________________________________ 44
Appendix A – Geography of Need ________________________________________ 45
Appendix B – Small Group Work from Needs Assessment Presentation ________ 46
Appendix C – SWOT Analysis from Needs Assessment Presentation ___________ 48Introduction
Poverty Amidst Plenty 2012 is the Community Foundation of Anne Arundel County’s fourth
iteration of the Anne Arundel County community needs assessment. The data for the 2010
assessment were collected at the end of 2009, when the economic downturn was still a relatively
new phenomenon for the county. The 2012 assessment reveals some of the major impacts of that
downturn, not just for our low income families but for ordinary middle income families
struggling to make ends meet, families in which one or both parents have lost jobs and may be
paying a mortgage on a home worth far less than the price they paid. Many of these newly poor
families are requesting help and accessing services for the
first time, stretching available resources during a period
The most recent 2010 census when continuing budget cuts are weakening the capacity of
(see Table A) gives the total agencies to respond to vulnerable children and families.3
population of Anne Arundel
County as 537,656. Growth Anne Arundel County can be divided into four, very
has slowed since the high distinct, quadrants. The northern part of the county touches
decades of the 1970’s and 80’s the edges of Baltimore City and shares issues related to
urban poverty. To the West, the new Odenten Town Center
with only a 10% increase in
rubs shoulders with the military installation of Fort Meade,
overall figures since the 2000
the new U.S. Cyber Command headquarters and home of
census. The County is the National Security Agency. The Base Closure and
becoming increasingly Realignment Commission (BRAC) is creating new jobs
diverse; the greatest growth and housing as military personnel are transferred from
occurring in the other areas of the country. The central part of the county is
Hispanic/Latino population. dominated by the historic City of Annapolis, situated on the
From 1990 -2010 that Chesapeake Bay at the mouth of the Severn River. With a
population almost population of 38,394, 4 Annapolis is one of only two
quadrupled, registering an incorporated towns in the entire county; the other being
increase of 383%. Focus Highland Beach. Finally, the area referred to as South
County (in complete contrast to the North) most resembles
group participants
some of the rural communities to be found on Maryland’s
commented favorably on the
Eastern Shore. Each one of these county quadrants has its
growing integration of the own unique set of obstacles and barriers for residents,
community noting that many although North County (specifically Glen Burnie, Brooklyn
Hispanics/Latinos are and Pasadena) was most often cited as the area with the
“opening their own small highest levels of unmet needs. An independent survey of
businesses.” The Vietnamese seventeen data sets related to family vulnerability
and Korean populations are corroborated North County’s needs (appendix I), with the
also growing, as participants City of Annapolis registering as a close second in terms of
noted. both unmet need and factors negatively impacting family
life.
3
It should be noted that this needs assessment uses the U.S. Census 2010 definition of a family as ‘a group of two
or more people who reside together and who are related by birth, marriage or adoption.’
4
U.S. Census, 2010.
1Table A
Ethnic/ Racial Composition
Anne Arundel County, 1990-2010
1990 2000 2010 Percent
Change,
1990-2010
Amount % Amount % Amount %
Total 427,239 100.0 489,656 100.0 537,656 100.0 25.8%
Population
Non-Hispanic 361,609 84.6 390,519 79.8 405,456 75.4 12.0%
Whites
Other: 65,630 15.4 99,137 20.2 132,200 24.6 101.4%
Hispanic or 6,815 1.6 12,902 2.6 32,902 6.1 382.8%
Latino
Black or 49,954 11.7 65,755 13.4 83,484 15.5 67.1%
African-
American
Other* 8,861 2.1 20,480 4.2 15,814 3.0 78.5%
* “Other” here includes “American Indian and Alaskan Native”, “Asian”, “Native Hawaiian or other
Pacific Islander”, “Some other race”, or “Two or more races”. Therefore, the “White” and “Black”
figures are those who were counted as “White alone” or “Black alone”.
Source: U.S. Census, American Community Survey, Anne Arundel County, DP-1, 2010.
Anne Arundel County is an appealing place to live. The natural beauty of the county can be
enjoyed through two state and 70 county parks and through an extensive network of recreation
and transportation trails that annually host more than two million visitors.5 With 534 miles of
linear coastline, the county ranks second for waterfront in the state and second in the nation
when compared to other counties. Despite this abundance of water, however, there are only five
points of public water access for our residents.
Notwithstanding the economic downturn, Anne Arundel County is one of the top three most
expensive places to live in Maryland. Housing costs have doubled since 2001, which is the
highest increase in the state, according to the recently released 2012 Self Sufficiency Standard
for Maryland.6 That report shows that a family of two consisting of one adult and one pre-school
child would need an income of $58,048 and above to live independently in Anne Arundel
County. This is 395% of the Federal Poverty Level. Although the median income for a family in
Anne Arundel County is high at $97,974,7 , there are 26,872 families8, or 36% of Anne Arundel
5
Anne Arundel County Recreation and Parks, http://www.aacounty.org/recparks. Retrieved June 7, 2012.
6
Pearce, D.M. February, 2012. The Self-Sufficiency Standard for Maryland, 2012.The Maryland Community Action
Partnership.
7
U.S. Census, American Community Survey, 2010, Anne Arundel County, DP03.
8
U.S. Census Bureau, American Community Survey, 2010, Anne Arundel County, Detailed Table DP02.
2County with incomes less than $58,000 ( the self-sufficiency threshold.) It is clear by the size of
that gap and the number of families that many are in need of help with basic needs.
Participants in the needs assessment cited the economic downturn as a stressor for all income
levels. Low income families are experiencing increased unemployment and reduced access to
health and mental health services, affordable housing and child care. According to the Anne
Arundel County Department of Social Services, households eligible to receive food stamps have
more than doubled between 2006 and 2011. Middle income families negatively impacted by the
economy are also feeling the added stress of unemployment and mounting bills, and for all
income levels these stressors can result in depression and anxiety. Between 2007 and 2010 there
was a 50.5% increase in the use of public mental health services across all age groups in the
county (Table B), with the most significant percentage increases for the 18-21 age group at
58.4% and adults aged 22-64 at 64.8%. Focus group and key stakeholder contributions
corroborate this data citing “depression” as the most overwhelming issue, especially in low
income communities. Participants described the “hopelessness” and “despair” for public and
subsidized housing residents who have a “lack of belief, faith and hope in their future.” Several
participants noted that low income family members may hold “poor mental models” for what
success might look like and set low expectations for the future of their children.
Table B
Persons Served by Anne Arundel County Public Mental Health Service System
FY07 FY08 FY09 FY10 Percent Change
2007-2010
Early Child (0-5) 214 263 292 296 38.3%
Child (6-12) 1051 1148 1314 1430 36.1%
Adolescent (13-17) 847 919 959 1120 32.2%
Transitional (18-21) 303 363 402 480 58.4%
Adult (22-64) 2,310 2662 3059 3811 64.8%
Elderly (65 and over) 49 52 49 49 0%
TOTAL 4774 5407 6075 7186 50.5%
Source: Anne Arundel County Mental Health Agency, Mental Health Plan (FY11-13) 2009 and 2010 Annual
Reports http://www.aamentalhealth.org/documents/FINAL-AAPLAN.pdf
Despite the issues outlined above, this needs assessment is a story of hope and survival for our
county. Participants in focus groups and interviews reported a vibrant spirit of collaboration;
among residents, the philanthropic community, government and non-profit agencies, the business
sector and the faith based community. Of particular note are some of the new partnerships
developing between city and county government, the private and public health systems and most
importantly, the contributions of residents within their own neighborhoods, working shoulder to
shoulder with child serving agencies. Decreasing funds may have driven this shared sense of
responsibility but it has resulted in new, cost-effective and creative ways to serve vulnerable
children and families.
3Leadership in the county was given high marks for caring and creativity among the majority of
respondents and cited as “outstanding” at the public school system, community college, agency,
and not-for-profit levels. That leadership is driving some innovative programming, with several
programs singled out for special mention including:
• Arts integration and the Advancement Via Individual Determination (AVID) programs in
the Anne Arundel County Public Schools (AACPS)
• A robust non-profit community with leadership that is getting better at focusing on what
they do best while centralizing their efforts and maximizing their resources.
• The Systems of Care single point of access collaboration headed by the Partnership and
AACPS
• Healthy Start and the Residents Access to a Coalition of Health (REACH) programs
funded by the Anne Arundel County Department of Health
• Step up to Success through Anne Arundel County Workforce Development
• Pathways to Opportunity at the Housing Authority of the City of Annapolis
• Annapolis Community Health Center funded by Anne Arundel Medical Center
4Chapter 1: The Most Compelling Needs: Affordable Housing, Transportation,
Quality Child Care
For Anne Arundel County residents attempting to live independent and productive lives there are
three main barriers to self-sufficiency; housing, transportation and quality child care. These three
basic necessities impact every aspect of family life including employment, access to college,
school stability, health care, good mental health, recreation, and physical activity. Without these
basics, especially for single parent families, it is almost impossible to hold down a job, or even
get to an interview. They were the big three, referenced over and over again by participants as
the major obstacles to a healthy, self-sufficient life in the county.
1. Affordable Housing
The median home value in Anne Arundel County in 2012 is $249,000 which is $39,000 higher
than the rest of the state and $72,000 greater than the U.S. median price. At the same time, costs
of housing in the county have experienced a 99% increase, almost doubling between 2001 and
2012.9 During the economic downturn more families have seen their homes move into
foreclosure which has increased the number of families looking for affordable rental property.
The median rental price in the county is $1,137 per month10. Since 2006, the percentage of
households required to spend more than 30% of their income on housing has increased (see
Figure 1.1 below). Renters increased almost 10% to 48.6% and homeowners show a steady
upward trend to the current rate of 36.6%. The lack of affordable housing in the county was a
constant refrain among participants in focus groups and interviews. For families who have lost
one or both jobs and have fallen behind with their mortgage or rent, the prospects for finding
another, cheaper, home are slim.
Figure 1.1
Share of Anne Arundel County Households Required to Devote 30% or More
of Household Income to Housing, 2006-2010
Source: U.S. Census Bureau, American Community Surveys, 2006, 2008 and 2010, Anne Arundel
County, Table B25074; U.S. Census Bureau, American Community Survey, 2010, Anne Arundel
County, Table S2506
9
Pearce, D.M. February, 2012. The Self-Sufficiency Standard for Maryland, 2012.The Maryland Community Action
Partnership.
10
Anne Arundel County, Maryland Real Estate and Demographics, http://www.CLRsearch.com.
5According to participants, many low income, single family homes are now overcrowded by other
family members who lost their own homes during the recession. As one participant commented
“many (homeless) are living with family members; in some cases up to fifteen persons in a
townhouse. Others live from place to place.” The lack of affordable housing is a particularly
difficult issue for low income families, especially those in public housing. As another participant
commented:
There’s no affordable housing for public housing residents. When people say public housing is temporary
residents ask “where am I going to move to?” Most can’t afford to live in the community.
For families at risk of homelessness the chances of finding a temporary space in public or
subsidized housing is particularly bleak. The number on the county waiting list for housing
vouchers in 2011 was 7,725 yet there are only 1,720 available vouchers (Figure 1.2). The trend
line for numbers of families on the waiting list has an up and down appearance in this four year
time frame. Standard practice for the housing authority is to purge the list of families apparently
no longer interested. Twice per year the county housing authority requires a check in process;
when families don’t respond, they are purged from the list. Also, when vouchers are issued, large
groups of families are invited to an informational meeting. When families do not attend and do
not contact the office, they are removed from the waiting list. It is clear that in 2010, more
families were purged, which was so noted by the county housing eligibility officer.11
Additionally, as of this writing there are 1,854 families on the Housing Authority of the City of
Annapolis’ (HACA) waiting list. 12
Figure 1.2
A.A. County Waiting List for Housing Choice Vouchers vs. Available Vouchers
2008-2011
Source: Anne Arundel County Community Development Services, FY 2008, 2009, 2010 and 2011. Consolidated
Annual Performance and Evaluation Report (CAPER).The Homeless Population
11
Personal communication with Housing Program Eligibility Officer, Anne Arundel County
12
HACA personal communication, 2012.
6The county’s homeless numbers, especially for families with children, are growing. According to
the most recent Homeless Management Information Systems (HMIS) report13, 3,605 people are
homeless; of those numbers 72.6% report they are not chronically homeless, 4.2% are veterans,
10.5% report being victims of domestic violence, and only 15.9% are employed. These data were
collected from homeless persons who used emergency shelter, transitional housing or permanent
supportive housing programs during the 12-month period that spans 2010-2011. The data are
based on unduplicated counts, such that each person is counted only once, regardless of how
many different programs the person used. These data were corroborated by many stakeholders
who commented on the increasingly visible homeless population living in camps. As one
participant noted:
Homeless camps are popping up everywhere; off Glen Burnie on 8th Avenue and there’s another on Route
10. There’s one off 648. There’s one tent city of teenagers off Baltimore Annapolis Boulevard. They feel
safe together.
Tables 1.1 - 1.3 describe characteristics of these homeless persons. More than 1,100 are children;
they represent many races, they use emergency shelters when available, and a small percentage
move into more permanent housing solutions.
Table 1.1
Age, Ethnicity and Race Breakdown of those in Homeless Status per HMIS
2010-11 (Unduplicated Count)
Breakdown # of Homeless
Ages 0-5 504
Ages 6-17 636
Ages 18-61 2366
Ages 62+ 99
TOTAL - Age Group 3605
Hispanic/Latino 182
Non-Hispanic 3355
Ethnicity - No Report 68
TOTAL - Ethnicity 3605
White/Caucasian 1612
Asian 12
Black/African American 1736
American Indian/Alaskan/ 13
Hawaiian/Pacific Islander
Multi-Racial 174
Race - Not Reported 58
TOTAL - Race 3605
Source: Program Demographics Report HMIS, DSS Anne Arundel County, personal communication.
13
Program Demographics Report HMIS, Department of Social Services, Anne Arundel County, personal
communication.
7Table 1.2
Use of Shelters Anne Arundel County
2008, 2009, 2011 (Unduplicated Count)
FY08 FY09 FY11
Emergency Shelters
Persons in Families 450 350 863
Individuals 306 220
Transitional Housing
Persons in Families 138 108 164
Individuals 32 33
TOTAL 926 711 1027
Sources: http://hudhdx.info/publicReports.aspx, DSS Anne Arundel County, personal communication.
Table 1.3
Number of Shelter Users by Type of Shelter per HMIS
2010-11 (Unduplicated Count)
Shelter Type # of Users
Emergency Shelter 863
Transitional Housing 164
Permanent Supportive Housing 246
Homeless Prevention/Rapid Re-Housing 586
Services Only 2436
Source: Program Demographics Report HMIS, DSS Anne Arundel County, personal communication.
Homeless Children
AACPS uses a more strict definition to identify homeless children in the public school system
than that used by the Federal government. The No Child Left Behind Act defines “homeless” as
individuals who lack a “fixed, regular and adequate night time residence.” This definition
includes children who are sharing housing with other families or who are “living in motels,
hotels, trailer parks or camping grounds … are living in emergency or transitional shelters; are
abandoned in hospitals; or are awaiting foster care placement.”14 Pupil personnel workers inside
the public school system are most acutely aware of this issue. As one of our participants
commented:
I was in a meeting and a Pupil Personnel Worker told me that since Christmas ten students had walked in to
tell her they were now homeless; they had lost their homes. She was telling this community group “it’s
epidemic… there are not enough resources.”
A further housing issue relates to youth over 18, some of whom have aged out of foster care,
mental health or the juvenile services system. They may have also failed to graduate from school
or dropped out. As one participant noted “we don’t have any affordable housing for 18-22 year
olds. They can’t afford $1,500 a month rent.”
14
Subtitle B of Title VII of the McKinney-Vento Homeless Assistance Act, Title X, Part C, of the No Child Left
Behind Act.
8From communication with AACPS personnel working with homeless youth, the trends show a
steady increase. The number of homeless children has essentially doubled since 2008, with some
variation from year to year. At the beginning of the 2011-2012 school year, 52% of homeless
children in AACPS were in grades K – 5.15
2. Public and Alternative Transportation Networks
The lack of public transportation is a huge issue throughout the county, especially related to its
impact on potential self-sufficiency for families through adequate employment. As one
stakeholder commented “You have to have a car to have a job in this county.” In fact, according
to a 2010 CLR Choice report16, 90.7% of county workers travel to work by truck, car or van, and
2.66% take public transportation compared to 6.94% overall in Maryland. The issue is
exacerbated because there is no single transportation authority in the county. The transportation
systems that do exist are small and not integrated well. The City of Annapolis does operate a
growing transit system but it stops at the borders of the city with few linkages to expanding
workforce sites such as the Video Lottery Casino at Arundel Mills, and the Fort Meade area
where the workforce has increased due to BRAC.
The focus for the county appears to be on auto transportation with limited space planned for
sidewalks and bike lanes. Additionally, much of the commercial development in the county has
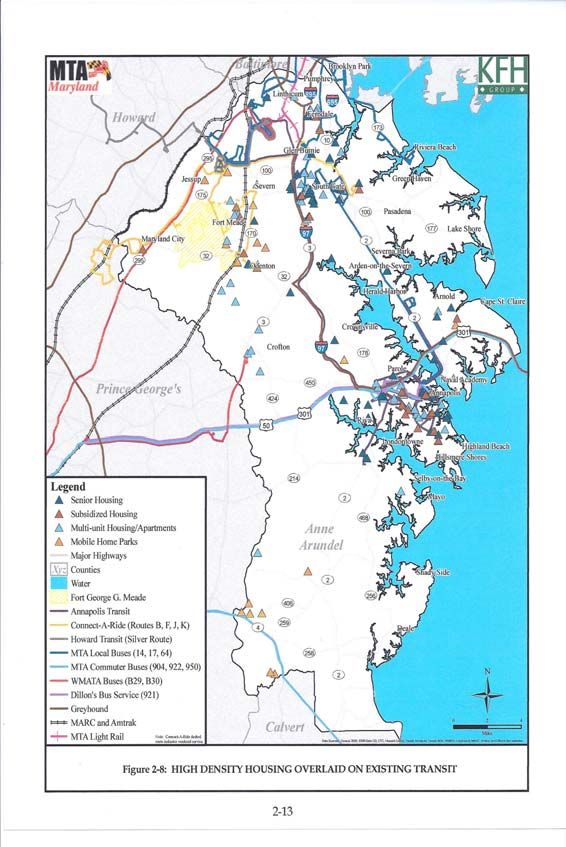
been built with the automobile in mind. As illustrated in Figures 1.3 and 1.4, none of the existing
transportation networks link to dense housing areas or existing high employment area such as
Arundel Mills, Thurgood Marshall BWI Airport, and Fort Meade.
15
Board Homeless Reports, 2007-2011; AACPS, Lynne Weise, personal communication.
16
Anne Arundel County, Maryland Real Estate and Demographics, http://www.CLRsearch.com.
9Figure 1.3 Figure 1.4
Source: Anne Arundel County Transit Development Source: Anne Arundel County Transit Development
Plan Update, January 2010, page 1-3 Plan Update, January 2010, p2-13
The transportation needs identified in the county’s 2010 Transit Development Plan Update17
offer further insight into the perceived role of public transportation as communities grow. This
combined analysis of demographics and development patterns highlighted several areas within
the county that have significant transportation needs:
17
KFH Group, Inc. January 2010. Anne Arundel County Transit Development Plan Update: Final Report. Bethesda,
MD.
10Table 1.4
Anne Arundel County Transportation Needs by Region
Current
Geographic
Transportation Needs Opportunities for Improvement
Area
Systems (if any)
Linkages to existing Baltimore- and
Greater frequency of Annapolis-based services; Cross-
Northwest
Some services existing services, more county links to developing town
A.A. Co.
activity centers served centers, major employment centers,
and regional transportation hubs
Cross-county links to developing
Very limited Implementation of
Northeastern town centers, major employment
services to no public transportation
Peninsulas centers, and regional transportation
service services, writ large
hubs
Linkages to existing Baltimore- and
Some transit services Greater frequency of Annapolis-based services; Cross-
Annapolis/
but predominately existing services, more county links to developing town
East County
within city limits activity centers served centers, major employment centers,
and regional transportation hubs
Some transit services
Linkages to existing Baltimore- and
- MARC Train and Services that are
West County/ Annapolis-based services; Cross-
Light Rail beneficial for residents
Ft. Meade county links to developing town
(commuter services beyond commuting
Area centers, major employment centers,
to Baltimore and needs
and regional transportation hubs
Washington D.C.)
Scheduled shuttles or demand-
response transit services due to low
High numbers of
population density: Cross-county
South County No services potentially transit-
links to developing town centers,
dependent persons
major employment centers, and
regional transportation hubs
There are initiatives in place, currently, to address some of these issues including a plan to link
job seekers in North County to some of the large employment hubs outlined above. However,
county youth and their families will continue to struggle with the many obstacles created through
the overall lack of transportation. As one community college student reported; “transportation is
terrible. It is impossible to get to the community college if you don’t have a car.” Speaking for
parents who need specialized medical help for their child on a regular basis, one of our
participants had this to say:
If you need to get a child to Kennedy [Krieger] there is no transportation to get across counties. You would
have to get the bus from Annapolis (you have to get down to where Social Services is) then on the light rail
then transfer to the subway. How many hours is that? What if your child needs to go once or twice per
week?
113. Access to Quality Affordable Child Care
Access to quality child care was the third recurring theme when participants commented on
barriers and obstacles for families. The estimated cost for infant child care in a family home is
$9,943 a year and the estimated annual cost for a pre-school child in a child care center is
$9,130.18 When the two amounts are added together to calculate the cost for a family with two
children, the amount is 22% of a median income of $85,000 (for a family of four). Clearly, as
participants reported, although wealthy families are still able to afford the best quality childcare
without waiting, low income families are paying a much higher percentage of their income.
Parents who “need to work can’t afford the cost of childcare so they use a family member or
friend.” As another participant commented;
What about the single parent who works at Walmart and has three children under five? … we lean on these
parents to get jobs and get busy but we can’t offer them any subsidized childcare.
Children in low income families are the ones in most need of quality child care because they face
so many obstacles related to poverty. One of our early childhood experts noted that “for the kids
who are at greatest risk of not coming to school prepared … they need the best quality child
care.” As all data show, these children are the least likely to be in a quality childcare setting.
The availability of child care has been impacted by the recession. More families are unable to
afford quality child care and, as a result, many certified child care providers have lost their
businesses. According to the Maryland Child Care Resource Network (2011) fewer family and
center based programs are predicted in the County over the next three years, which will continue
to reduce capacity for quality child care programs. The number of family care providers is
predicted to decline to 614 by 2015; centers to 88. Table 1.5 shows the current child care slots
available through public and private funding.
Table 1.5
Current Providers by Type of Early Childhood Education (ECE)
in Anne Arundel County, 2011
Type of ECE Provider # Programs Capacity of Children
Private Funding
Family Child Care 681 5025
Child Care Centers (8-12 hour) 94 7240
Infant and Toddler Programs 43 794
Employer-Sponsored 3 403
Nursery Schools 37 NA
Public Funding
Head Start/Early Head Start 7 441
Public Pre Kindergarten 37 NA
Source: Maryland Child Care Resource Network, Arundel Child Care Connections, Child Care Demographics
2011; retrieved from http://arundelccc.org/AnneArundel.pdf March 4, 2012; p 5.
18
Maryland Child Care Resource Network. 2011. Child Care Demographics, Anne Arundel County Report.
http://www.marylandfamilynetwork.org/mdcfc/pdfs/demographics/AnneArundel.pdf. Retrieved March 4, 2012.
12The state’s child care subsidy program offers vouchers to low income families and 70 - 78% of
child care providers are willing to accept them19. Unfortunately, there is a waiting list and at
some point every year those vouchers simply run out. In 2011, the allocation from the Maryland
State Department of Education for Anne Arundel County was 729 slots, which is 5% of the
available child care slots in the county. Since the beginning of 2012 there has been a statewide
freeze on those vouchers with no end date announced. Data show that in 2011, 285 families
called LOCATE to seek child care subsidy; these queries represented one in four calls received
by the Anne Arundel Child Care Connections, the childcare resource and referral center in the
county.20 Not surprisingly the number one reason parents, when queried, could not find child
care in Anne Arundel County, is cost. Again, according to our early childhood experts; “we need
more high quality childcare and we need to revamp the whole subsidy system so that it
encourages the kids who need the best quality to get the best quality.”
Summary
Transportation, affordable housing and quality child care are recurring issues for low income
families throughout the nation but in a wealthy, geographically diverse and large county like
Anne Arundel these obstacles are thrown into sharp relief. They are not issues that can be fixed,
entirely, by good programming and grants. It will take political will and courage from policy
makers to address such fundamental barriers to self-sufficiency and their consequent impact on
the economic health of our county.
19
Maryland Child Care Resource Network. 2011. Child Care Demographics, Anne Arundel County Report.
http://www.marylandfamilynetwork.org/mdcfc/pdfs/demographics/AnneArundel.pdf. Retrieved March 4, 2012.
20
LOCATE: Child Care at Arundel Child Care Connections (7/1/09-6/30/10
13Chapter 2: Self-Sufficiency through Economic Opportunity
Poverty
As noted in the Introduction, the continuing recession has forced more families into crisis and
created a subsequent impact on well-being as noted by increased stress, anxiety and depression.
As one physician serving the low income community noted:
There’s a lot of depression; it’s almost every other patient. They can’t sleep so they can’t get up to get kids
to school. .. weight gain comes with depression along with low self-image and low self-esteem. The
stressors are the mounting bills to pay.
Poverty is defined in many different ways. From the Federal government definition, a family of
four (two adults, two children) would be considered in poverty if the family income was below
$23,05021. There are 537,656 residents of Anne Arundel County estimated from the 2010
census; 6.4% or 34,410 residents live in poverty; 10,276 of these are children under 18 years of
age.22 One factor contributing to poverty in Anne Arundel County, as in the rest of the nation, is
the structure of families. Of the 197,569 family households in the county, 28,936 are led by
single parents (male or female); the female heads of households predominate (20,196).23
Economic well being for households headed by a single parent is fragile. There are 2,925 single
parent households in which income in the last 12 months was estimated below the federal
poverty level; 2,400 of those households were headed by single females.24
Another indicator of the impact of the recession for Anne Arundel County families is the number
of households that qualify and apply for food stamps although the eligibility criteria have
remained the same. As illustrated in Figure 2.1, that number has tripled between 2006 and 2011.
Participants noted that the face of poverty is changing in the county; many former middle income
families are becoming the “new” poor. As one participant noted:
Families are beginning to face homelessness because of foreclosure and because Dad lost his job. Some
families cannot sell their house. There’s a new face of need for services – it is the middle class.
21
US Government, Health and Human Services, 2012 Poverty Guidelines;
http://aspe.hhs.gov/poverty/12poverty.shtml. Retrieved May 15, 2012.
22
U.S. Census Bureau, American Community Survey, 2010, Anne Arundel County, Detailed Tables, Table S0201.
23
U.S. Census Bureau, American Community Survey, 2010, Anne Arundel County, Detailed Tables, Table S1101.
24
U.S. Census Bureau, American Community Survey, 2010, Anne Arundel County, Detailed Tables, Table B17012.
14Figure 2.1
Average Monthly Anne Arundel Certified Food Stamp Households
2006-2011
Source: Anne Arundel County Department of Social Services (2006-2011).
http://dhr.maryland.gov/co/reports.php
The Self-Sufficiency Standard
Much has been said about the desirability of a self-sufficient county population that does not rely
on government programming to make ends meet. As referenced in the introduction to this report,
the 2012 standard to measure family self-sufficiency was released recently. The 2012 Self-
Sufficiency Standard for Maryland measures how much
income a family of a certain composition in a given
Moving along the continuum, a
place must earn to meet its basic needs. The figures for
Anne Arundel County offer a clear picture of what is
single parent caring for a
needed for youth and families to live independent and
preschool-aged child needs to
productive lives in the county. For instance, a single
earn $27.48 per hour to be self- adult needs to earn $16.54 per hour working full-time to
sufficient and a single parent be able to meet his or her basic needs. Meanwhile, youth
with two children, a preschooler without a high school diploma and even some who have
and school-aged child needs bachelor’s degrees may only be able to find a job at the
$32.13 per hour to meet the state minimum wage of $7.25 per hour. 25
family’s basic needs. This family
requires, at a minimum, the The Self-Sufficiency Standard has increased in all
equivalent of over four full-time Maryland counties over the past decade. When
minimum wage jobs in comparing standards for a three-person family (one
adult, one preschooler, and one school-age child) in
Maryland. Two parents with one
Maryland from 2001 to 2011, the standard has increased
preschooler and one school-age
by 54%, or an average of 4.9% per year. Anne Arundel
child each need to earn $18.02 County has one of the largest increases (over 70%), as
per hour working full-time to does Kent, and Queen Anne’s counties. When
meet their family’s basic needs. comparing the Standard, the counties of Anne Arundel,
Charles, Howard, and Montgomery have the highest
25
Maryland Department of Labor, Licensing, and Regulation, Division of Labor and Industry, 2011.
15Self-Sufficiency Standards in the state for one adult and one child in pre-school. Anne Arundel
County’s standard is calculated to be $58,048, exceeding Maryland state averages for 2012.
When comparing wage earner rates for self sufficiency for one adult, one school age and one
preschool age across local and national cities and jurisdictions, Anne Arundel County ranks
below Montgomery County, Maryland; San Francisco, and New York City; but higher than Los
Angeles, Philadelphia and Washington, DC. 26
Comparing the federal poverty rate to the Self-Sufficiency Standard, as described above, Anne
Arundel’s self sufficiency standard is 252% of the Federal Poverty Level. Families that do not
qualify for services because their income levels are too high often receive no services yet
struggle to work, eat and shelter their families.
Factors that Support Self-Sufficiency:
The Self-Sufficiency Standard for Maryland report makes recommendations for raising incomes
and reducing costs through programs like child care assistance, food benefits, earned income tax
credit, and the removal of barriers related to transportation and housing costs; barriers already
highlighted earlier in this report. Raising incomes requires access to better paying jobs through
education, career guidance and job training. Many participants in focus groups made such
suggestions including the fact that “there needs to be more school-based services related to food,
housing and employment to help families, while removing transportation barriers.”
Adult Educational Achievement:
As Table 2.1 shows, Anne Arundel County has a highly educated workforce; 89.3% is estimated
to have a high school diploma and 64% of the population has at least some college education.
However, there are nearly 40,000 residents who did not graduate from high school. According to
national data, the unemployment rate for high school graduates is 22% but for dropouts the rate
increases to 33%.27 In contrast, as Table 2.2 indicates, the general unemployment rate for the
county is 6.8%.28 Focus group participants commented that due to the recession, many entry
level, low income jobs are being taken by new college graduates leaving a shrinking pool for
those without any formal qualifications beyond high school.
26
Pearce, D.M. February, 2012. The Self-Sufficiency Standard for Maryland, 2012.The Maryland Community
Action Partnership, p 9.
27
Carnevale, A.P,, Chcah, R.,& Strohl, J. Hard Times: College Majors, Unemployment and Earnings; Not All
College Degrees are Created Equal.
http://www9.georgetown.edu/grad/gppi/hpi/cew/pdfs/Unemployment.Final.pdf; Retrieved May 7, 2012.
28
Anne Arundel Economic Development Corporation, Economic Indicators, Third Quarter, 2011.
16You can also read