Power transactions and trends: Q1 2018 - EY
←
→
Page content transcription
If your browser does not render page correctly, please read the page content below
Power transactions and trends: Q1 2018

3                                                                  6
Contents
                                                                                    14

                                                  20

                                                                                    25
3          Overview                                14 Europe                                        25 Africa and
6          Americas                                20 Asia-Pacific                                            the Middle East

                                         EY Global Transaction Advisory Services (TAS)
    On the web or                        Power & Utilities (P&U) contacts
    on the move                          Miles Huq                 Sara Richardson           Shikhar Gupta             Anjushi Joshi
    Power transactions                   EY Global Transactions    EY Global TAS P&U         EY Global P&U Analyst     EY Global P&U Analyst
                                         P&U Leader                Associate Director        +91 124 470 1233          +91 124 469 2734
    and trends is also                   Baltimore, Maryland, US   and Resident              shikhar.gupta@in.ey.com   anjushi.joshi@in.ey.com
    available online at                  +1 410 783 3735           +61 7 3243 3758               @ShikharGupta_EY          @anjushi_joshi
                                         miles.huq@ey.com          sara.richardson@au.ey.com
    ey.com/ptt.                              @MilesHuq                 @sararichardson2

2    | Power transactions and trends: Q1 2018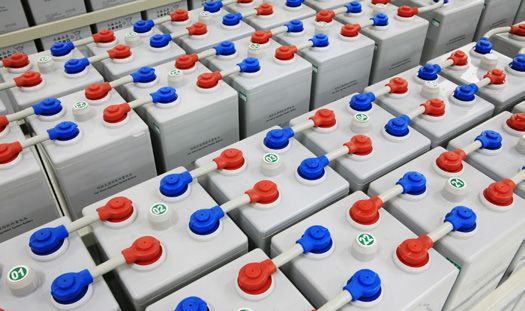
Overview
Megadeals drive eight-year high in deal value
• 15 multi-billion-dollar deals formed 90% of deal value
• 48% contributed by one European megadeal

Chart 1: Global P&U deal value by segment                                                      Chart 2: Global P&U deal value and volume by region
(announced asset and corporate-level deals, Q1 2016–Q1 2018)                                   (announced asset and corporate-level deals, Q1 2016–Q1 2018)
     110                                                                                             110                                                          140
     100                                                                                             100
      90                                                                                              90                                                          120
      80                                                                                              80                                                          100

                                                                                                                                                                       Number of deals
      70                                                                                              70
      60
US$b

                                                                                                      60                                                          80

                                                                                              US$b
      50                                                                                              50
      40                                                                                                                                                          60
                                                                                                      40
      30
      20                                                                                              30                                                          40
      10                                                                                              20
                                                                                                      10                                                          20
       0
             Q1       Q2       Q3       Q4      Q1       Q2       Q3       Q4      Q1                  0                                                          0
            2016     2016     2016     2016    2017     2017     2017     2017    2018                      Q1   Q2   Q3   Q4   Q1   Q2   Q3   Q4   Q1
                                                                                                           2016 2016 2016 2016 2017 2017 2017 2017 2018
              Generation     Renewables      T&D           Integrated
              Water and waste water     Others                                                             Americas   Europe    Asia-Pac      Deal Volume
Source: EY analysis based on Mergermarket data.

In Q1 2018, deal value in the global                            for fewer desirable opportunities                        competitors. In addition, investors’
power and utilities (P&U) sector                                amid historically low interest rates,                    desire for opportunistic investment
rose to an all-time quarter high of                             high stock valuation currency and                        in the P&U sector is growing rapidly,
US$97b and deal volume increased                                robust access to the capital markets.                    resulting in a highly competitive deal
to 128. This record first quarter                               The trend of financial sponsors’1                        market. Financial sponsors have
highlights an increased willingness                             involvement in the P&U market has                        raised substantial capital over the
from industry executives to transact,                           strengthened since 2017 and is                           past three years, and we see large
as demonstrated in EY’s 18th Edition                            expected to continue.                                    amounts of “dry powder” looking for
of the Global Capital Confidence                                                                                         appropriate power, utilities and energy
                                                                A more complex deal environment
Barometer.                                                                                                               infrastructure deals. Against this
                                                                is emerging, driven by several
                                                                                                                         backdrop, both financial sponsors and
We see continued strong interest                                factors. New technology and new
                                                                                                                         corporates are seeking to strategically
in regulated businesses, including                              competitors are aggressively
                                                                                                                         align their portfolios.
electricity transmission and                                    challenging the traditional monopoly
distribution (T&D), contracted power                            mindset, resulting in disruptive                         We see several trends with global
generation, water distribution and                              trends, including government and                         relevance. First, it appears that there is
treatment businesses, as well as                                regulatory change, a changing                            a shift away from coal-fired generation,
renewable energy assets. Favorable                              generation mix, grid defection,                          as demonstrated by the segment’s deal
M&A conditions look set to heat up                              increasing customer expectations                         value and low multiples this quarter. A
further as investors bid aggressively                           and the entry of nontraditional                          number of regions are accelerating the

1
    Defined in this report as private equity funds, infrastructure funds, sovereign wealth funds and pension funds.

                          US$97b                                                 US$46.6b                                          32
                                                                                                                                   deals in solar assets totaling
                          global deal value                                      largest deal of the                               US$4.1b and forming 25%
                                                                                 quarter                                           of total deal volume

                                                                                                                               Power transactions and trends: Q1 2018 |                  3
retirement of coal generation, while                     deals in Q1 2018 were in renewables.               renewable assets themselves,
others are banning the development                       Investors have historically sought                 further propelling the renewable
of new coal plants. The profitability of                 clean energy deals backed by power                 energy subsector.
coal-fired generation is struggling in                   purchase agreements (PPAs) with
                                                                                                            Third, this rise of renewables,
most regions.                                            regulated utility offtakers; however,
                                                                                                            as well as the growing adoption
                                                         corporations are now stepping into
Second, both M&A and greenfield                                                                             of electric vehicles (EVs) in many
                                                         that role and signing PPAs directly
investment in renewable energy                                                                              markets, has boosted interest
                                                         with project sponsors. Renewable
are gaining speed, driven by policy                                                                         and investment in supporting
                                                         developers also face increased
support and improving economics as                                                                          technologies, such as batteries,
                                                         competition as many utilities are
the cost of renewables continues to                                                                         and infrastructure, including
                                                         beginning to build, own and operate
decline. Nearly half of all announced                                                                       EV charging stations.

Trading multiples dashboard, Q1 2018
                                            Current multiples       Historic multiples      Forward EBITDA CAGR           Historic EBTIDA CAGR
                                            Market capitalization   Market capitalization   Two-year forward from         Five-year (Q1 2013–
                                            weighted average        weighted average        Q1 2018 compound              Q1 2018) CAGR of
                                            EV/NTM EBITDA           EV/LTM EBITDA           annual growth rate (CAGR)     select utilities’ market
                                            trading multiples       trading multiples for   of select utilities’ market   capitalization weighted
                                                                    Q1 2013–Q4 2017         capitalization weighted       adjusted EBITDA
                                                                                            adjusted EBITDA
    Transmission and distribution (T&D)             10.6                    10.4                       1.7%                           6.3%
    Renewable energy (RE)                           15.0                    15.9                       3.3%                           4.7%
    Integrated utilities                            11.9                      9.9                      2.2%                           4.3%
    Independent power producers (IPPs)              10.8                    20.0                         nm                             nm
    Water and wastewater (W/WW)                     14.5                    12.2                       3.0%                           4.0%
    Americas                                        12.6                    13.7                       3.2%                           5.2%

    TD                                              11.1                    10.5                       0.8%                           0.2%
    RE                                              11.4                    12.8                       2.3%                           4.3%
    Integrated                                        7.2                     8.4                      0.8%                          –3.9%
    IPP                                               n/a                     n/a                        n/a                            n/a
    W/WW                                              n/a                     n/a                        n/a                            n/a
    Europe                                            8.7                   10.6                       1.2%                          –2.8%

    TD                                                9.4                   10.7                       3.0%                           1.0%
    RE                                              11.3                    10.7                       6.0%                           5.0%
    Integrated                                        8.1                   11.8                       3.0%                          13.0%
    IPP                                               9.1                   12.8                       6.0%                           2.0%
    W/WW                                              n/a                     n/a                        n/a                            n/a
    Asia-Pacific                                      9.5                   12.2                       3.0%                          12.0%

                                            Key

    EV/EBITDA multiples                     Multiples currently     Multiples currently     Multiples currently           Multiples currently trading at
                                            trading at a high       trading at a slight     trading at a slight           steep discount
                                            premium                 premium                 discount

                                 High                                                                                                                      Low

    EBITDA CAGR                             EBITDA CAGR
Finally, investors continue to be                     The world continues to be divided on           Overall, the start of 2018 has
attracted to network deals globally.                  investment in nuclear energy. In some          delivered a robust environment for
While these large deals are becoming                  countries, policy is the determining           sellers with premium asset valuations
increasingly hard to come by, their                   factor. From an economic perspective,          and highly favorable transaction
long-term, steady returns remain                      nuclear faces a similar fate to coal           terms. We are seeing strong
attractive to both corporates and                     in developed regions that have an              participation in the market from both
financial sponsors.                                   oversupply of generation or where              corporates and financial sponsors.
                                                      margins earned by nuclear generators           In many regions, this is an excellent
Some trends are more regionally
                                                      are squeezed as a result of lower              environment in which to sell assets
aligned. In countries that have
                                                      power prices — i.e., Western Europe            and earn premium valuations with
a high penetration of renewable
                                                      and the US. In regions with growing            astute investors taking advantage of
energy (particularly Australia and
                                                      electricity demand — developing                regional valuation differences — as
parts of Europe), investment in
                                                      countries in Asia, Africa and the              always, timing is of the essence in
gas-fired generation is becoming
                                                      Middle East — investment in nuclear            dealmaking markets.
increasingly important to help balance
                                                      is on the rise.
intermittency.

Global capital flows, Q1 2018
Image 1: Investment activity globally by country (Q1 2018)*

   Germany                       Luxembourg
                                 Investment value                                 UK                  France                  Switzerland
   Investment value                                                                                                           Investment value
                                 US$0.9b (1%)                                     Investment value    Investment value
   US$47.9b (49%)                                                                                                             US$0.9b (1%)
                                                                                  US$5.2b (29%)       US$0.9b (5%)
                                                                                                                              Investment value
                                                                                                                              US$1.7b (9%)

                                                  Belgium
                                                  Investment value                                                                  China
      US                                          US$1.2b (7%)                                                           Investment value
      Investment value                                                                                                      US$4.8b (5%)
      US$25.3b (26%)                                                                                                     Investment value
      Investment value                                                                                                      US$0.9b (5%)
      US$4.8b (27%)

                                                               Spain
                                                               Investment value
                     Chile
                                                               US$10.4b (11%)                  Australia
                                                                                               Investment value
                     Investment value
                                                            Rest of the world                  US$1.6b (9%)
                     US$3.3b (3%)
                                                            Investment value
                                                            US$3.6b (4%)
                                                            Investment value                                          Total
                                                            US$1.5b (8%)                                                  Investment value
                                                                                                                          US$97b
      Top investment destinations                  Top outbound investing countries                                       Investment value
                                                                                                                          US$17.8b
  *Note: Percentages may not add to 100% due to rounding.

                                                                                                         Power transactions and trends: Q1 2018 |   5
Power transactions and trends Q1 2018

    Americas
    Acquisition of integrated assets
    drive deal value

Deal value in the Americas power and utilities (P&U)           of Energy (DoE) to keep power stations running during
sector rose to US$29.4b in Q1 2018, with increases in          war and natural disasters. While there is debate on
both value and volume driven by low interest rates, robust     whether plant closures are a national security risk, Energy
access to capital and favorable transaction terms. Eight       Secretary Rick Perry has indicated his support for the
multi-billion-dollar investments contributed US$25.2b.         bailout. State support to protect nuclear also remains
Almost half (49%) of the quarter’s transactional value was     strong; after months of lobbying, in April, New Jersey
contributed by the announced all stock merger of SCANA         became the third US state (after New York and Illinois) to
Corporation and Dominion Energy. This deal is a strategic      invoke a retail surcharge to subsidize nuclear power.
move by Dominion, whose proposed purchase offers
SCANA a way to ease concerns from customers, regulators        Chart 3: Americas deal value and volume, by segment
and investors after its failed new nuclear construction        (announced asset and corporate-level deals, Q1 2016–Q1 2018)
project in South Carolina. The completion of this deal faces          80                                                       50
an uphill battle on current terms after South Carolina’s              70
                                                                                                                               40
Senate voted to cut the money SCANA can collect from its              60
                                                                                                                                    Number of deals
                                                                      50
customers to cover the stranded costs of building the plant.                                                                   30
                                                               US$b

                                                                      40
                                                                                                                               20
In the US, mounting pressure on merchant generators                   30
                                                                      20
is prompting some companies to seek federal and state                                                                          10
                                                                      10
government support. In just one of many examples of                    0                                                       0
                                                                            Q1   Q2   Q3   Q4   Q1   Q2   Q3   Q4   Q1
the retreat from merchant generation, First Energy filed                   2016 2016 2016 2016 2017 2017 2017 2017 2018
bankruptcy for both its coal and nuclear merchant power                    Generation     Renewables    T&D       Integrated
plants, citing an inability to compete with cheap gas and                  Water and wastewater    Others        Deal Volume
renewable energy. First Energy called for federal support      Source: EY analysis based on Mergermarket data.
to invoke Section 202(c), which allows the US Department

                                  US$29.4b                                                      US$17b
                                   deal value, 32% increase
                                                                              $                  deal value in integrated assets,
                                                                                                 58% of total deal value
                                   from Q4 2017

6   | Power transactions and trends: Q1 2018
These developments play out against a backdrop of the US averaged US$0.13/kWh, and the DoE forecasts
investment in renewable energy, with Q1 2018 hosting that rooftop photovoltaic (PV) solar could cost as little
22 clean energy deals worth US$3.1b. After initial concerns as $0.05/kWh by 2030. In Central and South America,
that federal tariff increases on imported solar cells would greenfield investment in renewable energy is becoming
slow the US industry, a continued decline in prices has highly competitive, with 1,672 renewable projects
sustained momentum in this segment. At the end of 2017, registered to bid for a 1 GW auction in Brazil in April 2018.
the national average retail electricity rate to customers in
Q1 2018 transactional highlights
• S
► upport for EVs increases: US$14.3b (completion contingent and Vistra Energy and Dynegy
In January, US-based Pacific Gas on shareholder and regulatory announced their merger that
and Electric Company launched approvals). same year.
a US$130m program to build
• Gas asset deals boost generation • Corporate investors bet big:
7,500 EV charging stations in
M&A: Value of generation M&A Corporate buyers announced
California. In Maryland, utility
tripled from Q4 2017 to reach 30 deals totaling US$23.1b —
companies are supporting plans to
US$8.2b, while deal volume in this 79% of total regional deal value.
invest US$104m to install 24,000
segment doubled from 5 to 10 In contrast, financial sponsors
charging stations, with the initiative
over the same period. The number announced 12 deals worth
to be supported by charging
of publicly traded independent US$6.3b.
customers 25 to 42 cents more a
power producers (IPPs) continues
month on their electricity bills. • Domestic deals dominate: Almost
to shrink through M&A by
all (90%) deal value was domestic,
• M&A in integrated assets drives private equity buyers. In 2016,
with only US$2.9b contributed
deal value: Investments in US Riverstone acquired 100% of Talen
from cross-border buyers.
integrated assets drove 57% of the Energy, Energy Capital Partners
region’s deal value and included announced the take private of • Renewable deals increase:
the quarter’s biggest deal: the Calpine Corporation, NRG made Investment in renewables rose
Dominion-SCANA merger for significant divestitures in 2017, 24% to reach US$3.1b.
Power transactions and trends: Q1 2018 | 7Americas regional capital flows, Q1 2018
Image 2: Investment activity in Americas by country, (Q1 2018)*
US
Investment value Canada
US$25.3b (86%) Investment value
Investment value US$0.6b (12%)
US$4.8b (88%)
Colombia
Investment value
US$0.3b (1%) Brazil
Investment value
US$0.3b (1%)
Chile Argentina
Investment value Investment value
US$3.3b (11%) US$0.3b (1%) Total
Investment value
US$29.4b
Investment value
Top investment destinations Top outbound investing countries
US$5.5b
*Note: Percentages may not add to 100% due to rounding.
Top five Americas deals, Q1 2018
All deal values indicated are announced deals with disclosed enterprise values comprising equity and debt components.
Announcement Target Target country/ Bidder Deal value Bidder rationale Segment
date bidder country (US$)
3 January SCANA US/US Dominion Energy Inc. 14.3b Expands Dominion’s presence in the Others:
Corporation Southeast; increases its compounded integrated
annual earnings-per-share target
growth rate to 8% through 2020
and reduces customer bills through
refunds of US$1.3b
16 February Enel Generación Chile/Chile Enel Chile S.A. 3.3b Aligns with Enel Chile’s strategy Generation:
Chile (40.02% to consolidate the Chilean energy hydro, wind,
stake) companies of majority shareholder thermal
Enel S.p.A and strengthen its
leadership of Chile’s energy market
5 February 8point3 Energy US/Switzerland Capital Dynamics 1.7b Boosts CDAG’s global presence in Renewables:
Partners LP AG (CDAG) solar, wind, biomass, combined-cycle solar
gas and waste gas-fueled power
generation technology
22 January FirstEnergy Corp US/US GIC Private Limited; 1.6b Reduces FirstEnergy’s company debt Others:
(equity injection) Elliott Management and helps the business prepare to exit integrated
Corporation; merchant generation and focus on
Bluescape Resources regulated business activities
Company LLC
7 February NRG Yield Inc. US/US Global 1.4b Enables GIP to capitalize on Generation:
(46.00% stake); Infrastructure increasing market demand for low renewable
NRG Energy Inc. Partners (GIP) cost, clean energy and thermal
(100.00% stake)
Sources: EY analysis based on Mergermarket data.
8 | Power transactions and trends: Q1 2018Valuations snapshot
The P&U sector traded T&D assets in Q1 2018 traded at an the past five years, the CAGR of
average EV/NTM EBITDA multiple of renewable energy EBITDA was 4.7%;
at a current market 10.6x, a 2% premium to the historic however, analysts predict it to reach
capitalization weighted average multiple of 10.4x. The T&D 3.3% for the next two years.
EV/NTM EBITDA traded at a discount
average EV/NTM EBITDA Integrated assets traded at an
of 16% to the sector average. Lower
(enterprise value by next forecasted EBITDA growth may be
average current EV/EBITDA multiple
of 11.9x, a 20% premium to the
12 months’ earnings before a contributing factor to T&D assets
historic average multiple of 9.9x.
trading at a 16% discount to the
interest, tax, depreciation sector average on an EV/NTM EBITDA
This was demonstrated by the
implied offer price of acquisition for
and amortization) multiple basis. Over the past five years, the
SCANA Corporation by Dominion that
of 12.6x during Q1 2018, compound annual growth rate (CAGR)
represented a premium of 38.2% over
of T&D EBITDA was 6.3%; however,
an 8% discount to the analysts predict this to slow to 1.7%
SCANA’s last trading day closing share
price. Over the past five years, the
long-term (five-year) historic over the next two years.
CAGR of integrated asset EBITDA was
market capitalization Renewable assets traded at an 4.3%, but analysts predict this to slow
average current EV/EBITDA multiple to 2.2% for the next two years.
weighted average multiple
of 15.0x, a 6% discount to the historic
of 13.7x. Renewables and average multiple of 15.9x. The
IPP assets traded at an average
current EV/EBITDA multiple of 10.8x,
water and wastewater renewable assets EV/NTM EBITDA
a 46% discount to the historic average
multiple traded at a premium of 19%
companies traded at to average sector valuations. M&A
multiple of 20.0x. The IPP EV/NTM
EBITDA multiple traded at a discount
a premium to sector premiums may be a contributing
of 14% to the sector average. We have
multiples, while others factor to renewable assets trading at
not included analysis of the EBITDA
a 19% premium to the sector average
assets traded at a discount. on an EV/NTM EBITDA basis. Over
growth for IPPs, as subsector market
consolidation, including the merger of
Chart 4: Market capitalization weighted average EV/NTM EBITDA Chart 5: Adjusted market capitalization weighted EBITDA CAGR
trading multiples for select utilities (Q1 2013–Q1 2018) for select utilities2
45.0x 6.3%
40.0x
35.0x 5.2%
4.7%
30.0x 4.3%
25.0x 4%
3.3% 3% 3.2%
20.0x
15.0x 2.2%
1.7%
10.0x
5.0x
0.0x
Mar Mar Mar Mar Mar Mar T&D Integrated Renewables Water Sector
2013 2014 2015 2016 2017 2018
T&D Renewbales Integrated IPP Five-year historic EBITDA CAGR Two-year forward EBITDA CAGR
Water and wastewater Sector
Sources: Bloomberg, EY analysis.
Note: The valuations analysis only contains pure-play publicly listed companies in each relevant market segment.
2
istoric EBITDA CAGR: five-year (Q1 2013–Q1 2018) compound annual growth rate (CAGR) of select utilities’ market capitalization weighted adjusted EBITDA;
H
two-year forward EBITDA CAGR: two-year forward from Q1 2018 compound annual growth rate (CAGR) of select utilities’ market capitalization weighted adjusted EBITDA.
Power transactions and trends: Q1 2018 | 9Vistra Energy and Dynegy and the private equity takeover sector have been consistent, allowing the companies to
of Calpine, does not provide for a significant population be not only consistent dividend payers but also reliable
for analysis. sources of modest dividend growth. This highlights
ongoing demand for these assets. The US$1b merger
Water and wastewater assets traded at an average
of Connecticut Water Service (CWS) and SJW Group
EV/NTM EBITDA multiple of 14.5x, a 19% premium to
demonstrated these assets’ premium valuations — the
the historic average multiple of 12.2x. The water and
implied offer was 17.7% higher than CWS’s share price.
wastewater EV/NTM EBITDA multiple traded at a premium
Over the past five years, the CAGR of EBITDA grew at a
of 15% to the average sector valuations. Capital spending
rate of 4%, with analysts predicting a CAGR of 3% over the
and subsequent earnings growth across the water utility
next two years.
10 | Power transactions and trends: Q1 2018M&A capital outlook and investment hotspots
• Increasing momentum in respectively). This development In March, DPL Inc. sold around
renewables: US-based NextEra highlights that utilities are 1 GW of generation assets for
plans to invest US$2.1b in wind increasingly looking to M&A as a US$241m — the deal saw the
energy through 2020, while Duke cheaper way to fund investments company’s senior unsecured debt
Energy will invest US$425m in for infrastructure upgrades.3 In ratings upgraded from Ba3 to Ba2.
renewables during 2018. A deal an interview with Miles Huq, Aqua We expect other companies to
that will see Canada Pension America Chief Financial Officer make similar moves through 2018.
Plan Investment Board acquire David Smeltzer emphasised the
• Brazil to attract investors: Buyers
US$582.3m of NextEra wind and importance of growth through
are expected to be interested
solar assets is set to close in acquisitions.
in the sale of a stake in state-
Q2 2018. Utilities are planning
• Focus remains on integrated owned utility, Eletrobas, as well
solar investments to take advantage
assets: These assets will remain as government plans to invest
of the federal solar investment tax
attractive to buyers. Financial US$300m to develop renewable
credit before it drops permanently
sponsors are rumored to be energy plants in Brazil’s northeast.
to 10% after 2021. Total planned
interested in acquiring US
solar capex is expected to be • Energy reforms in Argentina:
electricity retailer Puget Energy,
US$9.7b in 2018, US$10.7b in The Compania Administradora
whose business is valued at US$7b.
2019 and US$9.5b in 2020. del Mercado Mayorista Electrico
Meanwhile, CenterPoint Energy
SA (Cammesa) is planning to
• Increasing focus on water utilities: announced plans to acquire
deregulate Argentina’s wholesale
Q1 2018 saw three water utility US electricity retailer Vectren
electricity market to cut subsidies
deals with a combined disclosed for US$8.5b.
and rationalize power prices.
value of US$1b. The announced
• Continued exit from merchant
merger of CWS and SJW Group
generation: Companies are
saw the unusual occurrence of
shedding merchant generators in
both utilities receiving unsolicited
favor of T&D and renewable assets
bids (from Eversource Energy
that offer safe, stable returns.
and California Water Service,
3
Please note, at the time of publication, both unsolicited takeover bids were rejected.
EY Americas Transaction Advisory Services P&U contacts
Miles Huq Robert Leonard Lucio Teixeira
EY Global Transactions P&U Leader US Southeast TAS Latin America South TAS
US Northeast TAS P&U Leader Power & Utilities Leader Power & Utilities Leader
Baltimore, Maryland, US Charlotte, North Carolina, US Sao Paulo, Brazil
+1 410 783 3735 +1 704 335 4236 +55 11 2573 3008
miles.huq@ey.com rob.leonard@ey.com lucio.teixeira@br.ey.com
Stephanie Chesnick Robert A Jozwiak Rafael Aguirre Sosa
US TAS Power & Utilities Leader US Central TAS Latin America North TAS
Houston, Texas, US Power & Utilities Leader Power & Utilities Leader
+1 713 750 8192 Chicago, Illinois, US México, D.F., Mexico
stephanie.chesnick@ey.com +1 312 879 3461 +52 55 5283 8650
robert.jozwiak@ey.com rafael.aguirre@mx.ey.com
Mitch Fane
US Southwest TAS Gerard McInnis
Power & Utilities Leader Canada TAS Power & Utilities Leader
Houston, Texas, US Calgary, Alberta, Canada
+1 713 750 4897 +1 403 206 5058
mitchell.fane@ey.com gerard.mcinnis@ca.ey.com
Power transactions and trends: Q1 2018 | 11The US water and wastewater sector
is on the brink of transformative
change, with huge investment needed
to upgrade aging infrastructure.
Miles Huq — EY’s new Global P&U
Transactions Advisory Leader — spoke
to David Smeltzer, Chief Financial
Officer at Aqua America to get his
perspective on the sector.
David Smeltzer is Executive Vice
President and Chief Financial Officer
for Aqua America, Inc. In this role,
he oversees all financial functions
including accounting, tax, treasury,
planning, Sarbanes-Oxley compliance
and capital spending in regards to
return on investment.
change
Waves of
12 | Power transactions and trends: Q1 2018Collaborative Growth + capital = economies of scale to deliver the
best solution for the rehabilitation
approach to long-term success of the American water system.”
regulatory change Once a small regional utility, Aqua “Our nation’s water and wastewater
America is now one of the US’s infrastructure is not at an acceptable
David Smeltzer joined Aqua America in
biggest, serving three million people standard for a country like the US. We
1986 and held various leadership roles
across eight states. Smeltzer says expect to be part of that correction —
before moving into his current position
growth through acquisitions is critical. it’s just a matter of time.”
of Chief Financial Officer. Aqua is one of
the US water sector’s strongest utilities, “Growth creates economies of scale,
delivering steady dividends and some of which delivers savings and keeps Never accept the
the industry’s highest yields. rates in check. You need growth
and capital together to create the status quo
But the line between steady and
best outcome over the long term.” David Smeltzer retires this October
stagnation can be a fine one. In the
1990s, when regulatory inertia Aqua’s dedicated integration but his passion for the sector he’s
threatened to cripple growth, team has been a key element of helped shape shows no sign of waning.
Smeltzer led the charge for sweeping ensuring smooth transactions. Being “I see tremendous opportunities in US
changes including the Distribution transparent is also important, says water. It’s a business in continuous
System Improvement Charge (DSIC). Smeltzer, especially when bills may growth.”
rise post-sale.
“We needed major continuous Lessons learned over his career
capital investment to replace aging “Government officials go into the sale include the importance of treating
infrastructure and found ourselves process with eyes wide open. We employees well — “they are where it all
filing rate cases too frequently. The tell them what their bills will be over happens” — as well as a timely call to
introduction of DSIC allowed utilities the next 10 years, including rate action for a sector in transformation.
to more proactively replace aging increases relative to capital that
“Never accept the status quo. We’ve
infrastructure for our customers and we’ll deploy, and how we’ll create
done over 300 acquisitions, we’ve
recover returns on capital investment water of a better, safer quality.”
initiated scores of regulatory changes
through regularly updated bill
Private sector investment in US and continuous improvement
surcharges, rather than waiting
water can be controversial, but through rethinking commission
for costly rate cases.
recent incidents such as that in Flint, practices and rethinking our internal
“We worked collaboratively with public Michigan have opened the door to practices.
utility commissions (PUCs) to adapt new opportunities.
“When practices need to change, don’t
regulation to changing conditions.
“The time when municipalities can bully your way through — do it in a
You don’t want to try to dictate
provide water services at a lower cost collaborative way.”
change but work together to
than the private sector is coming to a
address the issue.” “It’s about making life better for
close. Regulated companies bring our
everyone.”
Introducing Miles Huq
Miles Huq became EY Global Transactions P&U Leader
in April 2018. Based in the Northeast US region, Miles
has more than 20 years’ experience in corporate
finance, with a particular focus on power and utilities.
Power transactions and trends: Q1 2018 | 13Power transactions and trends Q1 2018
Europe
Megadeal set to restructure
German electricity market
In Q1 2018, the European power and utilities (P&U) sector transactions of a similar nature, as traditional utilities in
achieved a record deal value of US$61.3b, with 96% of this Europe continue to feel pressure from renewable energy,
attributed to renewables, transmission and distribution oversupply and declining demand.
(T&D), and integrated assets. The largest announced deal
Beyond this deal, Q1 2018 saw US$6.2b attributed to T&D
of the quarter — E.ON’s acquisition of Innogy — contributed
assets (financial sponsors contributed US$4.7b or 76%),
more than 76% of deal value. The deal sees E.ON
US$6.3b in renewable energy deals and US$1.3b in water
acquiring Innogy, with a series of asset swaps between
and wastewater deals.
E.ON and RWE to follow. If the transaction completes,
RWE will focus solely on generation, and E.ON will control Chart 6: Europe deal value and volume, by segment*
networks and retail, with a strategic focus on intelligent (announced asset and corporate-level deals, Q1 2016–Q1 2018)
networks. Though the deal sees RWE swap its regulated 70 65
asset base, it is still expected to improve the company’s 60 55
stand-alone business risk profile with approximately 50%
Number of deals
50 45
of its operating EBITDA (earnings before interest, tax, 40 35
US$b
depreciation and amortization) coming from contracted 30 25
generation. The transaction will increase E.ON’s regulated 20 15
asset base from US$28.4b to US$45.6b, with a customer 10 5
base of 50 million across Europe. 0 –5
Q1 Q2 Q3 Q4 Q1 Q2 Q3 Q4 Q1
This complex deal is not expected to complete until the third 2016 2016 2016 2016 2017 2017 2017 2017 2018
quarter of 2019. When final, it will trigger a fundamental Generation Renewables T&D Integrated
shift in the German power market, ending the era of Water and wastewater Others Deal Volume
vertically integrated utilities as the two largest utilities Source: EY analysis based on Mergermarket data.
double down on one subsegment and focus on scale. *Note: The E.ON, Innogy and RWE deal involves renewable, generation and network
Analysts predict that, if successful, the deal may spark more assets and is categorized as integrated deal. Deal value is as announced in
Mergermarket based on debt and equity components.
US$61.3b 76%
deal value, more than four of deal value contributed by
times that of Q4 2017 E.ON/Innogy deal (US$46.6b)
14 | Power transactions and trends: Q1 2018Q1 2018 transactional highlights
• Renewable energy continues to in Spain by the second half of • Utilities bet big on energy
attract investment: The quarter 2018. E.ON will partner with storage: EDF has announced it will
saw 30 clean energy deals with a Nissan to explore opportunities invest US$10b to develop 10 GW
total value of US$6.3b. in EV charging and energy of battery storage assets through
storage. Fortum has entered into 2035. Centrica plans to develop
• All-time low in conventional
partnership with Hungarian utility 1 MW of battery storage at its UK
generation deals: Q1 2018
NKM National Utilities to expand headquarters.
hosted just two deals in gas and
EV charging infrastructure in that
coal assets, which were acquired
country. The Russian Government
by corporate investors for
announced support for the
undisclosed values.
development of an EV charging
• More investment in electric network as part of plans to replace
vehicle (EV) technology: Enel Moscow’s bus fleet with electric
announced plans to develop a buses by 2021.
network of charging stations
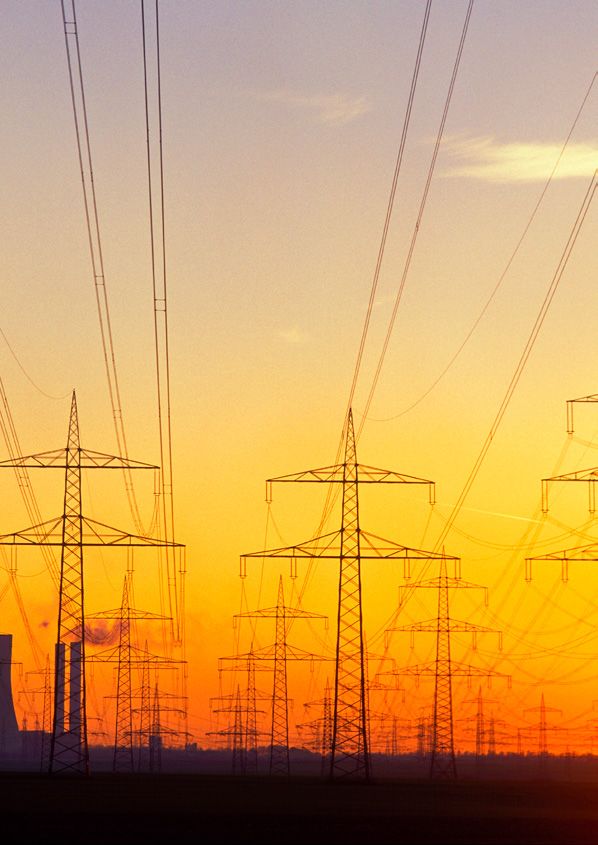
Power transactions and trends: Q1 2018 | 15Europe regional capital flows, Q1 2018
Image 3: Investment activity in Europe by country, (Q1 2018)*
UK Luxembourg
Investment value Investment value
US$0.7b (1%) US$0.9b (2%)
Investment value
US$5.2b (55%)
Belgium Rest of the region
Investment value
Germany Investment value
US$1.2b (13%)
US$0.5b (Valuations snapshot
During Q1 2018, the T&D assets traded at a current Integrated assets traded at a current
weighted market capitalization market capitalization weighted
European P&U sector average EV/NTM EBITDA multiple of average EV/NTM EBITDA multiple of
traded at a current market 11.1x, a 6% premium to the historic 7.2x, a 14% discount to the historic
average multiple of 10.5x. The average multiples of 8.4x. Over the
capitalization weighted
current multiple was at a premium past five years, the CAGR of EBITDA
average EV/NTM EBITDA of 27% to the current average sector was -3.9%, reflecting pressure on
(enterprise value by next valuations, demonstrating a favorable earnings of major utilities; however,
investor sentiment toward this asset analysts predict some upside with
12 months’ earnings before class. Over the past five years, the the CAGR growing to 0.8% for the
interest, tax, depreciation compound annual growth rate (CAGR) next two years – a trend in line with
and amortization) multiple of EBITDA grew at 0.2%, similar to the observations that the European
0.8% CAGR forecasted for the next energy sector sees limited value in
of 8.7x, a 17% discount two years. integrated assets.
to the long-term historic Renewable assets traded at a current
average multiple of 10.6x. market capitalization weighted
average EV/NTM EBITDA multiple of
T&D and renewable 11.4x, a 38% discount to the historic
companies traded at a average multiple of 12.8x. The
EV/NTM EBITDA traded at an 11%
premium to the sector
premium to average sector valuations,
multiples: It appears reversing the trend of the previous
that sentiment toward two quarters. The five-year CAGR of
EBITDA was 4.3%; however, analysts
integrated assets is weak, predict this to slow to 2.3% for the
as these traded at the next two years.
biggest discount to sector
averages.
Chart 7: Market capitalization weighted average EV/NTM Chart 8: Adjusted market capitalization weighted EBITDA CAGR
EBITDA trading multiples for select utilities (Q1 2013–Q1 2018) for select utilities4
25x 4.3%
20x 2.3%
1.2%
0.8% 0.8%
15x 0.2%
10x
5x –2.8%
–3.9%
0
Mar Mar Mar Mar Mar Mar T&D Integrated Renewables Sector
2013 2014 2015 2016 2017 2018
T&D Renewables Integrated Sector Five-year historic EBITDA CAGR Two-year forward EBITDA CAGR
Source: Bloomberg, EY analysis.
Note: The valuations analysis only contains pure-play publicly listed companies in each relevant market segment.
istoric EBITDA CAGR: five-year (Q1 2013–Q1 2018) compound annual growth rate (CAGR) of select utilities’ market capitalization weighted adjusted EBITDA;
H
4
two-year forward EBITDA CAGR: two-year forward from Q1 2018 compound annual growth rate (CAGR) of select utilities’ market capitalization weighted adjusted EBITDA.
Power transactions and trends: Q1 2018 | 17M&A capital outlook and investment hotspots
• Renewables to remain investment • Increased investment in storage: • Central and Eastern Europe
priorities: Spain’s Iberdrola will Enel will build a 22 MW/12.5 MWh to attract increasing energy
invest US$14.1b in renewable lithium-ion storage system in investments: Under the 2017
energy projects through 2022 — Germany after signing a US$21m initiative EU4Energy, the EU will
37% of its capex spend over that agreement with German wind finance projects focused on energy
period. In a US$220m deal, Enel will turbine manufacturer Enertrag security, efficiency and renewable
acquire Parques Eolicos Gestinver, and Swiss energy storage provider energy in Armenia, Azerbaijan,
a Spanish company with 132 MW of Leclanché. ENGIE has acquired a Belarus, Georgia, the Republic of
wind capacity. majority stake in French hydrogen- Moldova and Ukraine. Moldova
based power storage firm Electro has already commenced policy
• Policy support for renewables to
Power Systems. discussions around energy efficiency
continue: The EU has extended
reforms. In February, Norway’s
its 20% renewable target by • Focus on EV charging: The UK’s
Statkraft signed agreements to buy
2020 to 35% by 2030. In France, National Grid plans to build super
and resell electricity from three
the government will simplify rapid charging stations at 50
Polish wind farms, with an 80 MW
administrative procedures to fast- motorway sites at an estimated
combined capacity, to boost its
track wind power projects and help cost of between US$618.5m and
onshore renewable energy and
meet its target of doubling installed US$1.2b. In Spain, Iberdrola will
market operations.
wind generation capacity to 26 GW install 25,000 EV charging points
by 2023. by 2021.
EY Europe Transaction Advisory Services P&U contacts
Miles Huq Grigory Arutunyan Stéphane Kraft
EY Global Transactions P&U Leader Commonwealth of Western Europe and Maghreb TAS
Baltimore, Maryland, US Independent States P&U Leader
+1 410 783 3735 TAS P&U Leader Paris, France
miles.huq@ey.com Moscow, Russia +33 1 55 61 09 28
+7 495 641 2941 stephane.kraft@fr.ey.com
Arnaud De Giovanni grigory.s.arutunyan@ru.ey.com
EMEIA TAS P&U Leader Michael Bruhn
Paris, France Umberto Nobile Nordics TAS P&U Leader
+33 1 55 61 04 18 Mediterranean TAS P&U Leader Copenhagen, Denmark
arnaud.de.giovanni@fr.ey.com Milan, Italy +45 2529 3135
+39 02 8066 93744 michael.bruhn@dk.ey.com
Remigiusz Chlewicki umberto.nobile@it.ey.com
Central & Southern Europe
TAS P&U Leader Andreas Siebel
Warsaw, Poland Germany, Switzerland and Austria
+48 22 557 7457 TAS P&U Leader
remigiusz.chlewicki@pl.ey.com Düsseldorf, Germany
+49 211 9352 18523
andreas.siebel@de.ey.com
18 | Power transactions and trends: Q1 2018Power transactions and trends: Q1 2018 | 19
Power transactions and trends Q1 2018

  Asia-Pacific
     Chinese merger boosts a slower quarter

The Asia-Pacific power and utilities (P&U) sector continues                             China remains the region’s growth story, with both
to be a region of contrasts, marked by the varying investment                           domestic and outbound deals and a greater focus on
drivers of diverse economies. In Q1 2018, total deal                                    greenfield investment in Q1 2018. In one example, General
value in the region cooled to US$5.8b, from a Q4 high of                                Nuclear Power announced plans to build 3 GW of offshore
US$13.8b. Volume in the region also declined 46% to 27 —                                wind capacity in the country. China also hosted the region’s
the lowest in three-and-a-half years.                                                   largest deal of the quarter — the announced merger of the
                                                                                        coal generation assets of GD Power and China Shenhua.
Chart 9: Asia-Pacific deal value and volume, by segment                                 This was a strategic move prompted by the Chinese
(announced asset and corporate-level deals, Q1 2016–Q1 2018)                            Government’s supply side reform that aims to shed excess
                                                                 60
                                                                                        generation capacity and enhance operating efficiencies.
       50
                                                                                        The resulting company, China Energy Group, will emerge as
                                                                 50
       40                                                                               a generation giant with 78 GW of coal generation capacity.
                                                                      Number of deals

                                                                 40
       30
                                                                                        India is continuing to focus on renewable energy as the
US$b

                                                                 30
       20                                                                               country works toward a 2020 target of 100 GW of installed
                                                                 20
                                                                                        solar. In a push to meet the target, the government
       10                                                        10
                                                                                        recently introduced a “rent-a-roof” policy where developers
       0
             Q1   Q2   Q3   Q4   Q1   Q2   Q3   Q4   Q1
                                                                 0                      can rent residential rooftops and offer a solar lease to each
            2016 2016 2016 2016 2017 2017 2017 2017 2018                                household. The central government has also announced
            Generation     Renewables     T&D       Integrated                          a US$3.5b subsidy program to incentivize rooftop solar
            Water and wastewater    Others        Deal volume                           through 2022.
Source: EY analysis based on Mergermarket data.

               $
                                   US$5.8b                                                                     76%
                                    deal value, a decrease of                                                  of total deal value contributed
                      $
                             $      58% quarter-on-quarter                                                     by Q1’s biggest deal

20      | Power transactions and trends: Q1 2018
Australia, a country that usually attracts significant M&A, Asia-Pacific is an interesting market to watch — upcoming
seems to be in a holding pattern. The federal government’s policy decisions (or indecision) will determine the state of
National Energy Guarantee policy has the potential to play for the remaining year.
significantly affect contracting arrangements in the
National Electricity Market, so investors are remaining
cautious.
Q1 2018 transactional highlights
• S
► harp drop in investment: Dongfang Energy announced plans 1 MW lithium-ion energy storage
Investment in the region decreased to build a US$7.3b concentrated pilot project in Changhua County,
58% from Q4 2017 to US$5.8b. solar plant (CSP) plant in Mongolia Taiwan. In Australia, the state
Deal value dropped 90% in with a total capacity of 2 GW. government of Victoria announced
renewables and 100% in integrated Another Chinese utility, Zhongmin plans to build two large-scale
assets quarter-on-quarter. Energy, will invest US$91.3m to batteries of capacity — 25 MW/
develop a 72 MW wind farm in 50 MWh and 30 MW/30 MWh — in
• Renewables drive deal volume:
China. In an auction in early April, partnership with the Australian
While the value of clean energy
Malaysia awarded utility solar Renewable Energy Agency (ARENA)
M&A fell in Q1, the volume of these
projects with a total capacity of and two consortia of energy
deals (10) made up the bulk of the
1,228 MW. companies as part of its Energy
quarter’s transactions.
Storage Initiative.
• Investment focus on energy
• Greenfield investment in
storage: Danish utility Ørsted
renewables increases: Chinese
A/S announced plans to set up a
energy firm SPIC Shijiazhuang
Power transactions and trends: Q1 2018 | 21Asia-Pacific regional capital flows, Q1 2018
Image 4: Investment activity in Asia-Pacific by country, (Q1 2018)*
Japan
China Investment value
Investment value US$0.3b (6%)
US$4.8b (83%)
Investment value
US$0.9b (32%)
India
Investment value
US$0.3b (6%)
Malaysia
Investment value
US$0.2b (7%)
Rest of the region
Investment value
Australia
US$0.4b (6%)
Investment value
Investment value
US$1.6b (55%)
US$0.2b (6%)
Total
Investment value
US$5.8b
Investment value
Top investment destinations Top outbound investing countries US$2.9b
*Note: Percentages may not add to 100% due to rounding.
Top five Asia-Pacific deals, Q1 2018
All deal values indicated are announced deals with disclosed enterprise values comprising equity and debt components.
Announcement Target Target country/ Bidder Deal value Bidder rationale Segment
date bidder country (US$)
1 March GD Power China/China GD Power 4.4b Joint venture is in line with the Generation:
Development Development Co. strategies of GD Power Development coal
Co., Ltd. (22 Ltd./China Shenhua and China Shenhua Energy to
subsidiaries); Energy Company reduce competition and improve
China Shenhua Limited Joint core competitiveness
Energy Company Venture
Limited (18
subsidiaries)
26 February Green Power Japan/US Pattern Energy 0.2b Helps PEGI enter Japanese Renewables:
Tsugaru GK Group Inc. (PEGI) renewables market, grow its wind
portfolio and enhance economics
16 March The Hub Power Pakistan/ Mega Conglomerate 0.2b Aligns with Mega Conglomerate’s Generation:
Company Limited Pakistan (Private) Limited plans to diversify its investment thermal
(16.83% stake) portfolio
29 January Sterlite Grid Ltd India/India Sterlite Power 0.2b Helps Sterlite Power strengthen its T&D:
(28.4% stake) Transmission position in the power transmission electricity
Limited market
22 January ReNew Power India/Canada Canada Pension 0.1b Helps CPPIB to enter Indian Renewables:
Ventures Pvt. Ltd. Plan Investment renewable energy market solar and
(6.3% stake) Board (CPPIB) wind
Sources: EY analysis based on Mergermarket data.
22 | Power transactions and trends: Q1 2018Valuations snapshot
The P&U sector traded T&D assets traded at a current average multiple of 11.8x. The EV/
market capitalization weighted NTM EBITDA multiple traded in line
at a current market average EV/NTM EBITDA multiple of with average sector valuations (1%
capitalization weighted 9.4x, a 12% discount to the historic discount). The five-year historic CAGR
average multiple of 10.7x. The of EBITDA was 13%, but analysts
average EV/NTM current multiple was also in line with predict this growth to slow to 3%
EBITDA (enterprise the current average sector valuations. over the next two years.
Over the past five years, the
value by next 12 compound annual growth rate (CAGR)
IPP assets traded at a current market
capitalization weighted average EV/
months’ earnings of T&D EBITDA was 1%, and analysts NTM EBITDA multiple of 9.1x, a 29%
before interest, tax, are forecasting some upside with the discount to the historic multiple of
expected CAGR increasing to 3% over 12.8x. The EV/NTM EBITDA multiple
depreciation and the next two years. traded at a 9% discount to the
amortization) multiple Renewable assets traded at a current sector average due to continuing
market capitalization weighted bearish market sentiment. Despite
of 9.5x during Q1, a
average EV/NTM EBITDA multiple of this, private equity investors remain
22% discount to the 11.3x, a 16% premium to the historic attracted to these assets as seen by
long-term historic average multiple of 10.7x. The EV/ the recent acquisition of The Hub
NTM EBITDA traded at a 20% premium Power Company (Hubco) by private
average multiple of to the average sector valuations due equity firm Mega Conglomerate who
12.2x. Renewables to ongoing demand for these assets. paid a premium of 9.2% over Hubco’s
Over the past five years, the CAGR closing share price one day prior to
traded at a premium to of EBITDA was 5%, with some upside the deal announcement. Over the last
sector multiples, while forecasted as CAGR is estimated to five years, the CAGR of EBITDA was
reach 6% for the next two years. 2%; however, analysts are forecasting
all other assets traded an upside in growth that will see this
Integrated assets traded at a current
at a discount. market capitalization weighted figure reach 6% over the next two
average EV/NTM EBITDA multiple of years.
8.1x, a 32% discount to the historic
Chart 10: Market capitalization weighted average EV/NTM Chart 11: Adjusted market capitalization weighted EBITDA CAGR
EBITDA trading multiples for select utilities (Q1 2013–Q1 2018) for select utilities5
40.0x
35.0x 13% 12%
30.0x
25.0x
20.0x
6% 6%
15.0x
5%
10.0x 3% 3% 3%
5.0x 2%
1%
0
Mar Mar Mar Mar Mar Mar T&D IPP Integrated Renewables Sector
2013 2014 2015 2016 2017 2018
T&D Renewbales Integrated IPP Sector Five-year historic EBITDA CAGR Two-year forward EBITDA CAGR
Sources: Bloomberg, EY analysis.
Note: The valuations analysis only contains pure-play publicly listed companies in each relevant market segment.
Historic EBITDA CAGR: five-year (Q1 2013–Q1 2018) compound annual growth rate (CAGR) of select utilities’ market capitalization weighted adjusted EBITDA;
5
two-year forward EBITDA CAGR: two-year forward from Q1 2018 compound annual growth rate (CAGR) of select utilities’ market capitalization weighted adjusted EBITDA.
Power transactions and trends: Q1 2018 | 23M&A capital outlook and investment hotspots
• Consolidation in Indian renewable in India to meet increasing demand • Vietnam emerges as an investment
energy market to drive deal with an investment of US$309m. hotspot: Investors are keen to
activity: Solar auctions in India Japanese multinational SoftBank capitalize on ongoing market
have driven a sharp decline in solar Group and Chinese solar energy reforms. Local company Thien Tan
tariffs, which is eroding investor company GCL System Integration Group plans to develop 1,000 MW
returns and has the potential Technology have entered into a of solar capacity through 2021 with
to push a trend toward market US$930m joint venture to develop an investment of US$2b. Thai solar
consolidation. Renewable company, 4 GW of solar energy in India. Italy’s energy company Superblock has
Greenko, is in talks to purchase Enel plans to invest more than announced it will invest US$650m
Orange Renewables, an India-based US$290m in a new 285 MW wind in building three offshore wind
wind and solar energy producer, for power farm in Gujarat. The Indian farms with a total capacity of
an expected price of US$1b. Indian state of Tamil Nadu is expected to 700 MW. Another Thai energy
conglomerate Shapoorji Pallonji tender for 1.5 GW each for solar and company, Gulf Energy Development,
Group has put its entire solar wind energy projects during 2018. plans to develop a US$66m solar
portfolio of more than 400 MW farm through a joint venture with
• Thermal power under pressure:
on the market, while Essel an undisclosed domestic firm.
Under its Renewable Energy 3020
Infraprojects, part of another Sterling and Wilson, an India-based
plan, the South Korean Government
conglomerate (Essel Group), plans engineering, procurement and
has committed to retire 2.3 GW of
to sell 215 MW of solar capacity. construction (EPC) company, has
coal-fired capacity and not authorize
announced plans to construct
• India to remain a greenfield any new licenses for coal-fired
300 MW of solar PV plants with
investment hotspot: India’s plants. The plan also requires
an investment of US$250m by
renewable energy market is also existing coal plants to reduce carbon
June 2019.
attracting greenfield investment, emissions by 40% by 2022 and
which is driven by strong policy 58% by 2030. In Japan,
support. Chinese solar developer Chubu Electric has announced that
LONGi Green Energy Technology has it will decommission 500 MW of
announced plans to set up a solar oil-fired generation and 220 MW of
equipment manufacturing facility gas-fired power.
EY Asia-Pacific Transaction Advisory Services P&U contacts
Miles Huq Alex Zhu Yo Takehana
EY Global Transactions P&U Leader Greater China TAS P&U Leader Japan TAS P&U Leader
Baltimore, Maryland, US Beijing, China Tokyo, Japan
+1 410 783 3735 +86 10 5815 3891 +81 3 4582 6623
miles.huq@ey.com alex.zhu@cn.ey.com yo.takehana@jp.ey.com
Nick Cardno Somesh Kumar Bum Choong Kim
Oceania TAS P&U Leader India TAS P&U Leader Korea TAS P&U Leader
Sydney, Australia New Delhi, India Seoul, Korea
+61 2 9248 4817 +91 11 6671 8270 +82 2 3787 4107
nick.cardno@au.ey.com somesh.kumar@in.ey.com bum-choong.kim@kr.ey.com
Gilles Pascual
ASEAN TAS P&U Leader
Singapore
+65 6309 6208
gilles.pascual@sg.ey.com
24 | Power transactions and trends: Q1 2018Power transactions and trends Q1 2018
Africa and
the Middle East
Renewable energy and nuclear power in the spotlight
Across Africa and the Middle East, the push toward clean African Development Bank’s (AfDB) New Deal on Energy
energy continues — but for very different reasons. for Africa aims to “light up and power Africa” and includes
a call for the continent’s countries to increase their share
In Africa, access to electricity remains a primary concern.
of GDP devoted to the energy sector from 0.3% to 3.4%
While The World Bank forecasts that 1 billion people in
by 2025. The Bank also announced that 100% of its 2017
Sub-Saharan Africa may gain access to electricity by 2040,
power sector investments were in renewables.
an estimated 530 million will remain without power. The
Chart 12: Forecasted nuclear capacity growth in the Middle East Chart 13: Africa and the Middle East deal value (announced
(2018–2028) asset and corporate level deals, 2010–Q1 2018)
16 7000
14 6000
12 15% 5000
10 4000
US$m
8
GW
3000
6
2000
4
1000
2
–
0 2010 2011 2012 2013 2014 2015 2016 2017 Q1
2018 2020 2022 2024 2026 2028 2018
Source: International Energy Outlook 2017. Source: Bloomberg New Energy Finance.
200 GW US$12b
planned renewables investment
solar development planned for
by the African Development Bank
Saudi Arabia — the world’s largest
in 10 central African countries
Power transactions and trends: Q1 2018 | 25Financing of African energy projects is heavily dependent home systems, announced the launch of a US$20m debt
on developmental institutions, such as the AfDB, but financing program to expand off-grid energy and service
we are seeing the private sector play a bigger role in provision in East Africa.
infrastructure development. In April, South Africa signed
In the Middle East, focus is on reducing reliance on oil. In a
a US$4.7b renewable energy contract with 27 renewable
landmark agreement that aligns with its Vision 2030 plan,
energy independent power producers (IPPs) that will
Saudi Arabia has signed a memorandum of understanding
account for 30% of the country’s electricity production.
(MoU) with Japan’s SoftBank Group to develop a US$200b
Africa is also attracting more investment in distributed solar power development. If completed, the solar plant
generation. In April, ENGIE completed the acquisition (for will be the world’s largest and see the region emerge as a
an undisclosed value) of Fenix International, an energy major solar power exporter. Nuclear electricity generation
company offering home solar systems. In January, Off in the Middle East is also set to increase from 3.6 GW in
Grid Electric, a US-based company providing rooftop solar 2018 to 14.1 GW by 2028. Saudi Arabia plans to construct
in Africa, raised US$50m in venture capital financing to 16 nuclear power reactors over the next 20 to 25 years at
move into Ghana in partnership with EDF. Also in January, a cost of more than US$80b.
Azuri Technologies, a UK-based provider of PayGo solar
Q1 2018 transactional highlights
• Foreign investors acquire local central Africa. Canada’s Reservoir UK-based private equity (PE)
companies to expand into Capital Corporation acquired a firm, plans to invest at least
Africa: investors from the US, 60% stake in Nigerian hydropower US$250m to develop gas-fired
Japan and the UK conducted company Kainji Power Holding and renewable power in Africa to
four deals worth US$0.4b in Limited. achieve 1 GW installed capacity
African integrated, water and by 2019. UK PE firm Helios
• Greenfield transactions in
wastewater, and renewables Investment Partners, together
renewables continue: Sterling
companies. The Commonwealth with African Infrastructure
and Wilson, a global solar EPC
Development Corporation, a Investment Managers, has
company, is planning a 54.3 MW
UK state-owned development invested US$30m in Starsight,
solar plant in Zambia. French
finance institution, in partnership a Nigeria-based energy services
utility Voltalia plans to build
with A P Moller Capital’s Africa company. South African Water
two small hydropower plants in
Infrastructure Fund, acquired Works, a consortium of a South
Morocco with capacities of 9.8 MW
Zambian transmission and African infrastructure fund and
and 7.2 MW, respectively. In June,
generation company Copperbelt other strategic investors, has
Dubai will launch a tender to build
Energy Corporation for US$385m acquired Sembcorp Silulumanzi
its first hydroelectricity power
to expand renewable energy Pty Ltd, which provides water
plant with installed capacity of
generation in that country. ENGIE and wastewater services in South
250 MW.
acquired two West African energy Africa, and a 73.4% stake in water
services companies — Afric Power • Financial sponsors accelerate and sanitation company Sembcorp
and Tieri — to set up a regional investments in Africa: Denham Siza Water for US$67.7m.
platform to expand into west and Capital Management LP, a
26 | Power transactions and trends: Q1 2018Top five Africa and the Middle East deals, Q1 2018
Bidder company/country Target country Project description Segment
SoftBank/Japan Saudi Arabia Signed a MoU to build world’s largest US$200b solar park in Renewables: solar
Saudi Arabia
EleQtra and ENGIE/Africa and France Ghana Developing a US$120m 50 MW wind project in Ghana’s Renewables: wind
Greater Accra Region
ENI/Italy Egypt Developing a 50 MW solar power plant for US$50m Renewables: solar
South Korean investors/South Korea Iran Investing US$44m in a 17 MW solar power plant Renewables: solar
Iberdrola SA/Spain Qatar Investing US$12.4m in a research and development center Renewables
to expand its clean energy business in the Middle East
M&A capital outlook and investment hotspots
• Policies and regulations will further US$346m pumped storage hydro • Egypt to remain attractive
boost renewables: As part of its Solar power plant in Morocco. In Iran, investment destination: In January,
Power Project Plan 2030, Saudi South Korean investors plan to invest UAE-based Masdar and Japan’s
Arabia aims to produce 200 GW of US$44m in a 17 MW solar power Marubeni Corp. agreed to develop
solar power by 2030. Morocco is plant, and Italian renewable energy 800 MW of wind power in Egypt.
planning to develop an additional services provider Maresca Group has Italy’s Eni has tendered for the
1.5 GW of wind and solar generation announced it will construct two development of a 50 MW solar plant
capacity by 2020 to achieve its target 100 MW solar PV parks. with a total investment of US$50m,
of 42% renewable energy by 2020. while The World Bank is providing
• Increased focus on rooftop PV:
Bahrain has raised its renewable guarantees of up to US$102.6m
d.light, a Kenya-based off-grid
energy target from 5% to 10% by for the construction, operation and
solar product distributor, has
2035 and has mandated installation maintenance of six Egyptian solar
secured US$25m of funding from
of solar panels on new buildings. parks totaling 250 MW.
the European Investment Bank to
• Increased focus on nuclear power distribute “solar kits,” which include • Ghana emerges as new investment
generation: Sudan is developing a a solar panel, battery, LED lightbulbs hotspot: ENGIE and EleQtra, a
road map for nuclear and has signed and a recharging device, to enable company that develops power and
a contract with Russia to build nuclear households to access energy without transportation projects in sub-
power in the first half of 2019. relying on the grid. In a similar Saharan Africa, will invest US$120m
Russia is also in early discussions scheme, telecommunications giant to develop a 50 MW wind project
with Ethiopia about developing a Orange is partnering with UK-based in Ghana’s Greater Accra Region
nuclear energy program. The Kenya renewable energy firm BBOX to roll by early 2019. Yam Pro Energy, an
Nuclear Electricity Board is planning out up to half a million solar kits Israel-based clean energy company,
the development of a nuclear energy in four African nations by 2023. and India’s Shapoorji Pallonji Group
plant by 2027 at an estimated In Nigeria, Rensource Energy has plan to build a 150 MW wave-power
cost of US$5b. launched the country’s first solar station for US$18m. Solar PV
micro-utility project to provide provider Off Grid Electric has secured
• Foreign investment to continue: In
power to over 12,000 shops in Kano. US$55m in venture capital funding to
January, France’s VINCI Construction
expand into Ghana.
won a contract to construct a
EY Africa and the Middle East Transaction Advisory Services P&U contacts
Miles Huq Bruce Harvey David Lloyd
EY Global Transactions P&U Leader Africa TAS Power & Utilities Leader Middle East TAS Power & Utilities Leader
Baltimore, Maryland, US Johannesburg, South Africa Riyadh, Saudi Arabia
+1 410 783 3735 +27 11 772 5352 +966 11 215 9852
miles.huq@ey.com bruce.harvey@za.ey.com david.lloyd@sa.ey.com
Power transactions and trends: Q1 2018 | 27You can also read