Precarity and the pandemic - COVID-19 and poverty incidence, intensity, and severity in developing countries
←
→
Page content transcription
If your browser does not render page correctly, please read the page content below
WIDER Working Paper 2020/77

Precarity and the pandemic

COVID-19 and poverty incidence, intensity, and severity in
developing countries

Andy Sumner,1 Eduardo Ortiz-Juarez,2 Chris Hoy3

June 2020
Abstract: This paper makes a set of estimates for the potential impact of the COVID-19 pandemic
on poverty incidence, intensity, and severity in developing countries and on the distribution of
global poverty. We conclude there could be increases in poverty of a substantial magnitude—up
to 400 million new poor living under the $1.90 poverty line, over 500 million new poor living
under the poverty lines of $3.20 and $5.50. Further, the global income shortfall below each poverty
line could expand by up to 60 per cent; the daily income losses could amount to $350m among
those living under $1.90 per day and almost $200 million among the group of people newly pushed
into extreme poverty. Finally, we present country-level poverty estimates that show the location
of global poverty is likely to shift towards middle-income countries and South Asia and East Asia.
Our estimates are indication of the range of potential outcomes. If anything, our estimates show
the extent of precarity in developing countries and the fragility of much poverty reduction to any
economic shock.
Key words: COVID-19, crisis, global poverty, precarity, SDGs, vulnerability
JEL classification: I32
Acknowledgements: We would like to thank Giovanni Valensisi for the comments.

1King’sCollege London, 2King’s College London, 3Australian National University. Corresponding author:
andrew.sumner@kcl.ac.uk
This study has been prepared within the UNU-WIDER project on Academic Excellence.
Copyright © UNU-WIDER 2020
Information and requests: publications@wider.unu.edu
ISSN 1798-7237 ISBN 978-92-9256-834-4
https://doi.org/10.35188/UNU-WIDER/2020/834-4
Typescript prepared by Lorraine Telfer-Taivainen
United Nations University World Institute for Development Economics Research provides economic analysis and policy advice
with the aim of promoting sustainable and equitable development. The Institute began operations in 1985 in Helsinki, Finland, as
the first research and training centre of the United Nations University. Today it is a unique blend of think tank, research institute,
and UN agency—providing a range of services from policy advice to governments as well as freely available original research.
The Institute is funded through income from an endowment fund with additional contributions to its work programme from
Finland, Sweden, and the United Kingdom as well as earmarked contributions for specific projects from a variety of donors.
Katajanokanlaituri 6 B, 00160 Helsinki, Finland
The views expressed in this paper are those of the author(s), and do not necessarily reflect the views of the Institute or the United
Nations University, nor the programme/project donors.
1 Introduction

Much attention has, understandably, focused on the health-related aspects of the COVID-19
pandemic and on the potential magnitude of the contraction in countries’ economic output. The
impact that unemployment and labour income shocks as a consequence of the lockdown measures
can exert on poverty rates in developing countries has received relatively less attention to date.
This is concerning because many developing countries are characterised by fragmented social
protection systems often decoupled from the informal labour market where much of the
population works. Any lockdown likely implies the income-generating capacities of this group of
people in particular are very limited.

This paper builds on the initial discussion of Sumner et al. (2020) and presents estimates of the
potential short-term impact of the pandemic on poverty in developing countries using a range of
shocks in household per capita consumption or income. 1

The shocks are contrasted with the World Bank’s poverty lines of $1.90, $3.20, and $5.50 a day 2—
equivalent, respectively, to the median values of the national poverty lines among low-income,
lower-middle-income, and upper-middle-income countries (see Jolliffe and Prydz 2016). Our
approach implicitly focuses on precarity or vulnerability-to-poverty. Specifically, we use an
augmented poverty line approach and make use of the World Bank’s PovcalNet built-in dataset of
harmonised household surveys across 166 economies. Unless otherwise stated, all monetary
amounts in this paper are expressed in international dollars at 2011 purchasing power parity (PPP)
exchange rates.

The paper comes with the set of limitations one would expect. Importantly, our estimates are a
range of potential outcomes. The final poverty outcome will be determined by what governments
do, the precise income shock in each country, and the duration of the crisis. Moreover, we make
the simplifying assumption that the effects of contractions in household per capita incomes or
consumption are distribution neutral, even though there is good reason to believe that the poor
and near poor in developing countries will be disproportionally affected as the share of informal
jobs, particularly impacted by lockdowns, is significant and interacts with absent or deficient social
protection systems. Finally, there are crucial non-monetary poverty impacts in the dimensions of
health, education, and living conditions that are not captured in our range of estimates.

This paper makes three contributions to the nascent literature on the welfare impacts of COVID-
19 on households in low- and middle-income countries. Firstly, we move beyond other studies on
this topic that have only focused on a subset of countries (e.g., ILO 2020a, 2020b; Vos et al. 2020a,
2020b; Laborde et al. 2020) or have relied on the April 2020 IMF WEO forecasts for economic
growth (e.g., Lea 2020; Maher et al. 2020; Valensisi 2020) that assume the crisis will ‘fade’ after
June 2020 (IMF 2020: 1). We do so by considering a range of scenarios of the depth of the
economic crisis. Secondly, we extend the discussion by providing estimates of the aggregate
consumption shortfall below the $1.90, $3.20 and $5.50 poverty lines brought about by the crisis,
which in most of our scenarios is in excess of $100 million a day. Thirdly, we add detail about the

1
 Some countries have income data and others have consumption data in the dataset exploited. As poverty rates tend
to vary in the same country when using either income or consumption, and in order to avoid a misleading
interpretation, we refer simply to ‘welfare’.
2
 A new series of 2017 PPP exchange rates was published in May 2020 and thus these poverty lines will be revised to
$2.10, $4.00, $6.30 a day, respectively (see Atamanov et al. 2020).

 1
country level impact of COVID19 and illustrate there will likely be a dramatic spike in poverty
rates in some of the middle-income countries that have made significant progress in recent years.

This paper is structured as follows: Section 2 discusses our methodology and reviews the other
poverty estimates we are aware of, paying special attention to why we chose not to use a method
based on country-specific GDP per capita growth forecasts. Sections 3 and 4 present the estimates
at the global and regional levels and discuss how the crisis may shift the overall pattern of global
poverty. Section 5 focuses on national-level poverty impacts across the developing world. Section
6 concludes.

2 Methodology

2.1 Our approach

Our range of estimates of the potential impact of COVID-19 on monetary-based poverty uses the
World Bank’s PovcalNet built-in dataset of harmonised household surveys. PovcalNet provides
information on nationally representative per capita income or consumption measures for 166
developing and advanced economies, and hence allows for the computation of the extent of
poverty at an internationally comparable basis through well-known indices such as the poverty
headcount ratio, the poverty gap, and the squared poverty gap (see Foster et al. 1984). 3

The reference year, or status quo, for our estimates is 2018, for which per capita income or
consumption measures are available for the 166 countries. India is the only exception, as its latest
available extrapolated measure corresponds to 2015. 4 Given the lack of more recent information
for this populous country, we acknowledge that computing its potential short-term poverty
changes using the welfare measure recorded in 2015 as a baseline could somewhat inflate the
estimates, though the opposite may also be the case. The poverty rate in India could be lower given
the sustained decline in poverty that the country has been experiencing since 1990, from about 48
per cent of the total population in that year to just above 13 per cent by 2015, according to the
$1.90 a day poverty line. However, how exactly the poverty rate changed between 2015 and 2018
is highly contentious. Felman et al. (2019) discuss the leaked report of India’s National Sample
Survey (NSS) that had been withheld by the government (the long-standing survey has now been
abandoned). The survey showed real consumption per capita had fallen by 3.7 per cent between
2011/12 and 2017/18. This figure sits uneasily with the official GDP growth data reported for the
same period. In short, by using the 2015 data our estimates could overestimate poverty in 2018 in
India if the GDP growth data is correct. On the other hand, if the NSS consumption per capita
data is accurate, our estimates will thus underestimate it.

We use three scenarios of a contraction in per capita income or consumption as a consequence of
the lockdown set in place to contain the spread of the COVID-19 disease: 5, 10, and 20 per cent
contraction. Although apparently arbitrary at first sight, the chosen contractions are closely related

3
 These series are typically employed by the World Bank to report reference-year estimates of global and regional
aggregates of poverty. As noted by Castañeda et al. (2019), since many countries have no available survey data in every
year, extrapolations or interpolations of household per capita income or consumption are required to estimate poverty
figures in a given reference year that is common to all countries in the dataset.
4
 Our estimates at the global and regional level in this paper differ slightly from those we reported previously in
Sumner et al. (2020). In our initial work we based our estimates on region-level data using 2018 as reference year for
all regions, with the only exception of South Asia for which the reference year was 2015. In this current paper we
based our estimates on national-level data.

 2

to recent estimates of potential economic downturns and seek to capture a range of shocks
associated. At the lower end, our 5 per cent contraction scenario is just above the updated 2020
forecast for mid-April 2020 from the International Monetary Fund (IMF) projecting a cross-
country median decline of 4.8 per cent in gross domestic product per capita. Among developing
countries, the per capita decline in the median economy is estimated at 4.2 per cent, whereas among
advanced economies the corresponding projected decline is 7.5 percent. 5 Our moderate scenario,
which involves a 10 per cent contraction, is in line with recent estimates by the ADB (2020) based
on a model of the effect of the pandemic on global GDP growth being contained within a six-
month timeframe—the time it takes from outbreak intensifying to normalizing economic activity
post-lockdown.

In the case of our worst scenario, a contraction of 20 per cent is close to the OECD estimates that
a partial or complete nation-wide lockdown could result in a contraction ranging between 15 and
35 per cent among 48 major economies, with a 25 per cent short-term decline in the median
economy across developing and advanced economies (OECD 2020). In addition, estimates by
Goldman Sachs of the effects that lockdowns could exert on the economy suggest that the type
or length of measures implemented by Italy and South Korea are associated, respectively, with an
output contraction of 25 and 10 per cent. They also estimate an output contraction of 45 per cent
in the case of India in the April-June 2020 period. 6

Given that we do not observe income or consumption for each individual included in the
PovcalNet database, we capture our contraction scenarios and their effect on poverty rates by
focusing implicitly on precarity or vulnerability-to-poverty and following an augmented poverty
line approach. Specifically, as the PovcalNet database allows the user to compute poverty rates at
whatever value of the poverty line , we increase such value, namely , by the corresponding
contraction in per capita income/consumption measures (with = 5, 10, and 20 per cent
contractions) as

 =
 (1 − )

For example, to determine the increase in poverty of a contraction of 10 per cent in individuals’
welfare, we inflate the value of the poverty line of $1.90 a day to $2.11 a day, then calculate the
headcount at this line and subtract that at the original line. For the three contraction scenarios, we
thus employ the augmented values of the poverty lines of $1.90, $3.20 and $5.50 a day. These
augmented poverty lines will capture the same number of people falling into poverty as would be
recorded if each individual’s income or consumption was observed and then contracted by a rate
 to compute new poverty rates.

It is important to highlight that our approach has some important limitations. First, we use
extrapolated series of individuals’ welfare to our reference year, 2018, which is likely biasing the
true poverty rates for such year. Only 29 out of the 166 countries for which the estimates are made
have a household survey for 2018, while for the remaining 137 countries extrapolation was

5
 per cent changes in gross domestic product per capita at constant prices, adjusted by purchasing power parity, as
reported in the April 2020 update of the IMF’s World Economic Outlook Database. The simple average per capita
decline across all countries is 4.7 per cent, and 3.9 and 7.7 per cent, respectively, when looking separately at developing
and advanced economies.
6 Goldman Sachs’ estimates cited in ‘The 90% economy that lockdowns will leave behind’, The Economist, 20 April

2020, and ‘India’s economy set to contract by 45%, Goldman says’, The Financial Times, 18 May 2020.

 3
performed. Extrapolation however assumes both that each country’s mean income or
consumption in the closest survey year will grow towards 2018 at the rates recorded in the national
accounts and that such growth will occur evenly across the entire distribution (Castañeda et al.
2019).

Second, there are pernicious impacts of the crisis beyond changes in welfare levels that could have
long-lasting effects on human development and capabilities, chiefly health, education, and
nutrition. For instance, UNDP (2020: 6) estimates a global decline in a COVID-19-adjusted
version of the human development index mostly driven by the education dimension, which could
mark the first decline since the inception of the index in 1990 and could be ‘equivalent to erasing
all the progress in human development of the past six years’. Moreover, it has been estimated that
approximately 470 million people globally are at high risk of contracting COVID-19 as a result of
pre-existing conditions of malnutrition, lack of access to safe drinking water, and indoor air
pollution through the use of noxious cooking fuel (Alkire et al. 2020). Those impacts on human
development and capabilities are not captured in our estimates. Neither do our estimates include
the policy changes to social protection programmes that governments of many developing
countries have introduced or adapted, or are planning to introduce or adapt, in response to the
pandemic (see Gentilini et al. 2020).

Thirdly, we assume that the contractions are distribution neutral, but it is not unreasonable to
expect that among the poor and near poor they are bigger in the short-run, with a sluggish recovery
and by many multiples potentially, than economy-wide forecasts. This is especially so in low- and
middle-income countries where the share of informal jobs, particularly affected by lockdown
measures, 7 is significant and interacts with pre-existing social protection systems that are
fragmented and whose benefits are typically linked to formal labour markets. 8 In light of this, we
consider that our 10 and 20 per cent contraction scenarios provide a better picture of the potential
adverse impacts on those living near the bottom of the distribution regardless of the size of the
economy-wide contraction (see Mahler et al. 2020, who also acknowledge this).

Fourthly, there is a further issue of how closely GDP per capita declines are correlated to a
household per capita welfare contraction; and that the pass through is unlikely to act symmetrically
during positive and negative GDP growth (see discussion in Valensisi 2020). It is also worth noting
that financial market crises tend to hit GDP figures worse than household welfare. In contrast,
economy-wide shutdowns may actually impact the latter more disproportionately.

In sum, we do not know which of our contraction scenarios will be closest to the final outcome,
nor how changes in consumption or income will differ across countries. The final poverty outcome
will be determined by what governments do, the duration of the crisis, and the precise income
shock in each country and how it distributes across the different sectors. Our estimates are

7
 ILO (2020b) projects that just the first month of the crisis could mean the earnings of informal workers would
decline by 82 per cent in low- and lower-middle-income countries, and by 28 per cent in upper-middle-income
economies. See also Hatayama, Viollaz and Winkler (2020) who construct a working from home index for 53
developing and advanced economies, showing that informal workers have jobs that are less amenable to working from
home, and that such amenability is positively correlated with the country’s level of economic development. A similar
finding is provided by Dingel and Neiman (2020) who also show that the share of jobs that could be performed at
home is less than 25 per cent for most developing countries.
8
 Estimates of workers in informality who cannot rely on employment-based social protection programs reach 60 per
cent of the world’s employed population or 80 per cent of total workers in developing countries. See, respectively,
ILO (2018) and Packard et al. (2019).

 4
indications of orders of magnitude and should be read not as predictions but as a range of potential
outcomes.

2.2 Comparisons with other studies

Some existing studies have provided insights into the potential damaging consequences of the
COVID-19 pandemic in terms of poverty outcomes. Starting with a focus on the working
population, a first study by ILO (2020a) models the impact of the pandemic on labour income
using a set of scenarios of potential macroeconomic impacts of COVID-19. It estimates an
increase in working poverty, as measured at the $3.20 a day poverty line, of 8.8 to 35 million new
working poor under a low- and a high-contraction scenario, respectively, with 15 per cent of the
new poor living in low-income countries and the remaining share in both lower-middle- and upper-
middle-income economies. 9 In a second study covering 64 countries, ILO (2020b) estimates that
the loss of earnings among informal workers as a result of the pandemic could increase the share
of those who earn less than 50 per cent the median earnings, or relative poverty, from 18 to 74 per
cent among low- and lower-middle-income countries, and from 26 to 47 per cent in upper-middle-
income countries.

In another set of studies, Vos et al. (2020a, 2020b) and Laborde et al. (2020) use a global
computable general equilibrium model combined with household-level models for more than
300,000 households from 31 developing countries, mainly from sub-Saharan Africa (SSA) and
South Asia, to assess the welfare effects of changes in growth. In the first study, Vos et al. report
that a decline of one percentage point in GDP could increase poverty, as measured at the $1.90 a
day poverty line, by about 14 million people, with two thirds of the new poor living in rural areas.
In their second, more comprehensive analysis that models whether the economic slowdown occurs
through productivity or trade disruption, they show that a one percentage point decline in GDP
could result in up to 22 million new poor. Finally, Laborde et al. estimate that, absent interventions,
there could be 140 million new poor as a result of COVID-19 in 2020, of which 80 million would
be in SSA and 42 million in South Asia.

Without restricting the analysis either to workers or to specific developing regions, the United
Nations’ Department of Economic and Social Affairs uses the global economy forecasts from its
World Economic Forecasting Model and estimates that a total of 34.3 million people could fall
below the $1.90 a day poverty line globally—in comparison to a baseline of just below 630 million
poor people in 2019 (UN 2020). Also pursuing a global coverage and moving away from modelling
techniques, Lea (2020), Mahler et al. (2020), and Valensisi (2020) exploit the PovcalNet dataset, as
our paper does, to quantify the impact of COVID-19 on global poverty using the IMF’s per capita
growth forecasts produced in mid-April 2020.

As Table 1 below shows, the results of the latter studies are somewhat consistent in orders of
magnitude with our own estimates of the poverty impact at $1.90 a day under the 5 per cent
contraction scenario. Specifically, we project that 80 million people could fall into extreme poverty
as a result of the decline in per capita income or consumption, thus moving the world’s absolute
incidence upwards from 727 million in the status quo to 807.5 million, and the poverty headcount
ratio from 9.9 per cent to 11 per cent. This latter rise of 1.1 percentage points in the relative
incidence is close to that computed by Lea, Mahler et al., and Valensisi, who estimate an increase
in the world’s headcount ratio ranging 0.8 to 1 percentage points.

9
 The low and high contraction scenarios used by ILO correspond, respectively, to a GDP growth decline of about
two and eight per cent, as estimated by McKibbin and Fernando (2020).

 5
When comparing the incidence and absolute changes in all four studies, some differences become
evident which stem from factors beyond methodological choices. Notably, the baselines for pre-
crisis poverty incidence differ. We use a figure of 727 million people that results from aggregating
country-level totals for the reference year 2018, whilst Lea employs an estimate of 670 million
people that was projected to be the total number of poor by end-2020 in the absence of the
pandemic –according to a model based on the partial growth elasticity of poverty changes using
PovcalNet’s poverty headcounts and the IMF’s pre-crisis per capita growth forecasts. Lea adjusted
this model according to the updated IMF growth projections and thus the end-2020 estimates
changed to 742 million people, yielding 72 million additional poor people than would otherwise
been the case. Mahler et al. use a baseline of 603.1 million people in 2020 that results from
extrapolating the welfare measures in PovcalNet’s household surveys with the pre-crisis growth
forecasts. After updating this extrapolation according to the IMF’s new projections, they estimate
the total number of poor by 2020 to reach 665 million, thus an extra 61.9 million poor in
comparison with the baseline. Finally, Valensisi follows the augmented poverty line approach used
in Sumner et al (2020) and in this paper and compute an increase in poverty of 68.6 million
resulting from adjusting the poverty line by a rate that reflects the IMF’s pre- and post-crisis growth
forecasts, thus yielding absolute headcounts of, respectively, 642.3 and 710.8 million poor.
Table 1: Estimates of the impact of COVID-19 on global $1.90 poverty according to different approaches

Notes: astatus quo based on PovcalNet’s country-level extrapolated data from the closest survey year towards
the reference year 2018 for 166 countries with the only exception of India for which the reference year used in the
estimates is 2015. b Status quo based on projected poverty figures using GDP per capita growth rates forecasted
in the absence of the COVID-19 crisis. All sets of figures are based on PovcalNet data. All three approaches are
distribution-neutral.
Source: authors’ estimates based on PovcalNet.

A more important difference between these studies and our estimates relates to the size of the
contraction assumed. In contrast to Lea’s, Mahler’s et al., and Valensisi’s approaches, we choose
not to use the IMF’s updated growth forecasts for a number of reasons. On one hand, the GDP
per capita growth forecasts average the equivalent to a contraction of just 1.9 per cent in the top-
10 countries by number of poor people, jointly accounting for 472.6 million, or 65 per cent, of the
world’s poor in 2018—including positive growth rates in Uganda and in populous Ethiopia and
India, which together are home of a fifth of the world’s population. As these studies apply the
forecasts evenly across the countries’ population, an IMF’s projected positive growth rate of, for

 6
instance, 0.55 per cent for India, would imply that millions of people will avoid poverty during a
pandemic.

Using these relatively modest country-level contractions, and even positive growth figures,
forecasted by the IMF to build global poverty estimates seems optimistic. These forecasts are based
on the COVID-19 pandemic ending in the second half of 2020 as IMF (2020: 1) notes, ‘[i]n the
baseline scenario, which assumes that the pandemic fades in the second half of 2020 and
containment efforts can be gradually unwound’. Since the release of these forecasts, lockdowns
have been extended well beyond what was thought to be the case throughout the developing world.
For example, the positive growth forecast by the IMF for India was based on the nationwide
lockdown announced on 24 March ending in mid-April, however at the time of writing (31 May
2020) this lockdown is still in place in many countries to greater or lesser degrees, which is three
times longer than anticipated in the IMF growth estimates. Some estimates suggest that lockdown
policies may be established as a new norm or open/shut economies for at least up to 2022 (Kissler
et al. 2020).

Furthermore, it is not unreasonable to expect that the household per capita income or
consumption contraction among the poor and near poor will be bigger in the short term. In light
of this, we consider a 5 per cent contraction in per capita welfare 10 to better capture the potentially
larger losses among the near-poor in developing countries—and even more so our 10 and 20 per
cent contraction scenarios, which implicitly assume a bigger shock at the bottom regardless of the
size of the economy-wide contraction.

Finally, as Sandefur and Subramanian (2020: 3-4) discuss, ‘IMF growth forecasts are a black box
… the IMF forecasts are an aggregation of subjective judgements made by the various area units
within the Fund, subject to consistency checks by the research department’. In short, instead of a
global model accounting for interdependency between countries or multiple recessions
concurrently in developed economies, country-level forecasts are made on an individual basis and
with methodologies that ‘vary from country to country and series to series’. These features could
also lead to inconsistencies when compared to other country-level forecasts. 11

3 Global estimates

Figure 1 presents the poverty headcount ratios and absolute number of poor at different poverty
lines for 1990–2018 and our estimates based on the three different scenarios of contraction in per
capita income/consumption. Starting with extreme poverty, as measured at $1.90 a day, the data
reveals that a 5, 10, and 20 per cent shock would push the relative incidence of global poverty
upwards for the first time since 1990, from 9.9 per cent of the world’s population in the status quo
to 11, 12.2, and 15.3 per cent, respectively. In absolute terms, these changes are equivalent to
between 80 and almost 400 million people falling into poverty at $1.90 a day (Table 2) and suggest
a reversal of seven to ten years progress in the fight against poverty reduction, depending on the
contraction, and the first absolute increase in people living in extreme poverty since 1999.

10
 As noted previously, this 5 per cent shock is slightly above the median GDP per capita contraction forecasted by
the IMF, both globally (-4.8 per cent) and among developing countries (-4.2 per cent).
11 See the World Economic Outlook Database website for an overall description of this approach and the assumptions

made. For instance, the IMF forecast a GDP per capita contraction of 2.9 per cent and 0.5 per cent in Malaysia and
Indonesia in 2020, respectively, whereas the revised World Bank’s (2020) projections point to even deeper declines:
4.6 per cent and 3.5 per cent, respectively.

 7
Figure 1: Global poverty incidence at $1.90, $3.20, and $5.50 a day: 1990-2018 and estimates under a 5, 10, and
20 % per capita income/consumption contraction (% of world’s population and millions of poor)

Note: dashed lines after 2018 represent the estimated increase in the incidence of poverty for each poverty line
under the income/consumption contraction scenarios, with the lower, middle, and upper dashed lines
representing, respectively, the 5, 10, and 20 per cent contraction.
Source: authors’ estimates based on PovcalNet.

Using the $3.20 a day poverty line, equivalent to the median value of the poverty lines among
lower-middle-income countries, the estimates suggest an increase from 24.7 per cent in the status
quo to 26.5 per cent under a 5 per cent shock and up to 32.6 per cent in the worst-case scenario.
This implies that the number of people considered poor by the $3.20 a day poverty line would
expand by 133 to 576 million. Finally, when employing the $5.50 a day poverty line—i.e., the
median value of the poverty lines among upper-middle-income countries—the relative incidence
could rise for the first time since 1993, from 43.4 per cent in the status quo up to just above half
of the world’s population (50.6 percent) under a 20 per cent contraction. By this standard, the
additional number of poor in comparison to the status quo could reach 124 to 527 million,
depending on the contraction scenario (Table 2), thus moving the absolute incidence back to the
levels recorded five to eight years ago.
Table 2. Absolute poverty incidence at $1.90, $3.20, and $5.50 a day and changes under a 5, 10, and 20 % per
capita income/consumption contraction (millions of people)

Source: authors’ estimates based on PovcalNet.

A further issue is that the worsening in people’s livelihoods as a consequence of the crisis could
result not only in a higher incidence of poverty but could also exacerbate both poverty intensity
and severity. Table 3 illustrates that the latter measure, reflected by the squared average per capita
poverty gap and typically interpreted as a measure of inequality among the poor, could increase in
comparison to the status quo by as much as 60 per cent among the extreme poor under the worst-
case scenario, and between 30 and 40 per cent for the higher poverty lines.

The poverty gap—defined in per capita terms to indicate the average shortfall in the
income/consumption measure as a percentage of the poverty line—could register similar

 8
magnitudes of increase under a 20 per cent contraction, ranging between 30 and 60 per cent
depending on the poverty line. The poverty gap is useful to reflect the total monetary cost to lift
the income/consumption of the poor up to the value of the poverty line, and hence its worsening
as a result of the crisis would imply a significant rise in such cost. This measure is often interpreted
as the total amount of money needed to eradicate poverty according to the poverty line used,
assuming a perfect allocation of resources among the poor and without including administrative
costs. For instance, looking at the figures for the $1.90 a day poverty line (Table 3), the average
shortfall in income/consumption in the status quo is 3.2 per cent of the poverty line, or $0.06 a
day. Given a world population of 7.36 billion 12 the resources needed to lift the poor’s incomes
would amount to a total of $445.8 million a day. Under a 20 per cent shock, a poverty gap of 5.1
per cent implies that such cost could therefore reach $707.4 million a day, equivalent to an increase
of 60 per cent in comparison to the status quo.
Table 3: Intensity and severity of poverty at $1.90, $3.20, and $5.50 a day under a 5, 10, and 20% per capita
income/consumption contraction (percentages)

Notes: the intensity of poverty is measured by the per capita poverty gap, defined as the average shortfall in
income/consumption (counting the non-poor as having zero shortfall) and expressed as a percentage of the
poverty line. The severity of poverty is measured by the squared per capita poverty gap and can be interpreted
as a measure of inequality among the poor, with a value of 100 indicating the maximum level of inequality. See
Foster, Greer, and Thorbecke (1984) for further details on these measures.
Source: authors’ estimates based on PovcalNet.

Next, we discuss the question how much welfare loss the existing and additional poor would
experience. According to our estimates, a contraction of 5 per cent in individuals’ welfare could
imply a loss of $8 million a day among those who would fall into extreme poverty. This relatively
moderate loss could multiply by a factor of 4.5 if the contraction reaches 10 per cent. In the worst-
case scenario, the income/consumption loss could drastically increase to almost $188 million a day
among the additional extreme poor, and to $461 to 725 million a day ($14 to 22 billion per month)
among the new poor at the higher poverty lines. 13 These losses, summarised in the panel a of
Figure 2, could be interpreted as the lower bound of a global economic compensation required to
mitigate the adverse effects of the crisis only among the new poor. In other words, these estimates
provide an indication of how much it would cost to bring levels of poverty back to what they were
prior to the COVID-19 crisis.

Among the existing poor, the potential monetary cost derived from the contractions could amount
to $73 to $345 million a day among the extreme poor, depending on the scenario, and up to $4.4
billion a day for the highest poverty line and worst-case scenario (see panel b of Figure 2).

12
 Based on the aggregation of country-level total number of poor people using the extrapolated series for 2018 for
165 countries and for 2015 in the case of India.
13
 As noted, all monetary values are in international dollars at 2011 PPP exchange rates.

 9
Figure 2: Income/consumption losses among the new and existing poor under a 5, 10, and 20% per capita
contraction ($ million a day)

Source: authors’ estimates based on PovcalNet.

4 The changing distribution of global poverty

Our contraction scenarios are, by design, applied equally across all countries. This implies that the
potential short-term increase in poverty would be generalisable, although it could be especially
marked in some regions compared to others depending on the poverty line utilised. The variation
is due to the share of the population within each region that lives just above the poverty line.
Figure 3 shows how the increase in poverty is distributed across six regions in the developing
world. Based on the $1.90 a day poverty line and a 20 per cent contraction, more than half of the
395 million additional extreme poor would be located in South Asia (SA), thus becoming the
hardest hit region in the world—mainly driven by the weight of populous India—followed by SSA
which would comprise 30 per cent, or 119 million, of the additional poor.

As the value of the poverty line increases, a larger share of the additional poor will be concentrated
in regions where the corresponding poverty line is more relevant given the average income level.
For instance, the regional distribution of the world’s poor changes drastically when looking at the
$5.50 a day poverty line—the median poverty line among upper-middle-income countries. At this
level, almost 41 per cent of the additional half a billion poor under a 20 per cent contraction
scenario would live in East Asia and the Pacific (EAP), chiefly China; a fourth would still reside in

 10
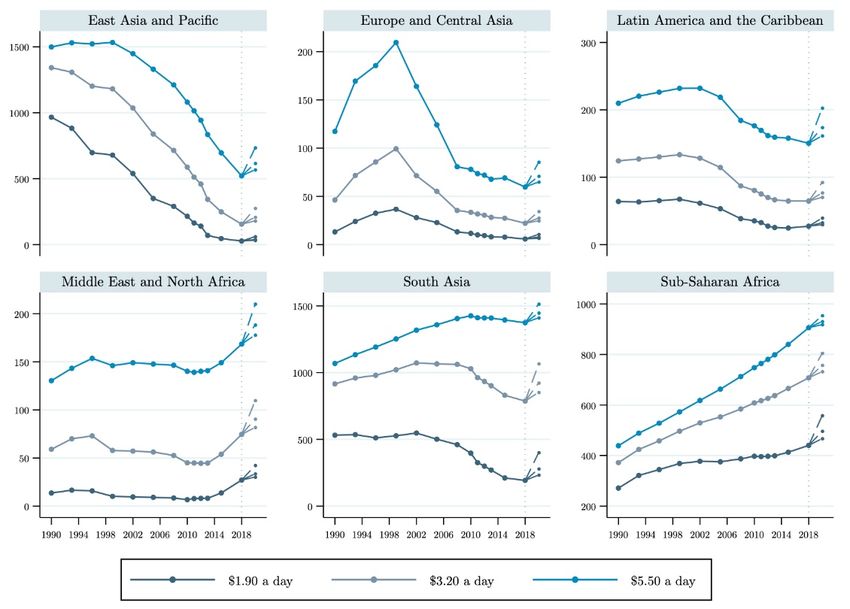
SA; and a combined 18 per cent would live in the Middle East and North Africa (MENA) and in
Latin America and the Caribbean (LAC), whose individual shares are close to that recorded for
SSA (9.2 percent). This distribution of the additional number of poor is somewhat similar to that
resulting from a 5 per cent or a 10 per cent contraction scenario.
Figure 3: Regional distribution of the additional number of poor at $1.90, $3.20, and $5.50 a day under a 5, 10,
and 20 % per capita income/consumption contraction (percentages

Notes: notice that the bars include a residual ranging 0.1–0.8%, depending on the line. These shares correspond
to the additional poor people living in a group of 28 advanced or high-income economies not included in the six
developing regions (see the list of these countries under the label ‘Other High Income’ or OHI in Castañeda et al.
2019).
Source: authors’ estimates based on PovcalNet.

How will the estimated increase in poverty affect past regional progress in poverty reduction?
Figure 4 plots regions’ absolute number of people living below the three poverty lines during
1990–2018, as well as our estimates under the contraction scenarios. The first notable finding is
that in regions that previously experienced moderate to fast poverty reduction, the current crisis
could lead to the first absolute increase in decades, regardless of the size of the per capita
income/consumption contraction: in EAP, the number of poor could rise for the first time since
1990 at both the $1.90 a day and $3.20 a day poverty lines, and since 1999 at the highest poverty
line; in SA, the potential increase would be the first recorded in the last two decades at the two

 11
lower poverty lines; and in LAC it would be the first rise since the early 2000s for all three poverty
lines.
Figure 4: Regional poverty incidence at $1.90, $3.20, and $5.50 a day; 1990-2018 and estimates under a 5, 10,
and 20 % per capita income/consumption contraction (millions of poor)

Note: dashed lines after 2018 represent the estimated increase in the incidence of poverty for each poverty line
under the income/consumption contraction scenarios, with the lower, middle, and upper dashed lines
representing, respectively, the 5, 10, and 20 per cent contraction.
Source: authors’ estimates based on PovcalNet.

A second finding is related to the magnitude of the reversal such increases would impose on the
regions’ progress in poverty reduction. In SA, a contraction of 10 per cent could erase the progress
of the last eight years in reducing poverty at $1.90 and $3.20 a day, whilst a contraction of 20 per
cent could potentially cause a return to the levels recorded in the second half of the 2000s. In LAC,
a 10 per cent drop in per capita income/consumption may wipe out a decade of relatively slow
progress in reducing $5.50 a day poverty, whereas a 20 per cent drop could take its absolute
incidence back to the 2005 level. A similar reversal of 10–15 years progress in reducing the
incidence of $5.50 a day poverty could also occur in Eastern Europe and Central Asia (ECA) under
a 20 per cent shock, whilst in EAP the potential reversal may not be beyond the levels observed
around five years ago. Finally, the absolute numbers of poor in 2018 in both MENA and SSA were
already the highest recorded during the period under study, regardless of the poverty line used, so
that even the lowest contraction of 5 per cent would set a new poverty high. These potential effects
that the current COVID-19 crisis could leave on poverty look more dramatic when focusing on
the composition of global poverty since 1990. Mainly as a result of three decades of accelerated
and poverty-reducing economic expansion in China, the combined contribution of South Asia and
SSA to global poverty at $1.90 a day moved from 43 per cent in 1990 to 87 per cent in 2018—a
contribution dominated by SSA since 2011 (see top of panel a of Figure 5). This latter proportion
is equivalent to a combined 633 million people living in extreme poverty in those regions ahead of
the pandemic. Under the assumption that per capita consumption drops by 5 per cent, such a
figure would jump back to just above 700 million poor, which is close to the level recorded around
2012; if the shock is 10 per cent instead, then the total would reach almost 780 million, or close to

 12
that observed back in 2010; and, if the scenario of a 20 per cent contraction takes place, then the
combined extreme poor in South Asia and SSA could be a startling new high of 960 million, or 86
per cent of the estimated 1.12 billion extreme poor globally—in SSA only, a contraction of this
magnitude could push the current incidence to above half billion people.

We also consider the composition of global poverty by countries’ income level. The graphs in
panel b of Figure 5 show the dramatic potential exacerbation of extreme poverty especially in
middle-income countries. Focusing on extreme poverty, the adverse consumption effects due to
the lockdown during the pandemic could erase the impressive reduction in the incidence in today’s
lower-middle-income countries achieved since 1999 by at least a decade, pushing the pre-crisis
number of poor upwards from 388 million up to 680 million people under the worst-case scenario.
The absolute incidence of extreme poverty in 2018 among currently classified low-income
countries (291 million poor) was already the highest recorded during the analysed period and was
about 55 per cent higher than the incidence observed back in 1990 (187 million poor).
Figure 5. Composition of the global poverty incidence at $1.90, $3.20 and $5.50 a day: 1990-2018 and estimates
under a 5, 10, and 20% per capita income/consumption contraction (millions of poor)

Source: authors’ estimates based on PovcalNet.

5 The pandemic’s new poor: country-level estimates

 13
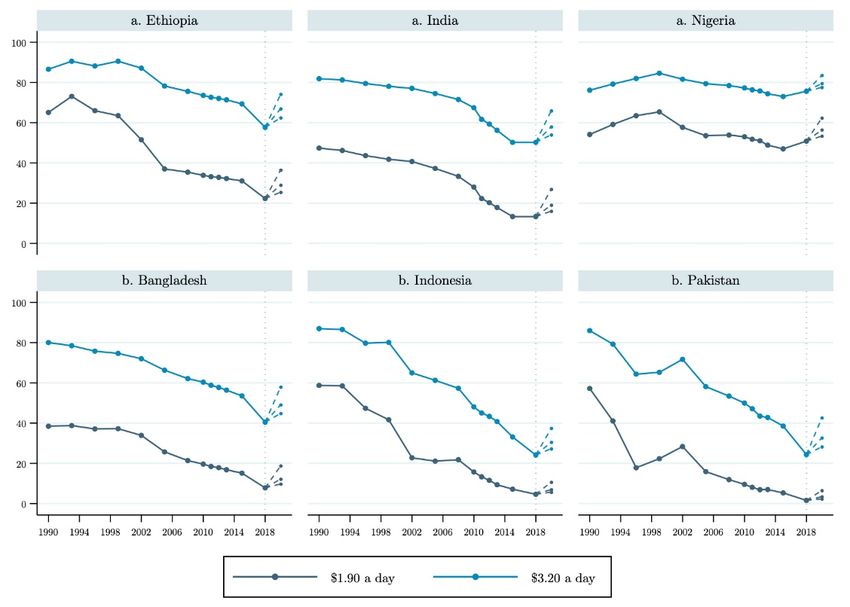
India plays a significant role in driving the potential increases in global extreme poverty
documented previously, comprising almost half the estimated additional poor regardless of the
contraction scenario (Figure 6). Nonetheless, there are other populous, low- and lower-middle-
income countries in SA, SSA, and EAP accounting for a sizeable share of the estimates: Nigeria,
Ethiopia, Bangladesh, and Indonesia come next, in that order, concentrating a total of 18–19 per
cent of the new poor, whereas the Democratic Republic of Congo (DR Congo), Tanzania,
Pakistan, Kenya, Uganda, and the Philippines could jointly add 11–12 per cent. Taken together,
these figures imply that three quarters of the additional extreme poor globally could be living in
just ten populous countries. 14
Figure 6: Top contributors to global poverty at $1.90 a day under a 5, 10, and 20% per capita
income/consumption contraction (millions of poor)

Source: authors’ estimates based on PovcalNet.

This high concentration of the additional extreme poor is staggering, although not necessarily
unexpected given the size of each country’s population. Yet, these results are significant for at least
two reasons. On one hand, the PovcalNet dataset shows that three of these ten countries (Ethiopia,
India, and Nigeria) were among the top ten by number of extreme poor people in 1990 and
remained within the ranks of that group until 2018. Despite this crude fact, two of these countries
have managed to achieve a sustained reduction in their incidence of poverty since the early 1990s,
namely Ethiopia and India, reaching their lowest poverty headcount ratio ever recorded at about
22 and 13 per cent, respectively (panel a of Figure 7). Nonetheless, the potential contraction in per
capita income/consumption imposed by the pandemic’s economic effects could erase some of
this progress.

Three countries, namely Bangladesh, Indonesia, and Pakistan, were also among the top ten by
number of poor in 1990. However, over the course of almost three decades Bangladesh has pushed
its extreme poverty headcount ratio from 38.5 per cent to 7.8 per cent, whereas Indonesia and

14
 Figure 6 plots the contributions of 11 countries. Uganda, but not the Philippines, could be among the top ten
contributors to additional global poverty under the 5 and 10 per cent contraction scenarios. Conversely, the
Philippines, but not Uganda, could be among the top ten when considering a contraction of 20 per cent in per capita
income/consumption. Table A3 in the annex presents the absolute numbers for the top 25 countries by number of
additional poor.

 14
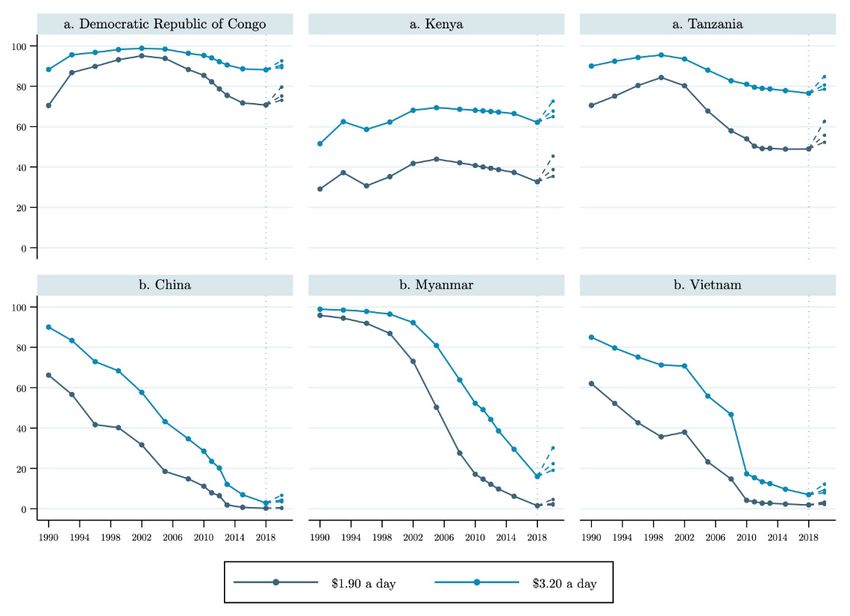
Pakistan did so from levels close to 60 per cent to 4.6 and 1.6 per cent, respectively (panel b of
Figure 7).
Figure 7: Poverty headcount ratios at $1.90 and $3.20 a day in selected top contributors to additional global
poverty; 1990-2018 and estimates under a 5, 10, and 20% per capita income/consumption contraction (% of
country’s population)

Note: dashed lines after 2018 represent the estimates increase in the incidence of poverty for each poverty line
under the income/consumption contraction scenarios, with the lower, middle, and upper dashed lines
representing, respectively, the 5, 10, and 20 per cent contraction.
Source: authors’ estimates based on PovcalNet.

The possibility that these countries concentrate a significant share of the new poor as a result of
the current COVID-19 crisis points not only to their population size (ranging between 160–270
million), but also suggests that much of their previously poor citizens moved just above the $1.90
a day poverty line, thus remaining in a position of high vulnerability to poverty in the face of
shocks. The risk that a sizeable share of near poor could fall into poverty following a per capita
income/consumption contraction is particularly distinct when looking at $3.20 a day poverty—
which seems a more appropriate standard given that these countries’ average welfare levels
position all of them within the group of current lower-middle-income economies.

The remaining countries that could be among the top contributors of additional extreme poverty
globally, namely DR Congo, Tanzania, Kenya, the Philippines, and Uganda, were not among the
top ten by number of extreme poor back in 1990, although they all were teetering on the verge of
joining that group. This risk eventually materialised by 2018 for four of them as a result of their
poverty headcount ratios remaining high and relatively stagnant, particularly so in DR Congo and
Kenya (panel a of Figure 8), while previously poorest, fast-growing economies in EAP such as
China, Myanmar, and Vietnam were recording major poverty reduction (panel b of Figure 8). 15

15
 As shown in Figure 8, the poverty headcount ratio in both China and Vietnam declined from above 60 per cent in
1990 to, respectively, 0.3 and 1.9 per cent in 2018, whereas in Myanmar the ratio moved from almost 96 per cent to
just below two per cent. These results are partially the consequence of the economic expansion these countries
experienced, with their GDP per capita growing at an average annual rate of above eight per cent in both China and

 15
The only exception is the Philippines which, although far from the current group of the ten poorest
countries and with an extreme poverty headcount ratio reaching a record low of 4.6 per cent in
2018, could add above six million new poor to the global count. This estimate again points to a
sizeable share of the non-poor population living just above the poverty line and suggests that
recent progress in the Philippines as well as in other countries has been relatively fragile.
Figure 8: Poverty headcount ratios at $1.90 and $3.20 a day in selected top contributors to additional global
poverty (panel a) and selected top ten poorest countries in 1990 (panel b); 1990-2018 and estimates under a 5,
10, and 20% per capita income/consumption contraction (% of country’s population)

Note: dashed lines after 2018 represent the estimated increase in the incidence of poverty for each poverty line
under the income/consumption contraction scenarios, with the lower, middle, and upper dashed lines
representing, respectively, the 5, 10, and 20 per cent contraction.
Source: authors’ estimates based on PovcalNet.

Finally, and as noted in the previous section, as the standard to quantify the incidence of poverty
increases in value, the additional poor as a result of the current crisis will tend to be concentrated
in populous places where the average per capita welfare is higher. For instance, moving to the
other end of spectrum, when measuring poverty by the median poverty line among upper-middle-
income economies, i.e., at $5.50 a day, the data reveal that Bangladesh, India, Indonesia, Pakistan,
and the Philippines would remain among the top ten contributors of additional poverty to the
global count, together accounting for more than a third of the total new poor across the different
contraction scenarios. At this highest poverty line, however, five other large countries in EAP,
MENA, and LAC could play a significant role by contributing an additional third of the new global
poor. These ten countries would comprise about 70 per cent of the total new poor regardless of
the contraction scenario, with the lion’s share accruing in both China and India (respectively, those
two countries could be driving a fourth and a fifth of the potential increase in the absolute number
of poor globally).

Myanmar, and 5.3 per cent in Vietnam. These three countries, plus Brazil, complete the top ten poorest countries in
1990 by number of poor.

 16
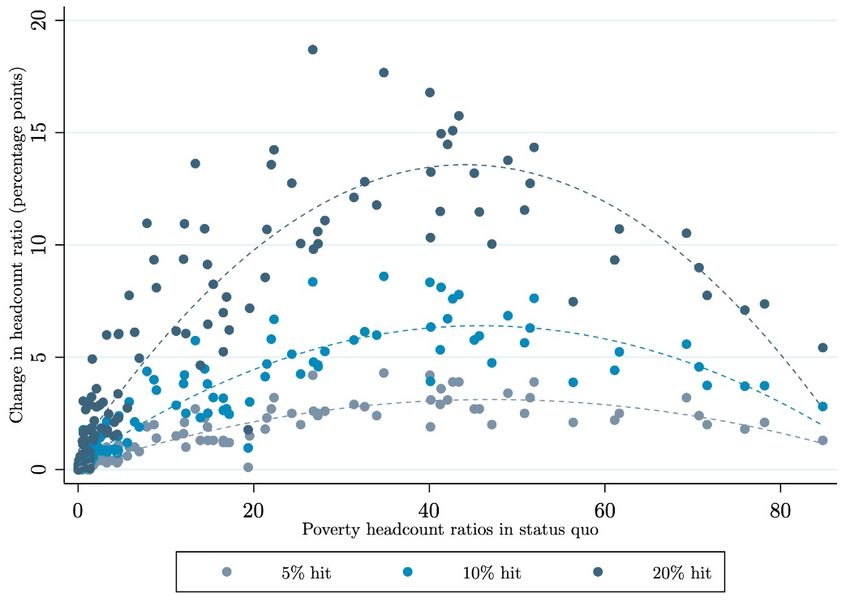
Figure 9. Top contributors to global poverty at $3.20 and $5.50 a day under a 5, 10, and 20% per capita
income/consumption contraction (millions of poor)

Source: authors’ estimates based on PovcalNet.

Figure 10: Top 20 largest increases in poverty headcount ratios at $1.90, $3.20, and $5.50 a day under a 5, 10,
and 20% per capita income/consumption contraction (percentage points)

Source: authors’ estimates based on PovcalNet.

Looking at the potential increases in terms of percentage points, relative to the poverty headcount
ratio in the status quo, and restricted to countries with a population of at least 10 million, Figure
10 shows that the increase could average at startlingly 13 percentage points under a 20 per cent
shock, and between three to six points for the lower contraction scenarios—regardless of the
poverty line used. Some already familiar patterns become evident again: many increases would
occur in low-income countries in SSA when looking at $1.90 a day, but as the value of the poverty
line increases the larger impacts would occur among middle-income countries and more evenly
across regions. Figure 11 illustrates the change in the poverty headcount ratio (in percentage

 17
points) versus the poverty headcount ratio of the status quo. Our estimates show that the effects
of each contraction scenario are not linear with the poverty headcount ratios prior to the COVID-
19 crisis—that is, the developing countries with smaller or larger amounts of poverty in the status
quo are relatively less impacted in percentage points, thus suggesting relatively worse outcomes
among lower-middle-income countries and pointing to the fragility of the progress they achieved
at each poverty line.
Figure 11: Change in poverty headcount ratio (percentage points) versus poverty headcount ratio in the status
quo

Source: authors’ estimates based on PovcalNet.

6 Conclusions

In this paper we presented estimates of the potential short-term impact of COVID-19 on both
the levels of monetary-based poverty in developing countries and the composition of global
poverty. The estimates are implicitly focused on precarity due to our augmented poverty line
approach (using the World Bank’s international poverty lines of $1.90, $3.20, and $5.50 a day).
Our estimates are based on scenarios of the potential contraction in per capita income or
consumption that could result from the lockdown measures undoubtedly necessary to keep the
spread of the COVID-19 under control, but which at the same time could exert pernicious effects
on the livelihoods of parts of the population whose income-generating capacities are restricted.
These effects could furthermore interact with pre-existing conditions of fragmented or insufficient
social protection systems.

Our contraction scenarios range from 5 to 20 per cent, in line with a set of short-term projections.
The estimated effects on poverty rates are intended to be indicative of a range in magnitude, not
predictions, of the potential increases in poverty. By being distribution-neutral and static, our
estimates omit household-level responses to said contractions, as well as labour market, social
assistance, and fiscal policy channels. Our estimates thus have important limitations. The real
poverty impacts ultimately will be determined by the precise per capita welfare shock in each
country, the duration of the crisis, and governments’ abilities to mitigate.

 18
Three main findings are worth highlighting. First, depending on the extent of the economic shock
from COVID-19, our estimates suggest that 80–395 million people could fall into extreme poverty
globally, whereas this number rises to 124–527 million people when considering the highest
poverty line of $5.50 a day. The potential increase in extreme poverty could mark the first absolute
increase in the global count since 1999—and the first since 1990 in terms of the headcount ratio.

Secondly, we show there could be not only an increased incidence of global poverty, but crucially
the intensity and severity of poverty is likely to rapidly increase. The resources needed to lift the
incomes of the poor to the poverty lines, as indicated by the poverty gap, could increase by 60 per
cent, from $446 million a day in the absence of crisis to above $700 million a day under a 20-
percent contraction. In most of our scenarios the global consumption shortfall is in excess of $100
million a day.

Third, our estimates show that poverty is likely to increase dramatically in middle-income
developing countries and there could be a significant change in the distribution of global poverty.
There could be much more new poverty not only in countries where poverty has remained
relatively high over the last three decades and also in countries that are not among the poorest
anymore, which points not only to their population size, but also suggests that much of their
previously poor people moved to just above the poverty line, thus implying that the recent progress
they achieved has been relatively fragile.

One important question our findings raise is whether the economic impact will be as significant
for poverty effects as the health-related aspects of the pandemic. As developing countries generally
have a lower proportion of people at higher risk in terms of age (>70 years), the economic shock
may be more significant. However, that said health systems in developing countries tend to be
weaker than those of advanced ones. Furthermore, higher COVID-19 morbidity and mortality
rates have been linked to hypertension and diabetes as well as to poverty, pollution, and
malnutrition, which could make populations of developing countries more vulnerable to the
COVID-19 disease (see, for instance, Schellekens and Sourrouille, 2020). There are also unclear
links between COVID-19 and other illnesses such as TB, HIV/AIDS, chronic malaria, and
respiratory problems due to indoor cooking. Nevertheless, the question emerges whether a
lockdown is the only option to contain the virus if the lockdown entails an income loss and
whether a lockdown would even be feasible in high density urban areas or when it causes people
to remain without income and thus without food. Dingel and Neiman (2020) estimate that the
share of jobs that could be performed at home is less than 25 per cent for the bulk of developing
countries—much lower than the above 40 figure recorded, for instance, in the US or Finland—
and as low as five per cent in countries such as Madagascar and Mozambique. Consequently, there
is a clear need for a range of social safety net policies which already exist in many developing
countries but whose coverage and funding needs to be expanded substantially as part of ‘pay-to-
stay home’ or ‘pay-to-test’ schemes.

Looking further ahead, the poverty impacts beyond 2020 are closely related to if or when a vaccine
is developed, how effective it is, who gets the vaccine and who does not (eventually culminating
in the question of who pays), and the time needed to roll out the vaccine. It is unlikely that the
crisis will end completely within 2020 and, conversely, very likely that the pandemic will proceed
in multiple waves. Currently, there are no vaccines available for any corona viruses, neither is there
an absolute guarantee of immunity after an infection. So, what if no vaccine against COVID-19 is
found or if it is less than 100 per cent effective? Even if we take the best-case scenario and a
vaccine could be discovered in two years’ time, it could take some yet uncertain amount of time
for it to be rolled out and to reach the entire global population. And even if a vaccine is developed,
there is no guarantee everyone would get it for free. Will we end up living in a new COVID-19
apartheid with the vaccinated and non-vaccinated residing in separate areas and working in

 19
You can also read


