Preclinical development of a miR-132 inhibitor for heart failure treatment
←
→
Page content transcription
If your browser does not render page correctly, please read the page content below
ARTICLE
                   https://doi.org/10.1038/s41467-020-14349-2               OPEN

                  Preclinical development of a miR-132 inhibitor
                  for heart failure treatment
                  Ariana Foinquinos1,10, Sandor Batkai1,2,10, Celina Genschel1,2, Janika Viereck1,2, Steffen Rump2,
                  Mariann Gyöngyösi3, Denise Traxler 3, Martin Riesenhuber 3, Andreas Spannbauer3, Dominika Lukovic3,
                  Natalie Weber4, Katrin Zlabinger3, Ena Hašimbegović3, Johannes Winkler3, Jan Fiedler1, Seema Dangwal1,
                  Martin Fischer5, Jeanne de la Roche 5, Daniel Wojciechowski5, Theresia Kraft4, Rita Garamvölgyi6,
                  Sonja Neitzel7, Shambhabi Chatterjee1, Xiaoke Yin 8, Christian Bär1, Manuel Mayr 8, Ke Xiao1 &
1234567890():,;

                  Thomas Thum 1,2,9*

                  Despite proven efficacy of pharmacotherapies targeting primarily global neurohormonal
                  dysregulation, heart failure (HF) is a growing pandemic with increasing burden. Treatments
                  mechanistically focusing at the cardiomyocyte level are lacking. MicroRNAs (miRNA) are
                  transcriptional regulators and essential drivers of disease progression. We previously
                  demonstrated that miR-132 is both necessary and sufficient to drive the pathological cardi-
                  omyocytes growth, a hallmark of adverse cardiac remodelling. Therefore, miR-132 may serve
                  as a target for HF therapy. Here we report further mechanistic insight of the mode of action
                  and translational evidence for an optimized, synthetic locked nucleic acid antisense oligo-
                  nucleotide inhibitor (antimiR-132). We reveal the compound’s therapeutic efficacy in various
                  models, including a clinically highly relevant pig model of HF. We demonstrate favourable
                  pharmacokinetics, safety, tolerability, dose-dependent PK/PD relationships and high clinical
                  potential for the antimiR-132 treatment scheme.

                  1 Institute of Molecular and Translational Therapeutic Strategies (IMTTS), Hannover Medical School, Carl-Neuberg-Str. 1, 30625 Hannover, Germany.
                  2 CARDIOR     Pharmaceuticals GmbH, Feodor-Lynen-Str. 15, 30625 Hannover, Germany. 3 Division of Cardiology, Medical University of Vienna, Waehringer
                  Guertel 18-20, 1090 Vienna, Austria. 4 Institute of Molecular and Cell Physiology, Hannover Medical School, Carl-Neuberg-Str. 1, 30625 Hannover, Germany.
                  5 Institute for Neurophysiology, Hannover Medical School, Carl-Neuberg-Str. 1, 30625 Hannover, Germany. 6 Department of Diagnostic Imaging and

                  Oncoradiology, University of Kaposvár, Guba S. Street 40, Kaposvár 7400, Hungary. 7 Axolabs GmbH, Fritz-Hornschuch-Straße 9, 95326 Kulmbach, Germany.
                  8 The James Black Centre, King’s College, University of London, 125 Coldharbour Lane, London SE5 9NU, UK. 9 REBIRTH Center for Translational Regenerative

                  Medicine, Hannover Medical School, Carl-Neuberg-Str. 1, 30625 Hannover, Germany. 10These authors contributed equally: Ariana Foinquinos, Sandor Batkai.
                  *email: Thum.Thomas@mh-hannover.de

                  NATURE COMMUNICATIONS | (2020)11:633 | https://doi.org/10.1038/s41467-020-14349-2 | www.nature.com/naturecommunications                                1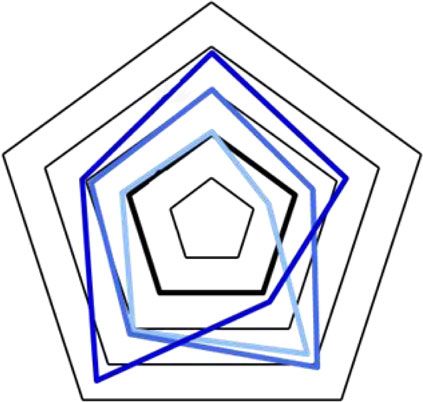
ARTICLE                                                                 NATURE COMMUNICATIONS | https://doi.org/10.1038/s41467-020-14349-2

A
        dverse structural remodeling of the left ventricle due to            the repolarization phase and expansion of the plateau phase,
        myocardial infarction (MI) is a common pathological                  mimicking the shape of AP of failing human ventricular
        feature leading to heart failure (HF)1. We previously                myocytes4,5. Treatment with antimiR-132 reconstituted AP
demonstrated increased cardiomyocyte expression of the miR-                  durations to normal values (Fig. 2c). AP amplitudes and upstroke
212/132 family during pathological cardiac conditions2. Trans-               velocities were not different between the groups (Fig. 2d, e),
genic mice overexpressing the miR-212/132 cluster (miR-212/                  suggesting sodium channels to be unaffected by miR-132. At all
132-TG) develop pathological cardiac remodeling and die pre-                 stimulation frequencies, miR-212/132-TG cardiomyocytes
maturely from progressive HF2. Using both knockout and anti-                 showed significantly slower times to peak (ttp) of calcium tran-
sense strategies, we have shown miR-132 to be both necessary and             sients in comparison to WT cardiomyocytes (Fig. 2f, g; Supple-
sufficient to drive the pathological growth of cardiomyocytes in a            mentary Table 2). Treatment of TG cardiomyocytes with
murine model of left ventricular pressure overload2. Based on the            antimiR-132 significantly accelerated ttp of calcium transients
findings, we propose that miR-132 may serve as a therapeutic                  (and different phases thereof) (Fig. 2g). Next, we measured sar-
target in HF therapy.                                                        comere shortening of ventricular cardiomyocytes at increasing
   Here we report mode of action details of a locked nucleic acid            pacing frequencies from wildtype, untreated and antimiR-132-
based antisense inhibitor of miR-132 (antimiR-132). We show                  treated miR-212/132-TG mice, to validate the role of miR-132 in
translational evidence for therapeutic efficacy both in vitro and             contractile function at the single cell level. MiR-132 over-
in vivo, in mice and in a clinically highly relevant pig model of            expression led to significant prolongation of ttp of sarcomeric
HF. Finally, we demonstrate evidence for the antimiR-132                     shortening at all stimulation frequencies in accordance to pro-
administration to be safe and well tolerated.                                longed calcium transients (Fig. 2h, i; Supplementary Table 3). In
                                                                             line with the observations above, calcium handling and sarcomere
                                                                             shortening exhibited changes similar to that observed in isolated
Results and discussion
                                                                             cardiomyocytes from human and animal models of HF6–9. Dis-
Reversal of HF in mice by miR-132 antagonism. To test the
                                                                             organization of the t-tubular network in HF and slowed
concept of miR-132 inhibition, we developed and optimized a
                                                                             down dyssynchronous activation of ryanodine receptors may
synthetic, locked nucleic acid mixmer antisense oligonucleotide
                                                                             account at least partially for the prolongation of intracellular
with fully phosphorylated backbone against miR-132 (antimiR-
                                                                             calcium transients and contractions as well as a reduced Serca2a
132). First, we tested this inhibitor in a target overexpression
                                                                             (Sarcoplasmic/Endoplasmic Reticulum Ca2+ ATPase 2) expres-
(miR-212/132- TG mice) model of HF. At the age of 6 weeks,
                                                                             sion10–12. Serca2a is indeed a predicted target of miR-13213. To
miR-212/132-TG mice displayed severe left ventricular (LV)
                                                                             demonstrate direct proof of Serca2a’s mechanistic role in the
hypertrophy, reduced ejection fraction (EF) and cardiac dilata-
                                                                             mode of action of antmiR-132, we analyzed Serca2a expression in
tion. To test potential reverse remodeling effects, antimiR-132 (i.
                                                                             cardiac tissue and confirmed that Serca2a downregulation in
p., 20 mg/kg weekly) or placebo (0.9% NaCl solution) were given
                                                                             miR-212/132 TG mice. In contrast, expression levels were
at this advanced HF stage for 4 consecutive weeks (Fig. 1a).
                                                                             restored in cardiac tissue form TG animals receiving antimiR-132
AntimiR-132 treatment reduced functional miR-132 levels in
                                                                             treatment (Fig. 2j).
cardiac tissue of miR-212/132-TG mice (Fig. 1b) and recovered
                                                                                Thus, elevation of miR-132 levels in cardiomyocytes has
expression levels of Foxo3 (Forkhead Box Protein O3), a pre-
                                                                             detrimental effects on contractile kinetics, which could be
viously identified downstream target of miR-1322, showing suc-
                                                                             normalized by antimiR-132 treatment by, at least in part,
cessful target engagement (Fig. 1c). MiR-132 inhibition resulted
                                                                             restoring Serca2a expression. In addition to the known Foxo3-
in reduced cardiac mass, improved EF and reduced ventricular
                                                                             mediated antihypertrophic effects and normalization of autop-
dilatation (Fig. 1d, e, Supplementary Table 1). Thus, pharmaco-
                                                                             hagy, the miR-132-Serca2a axis is an additional mode of action
logical miR-132 inhibition improved cardiac function and
                                                                             for the cardiomyocyte specific effects of antimiR-132. This is
reduced cardiac dilatation in the target-overexpression model of
                                                                             supported by the fact, that cardiac miR-132 is mainly expressed in
HF, highlighting the potential for clinical use in HF patients, for
                                                                             cardiomyocytes (Supplementary Fig. 2).
whose an increased cardiac expression level of the miR-212/132
cluster has been demonstrated3.
                                                                             Optimization of systemic antimiR-132 treatment. To further
AntimiR-132 ameliorates cardiomyocyte dysfunction. To                        assess the therapeutic potential of antimiR-132, we designed a
understand the favorable effect of miR-132 inhibition on cardiac             large animal pharmacokinetic (PK) study to assess tissue expo-
muscle function (Fig. 1d, e) on top of previous studies2, we                 sure and distribution in the target tissue of our compound in pigs.
performed proteomic profiling of neonatal rat cardiomyocytes                  Intravenous (IV) administration is a clinically preferred applica-
(NRCM) overexpressing miR-132 (Supplementary Fig. 1a). In                    tion route, however, many actual therapy approaches rely on
total, 1783 proteins were detectable in at least three samples, from         alternative route of administrations (RoA), such as intracoronary
which 165 proteins showed significantly altered expression                    (IC) perfusion, as often in the case for cardiac gene therapy
(Supplementary Fig. 1b). Using enrichment analysis, we found a               studies. We found dose-dependent tissue exposure in the cardiac
majority of proteins that were regulated after miR-132 transfec-             tissue samples comparable both for IV and IC administration of
tion to be related to contractile function (Supplementary Fig. 1c).          antimiR-132 (Fig. 3a, b). AntimiR-132 activity was confirmed by
We thus next compared the electrophysiological, calcium hand-                the reciprocal dose-dependent reduction of the target miR-132
ling and sarcomere shortening parameters of singularized ven-                level compared to untreated control animals. There was a strong
tricular cardiomyocytes from adult wildtype (WT), untreated and              inverse correlation between cardiac antimiR-132 concentration
antimiR-132-treated miR-212/132-TG mice. Representative tra-                 and functional miR-132 levels (Fig. 3c) independent of the RoA.
ces of whole-cell patch clamp experiments in the current clamp               The half-life of the compound in the cardiac tissue was calculated
mode are shown in Fig. 2a. Mean resting membrane potential                   to be approximately 3 weeks (Fig. 3d) and for plasma a bi-phasic
(RMP) values of cardiomyocytes from the three different groups               elimination of the compound with a rapid alpha phase and a long
were comparable (Fig. 2b). However, action potentials (AP) of                beta phase was found (Fig. 3e). The relatively long half-life in
miR-212/132-TG mice were significantly prolonged as compared                  tissues and short bi-phasic half-life in plasma is well known in the
to WT cardiomyocytes (Fig. 2c). This was caused by slowing of                oligonucleotide field14,15.

2                NATURE COMMUNICATIONS | (2020)11:633 | https://doi.org/10.1038/s41467-020-14349-2 | www.nature.com/naturecommunications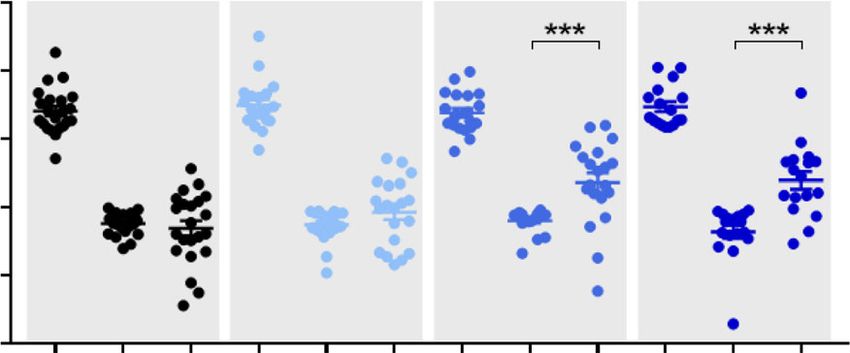
NATURE COMMUNICATIONS | https://doi.org/10.1038/s41467-020-14349-2 ARTICLE
a 4× treatment with: b c
Placebo/antimiR-132
6000 ** 5 **
miR-132/snoRNA202
4
(relative to WT)
(relative to WT)
4000
Foxo3/ActB
W6 W7 W8 W9 W10 3
2000
Endpoint 2
echocardiography 2 1
1
0 0
d TG TG e
Placebo antimiR-132 12 ** 80 ** 100 **
End-systolic volume (µl)
Ejection fraction (%)
HW/Tibia (mg/mm)
10 80
60
8 60
40
6 40
WT 20
4 20
TG + Placebo
TG + antimiR-132 2 0 0
Fig. 1 Therapeutic potential of antimiR-132 treatment. a Study outline of antimiR-132 application (20 mg/kg, i.p.) to miR-212/132 transgenic (TG) mice
compared to placebo treatment (0.9% NaCl solution) and wildtype (WT) mice. b Functional miR-132 level. c MiR-132 target gene expression (Forkhead
Box Protein O3, Foxo3). d Representative images of the parasternal long axis (PLAX) view of the left ventricle (LV) (scale bar = 2 mm) and heart weight
(HW) vs. Tibia length ratio of mice. e Echocardiographic evaluation of ejection fraction and end-systolic volume. WT: n = 8, TG + NaCl: n = 7, TG +
antimiR-132: n = 6. Data are mean ± s.e.m; **P < 0.01; unpaired two-sided Mann–Whitney U test.
AntimiR-132 treatment improves HF in a pig model. On the 132 dose-dependently improved cardiac function, reaching
basis of the PK data, we designed a pharmacodynamics (PD) statistical significance for the medium and high ICIV groups
study to test the antimiR-132 therapeutic efficacy in a large ani- (mean EF: 45.3% and 43.8%, respectively) and for the high dose
mal model of HF that closely mimics the clinical situation of post- IVIV group (mean EF: 44.1%) (Supplementary Fig. 4a, b;
MI patients who despite successful coronary reoxygenation Supplementary Tables 4, 5). The functional improvement (delta
therapy often develop HF. Our multi-arm study in a slow- EF = EFday 56 – EFday 3) significantly and dose dependently
growing (mangalica breed) pig model of post-MI HF allowed to increased in all high dose groups and in the ICIV medium dose
evaluate various treatment schemes based on two different routes group (delta EF): 6.0% in the high ICIV group, 9.8% in the high
of administrations at different doses on cardiac function during a IVIV group and 7.1% in the medium ICIV group, respectively
56 days follow-up using serial cardiac magnetic resonance ima- (Supplementary Fig. 4c, e; Supplementary Tables 6, 7). These
ging (MRI) measurements (Fig. 4a). Placebo and 3 dose levels numbers correspond to a 6.6, 10.4 and 7.8% relative change to
(Low, Medium and High corresponding to 1, 5, and 10 mg/kg, placebo animals (Supplementary Tables 8, 9). Based on the two
respectively) of antimiR-132 were applied either via IC infusion RoA overlapping PK and target level activity profiles, we opted to
or IV injection at day 3. A second IV injection with the same dose combine the treatment arms and present the data in a pooled
was applied at day 28 in both groups (Fig. 4a). We opted for IV form. Overall, significantly increased EF at the study endpoint
administration at this time point, due to clinical impracticality of and functional improvement was found in the medium and high
IC at this later time point. In total, 135 pigs were subjected to an dose groups (mean EF: 43.6% and 44.0%, respectively, delta EF:
interventional MI procedure with 56 day follow-up (Supple- 5.6% and 7.5%; respectively, delta EF relative to Placebo 6.3% and
mentary Fig. 3a). Animal deaths during this study were related to 8.2%, respectively (Fig. 4b, c; Supplementary Tables 10, 11, 12).
periprocedural complications (12.6%) within 48 h post-MI prior Responder analysis, counting the percentage of animals in each
to treatment initiation or due to fatal outcome of post-MI HF or group showing EF improvements (>3 or >7%), demonstrated a
iatrogenic cause. Notably, none of the deaths was associated with dose dependent therapeutic effect in both treatment arms
antimiR-132 treatment. Overall, 115 animals reached the day 56 (Supplementary Fig. 4d, f). Overall, of the combined groups
endpoint, 36 of those were excluded due to limited development 45.0% of the medium and 64.7% of the high dose group showed a
of LV dysfunction (EF ≥ 40% at day 3 post-MI based on MRI delta EF of >7% on day 56 compared to 4.6% of placebo animals
evaluation). Pigs were randomly assigned to the eight treatment (Fig. 4d). As a sign of post-MI adverse remodeling, LV end-
groups on day 3. 79 animals were included (for final data analysis, systolic volume (ESV) was significantly increased in the placebo
defined as EF < 40% at day 3 post-MI) (Supplementary Fig. 3a). group at endpoint. AntimiR-132 treatment in the medium and
The degree of myocardial damage and the ensuing cardiac dys- high dose groups effectively prevented this post-MI ESV
function may vary between animals despite standardized experi- enlargement (Supplementary Fig. 4g; Supplementary Table 10).
mental MI procedure. In addition to cardiac imaging, plasma This effect was even more visible by comparing change of LV
troponin T (TnT) measurements were used to assess myocardial volume data over time both as delta ESV (change between day 3
damage, measured 3 days after MI, before start of treatment and day 56) (Supplementary Table 11) and normalized delta ESV
(Supplementary Fig. 3b). No differences were observed between to placebo (Supplementary Table 12). Testing for linear contrast
the placebo and the various treatment groups, indicating no bias revealed statistical significance, the change in delta ESV showed
due to uneven distribution of study animals. linear dose-dependent correlation (Supplementary Fig. 4h). Based
All animals developed subsequent characteristic signs of on these data, we demonstrate a potent anti-remodeling effect of
deteriorating LV function with a mean EF of 37.1% for the antimiR-132.
Placebo ICIV and 36.9% for the Placebo IVIV groups at endpoint Additional data supporting the efficacy of our compound came
(Supplementary Fig. 4a, b; Supplementary Tables 4, 5). AntimiR- from further biomarker studies and histological evaluations. N-
NATURE COMMUNICATIONS | (2020)11:633 | https://doi.org/10.1038/s41467-020-14349-2 | www.nature.com/naturecommunications 3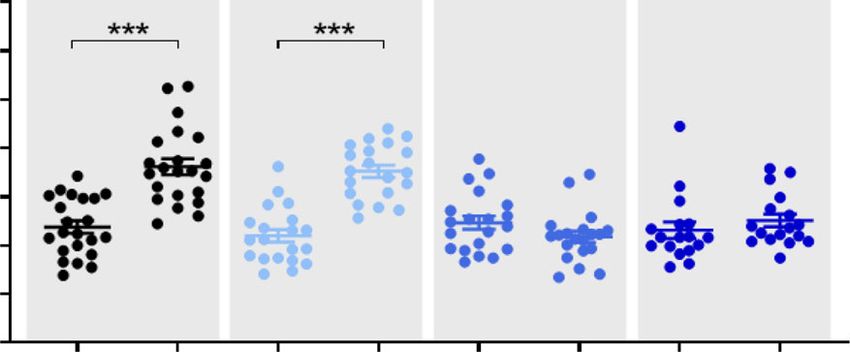
ARTICLE NATURE COMMUNICATIONS | https://doi.org/10.1038/s41467-020-14349-2
a WT TG + Placebo TG + antimiR-132
WT
TG + Placebo
50 mV
TG + antimiR-132
50 ms
b c 80 * d 200
e 300
–60
Upstroke velocity (V/s)
180
Amplitude (mV)
–70 60
APD50 (ms)
200
RMP (mV)
160
–80 40 140
120 100
–90 20
100
–100 * 0 80 0
f g h i
50 ** 80 *
sarcomer shortening (ms)
calcium transient (ms)
40
Time to peak of
Time to peak of
60
30
40
20
20
0.3 R
0.2 µm
10
0 0
100 ms 50 ms
j *
2.0
(relative to WT)
1.5
Serca2a/ActB
1.0
0.5
0.0
Fig. 2 Functional properties of single cardiomyocytes. a Representative action potential traces of adult ventricular cardiomyocytes derived from wildtype
(WT), miR-212/132 transgenic (TG) mice treated with placebo (0.9% NaCl solution) or antimiR-132. b Resting membrane potential (RMP). c Action
potential duration at 50% level of repolarization (APD50). d Action potential amplitude. e Upstroke velocity. (WT: n = 18 cells, TG + NaCl: n = 14 cells, TG
+ antimiR-132: n = 10 cells) f Representative normalized calcium transients. g, Time-to-peak (ttp) of calcium transients at 3 Hz stimulation frequency.
(WT: n = 46 cells, TG + NaCl: n = 19 cells/, TG + antimiR-132: n = 26 cells) h Representative normalized sarcomere shortening. i Time-to-peak (ttp) of
sarcomeric contraction at 3 Hz stimulation frequency. (WT: n = 52 cells, TG + NaCl: n = 57 cells, TG + antimiR-132: n = 41 cells). j MiR-132 target gene
expression in heart tissue (Sarcoplasmic/Endoplasmic Reticulum Ca2+ ATPase 2, Serca2a2). (WT: n = 8, TG + NaCl: n = 7, TG + antimiR-132: n = 5.) Data
are mean ± s.e.m; *P < 0.05; **P < 0.01; unpaired two-sided Mann–Whitney U test.
terminal prohormone of brain natriuretic peptide (NT-proBNP) cardiomyocytes was significantly reduced in samples from the
is a clinically highly relevant HF biomarker16. We measured NT- IVIV high dose (translationally most relevant group), compared
proBNP to validate the translational nature of the model to assess to the placebo group (Fig. 4g). These findings are in line with the
response to treatment by comparing levels at the study endpoint. cardiomyocyte specific mode of action of our compound.
We found that circulating NT-proBNP levels were significantly By analysing drug concentrations in cardiac tissue samples at
elevated in the placebo group at day 56 post-MI. In addition to the study endpoint, we showed a dose-dependent linear increase
the functional data mentioned above, the NT-proBNP elevation of antimiR-132 (Fig. 5a) and a highly significant correlation with
was significantly reversed in the medium and high dose groups EF improvement proofing a strong PK/PD relationship (Fig. 5b;
(Fig. 4e). Histological assessment of fibrosis revealed a significant Supplementary Fig. 5a, c). A dose-dependent reduction of
dose-dependent reduction of interstitial fibrosis suggesting functional cardiac miR-132 levels was observed suggesting
improvements in the overall cardiac remodeling in the antimiR- sufficient exposure by the administration and successful target
132-treated groups (Fig. 4f). No inflammatory infiltration was engagement (Fig. 5c, d; Supplementary Fig. 5b, d).
observed in the cardiac tissue histology slides from any treatment
groups. We also evaluated individual cardiomyocyte sizes in AntimiR-132 application is generally safe in all models. In the
histological samples from the LV remote regions in our pig post-MI HF efficacy study, the pigs were carefully monitored for
model. At the experimental endpoint, average size of the disease or drug related adverse effects by the veterinary team. No
4 NATURE COMMUNICATIONS | (2020)11:633 | https://doi.org/10.1038/s41467-020-14349-2 | www.nature.com/naturecommunications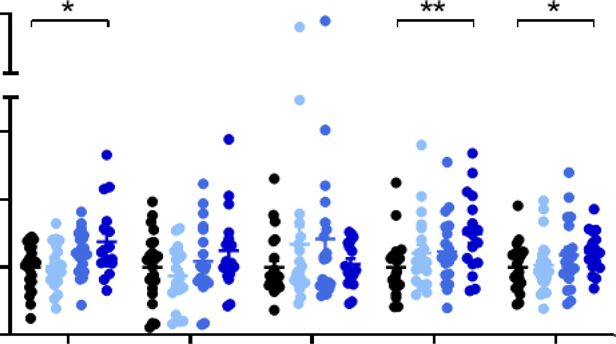
NATURE COMMUNICATIONS | https://doi.org/10.1038/s41467-020-14349-2 ARTICLE
a b c IC IV
4000 1.5 * 4000 4000
r = –0.8733 r = –0.9507
miR-132/U6 snRNA
**
antimiR-132 (ng/g)
antimiR-132 (ng/g)
(relative to control)
antimiR-132 (ng/g)
3000 P = 0.0002 3000 P < 0.0001
3000
1.0 2000 2000
2000 1000 1000
0.5 0 0
1000
–1000 –1000
0 0.0 –2000 –2000
IV IC IV IC IV IC IV IC IV IC IV IC 0.0 0.5 1.0 1.5 0.0 0.5 1.0 1.5
miR-132/U6 snRNA miR-132/U6 snRNA
Control Low dose Medium dose High dose
(relative to control) (relative to control)
d e
log10(antimiR-132) (ng/ml)
2000 105
antimiR-132 (ng/g)
1500 104
103
1000
102
500
101
0 100
2 7 14 28 Days 0 1 2 5 10 15 20 25 30 Days
Fig. 3 Pharmacokinetic properties of antimiR-132. a Cardiac tissue levels of antimiR-132 in healthy pigs 48 h post treatment for different dose levels
(Control: None; Low = 1 mg/kg, Medium = 5 mg/kg and High = 10 mg/kg antimiR-132, n = 3 respectively) by intravenous (IV) or intracoronary (IC)
application. b Functional cardiac tissue level of miR-132 in healthy pigs 48 h post treatment. c Correlation between antimiR-132 and miR-132 cardiac tissue
levels in healthy pigs 48 h post treatment. d Time course of cardiac tissue levels of antimiR-132 in healthy pigs at different timepoints post treatment
(5 mg/kg antimiR-132, IV, n = 3 respectively). e Plasma levels of circulating antimiR-132 in healthy pigs at different timepoints post treatment (5 mg/kg
antimiR-132, IV, n = 3 respectively). Data are mean ± s.e.m; *P < 0.05, **P < 0.01; Kruskal–Wallis test with Dunn’s multiple comparison (Control vs.
treatment groups) and linear regression using non‐parametric Spearman correlation.
drug-related events or changes in mortality or morbidity were (Endothelial Nitric Oxide Synthase 3)17 (Supplementary Fig. 7e).
observed. There was no indication of drug-related local or sys- This set of transcripts, combined with the known targets FOXO3
temic effects at any point. We also carefully monitored safety as well as SERCA2A, was used as a target engagement panel. By
relevant hematology and laboratory chemistry parameters this combined approach, we were able to demonstrate dose-
(including C-reactive protein, white blood cell counts, liver and dependent upregulation (i.e. de-repression) of targets in cardiac
kidney organ damage markers) during the pig study (baseline, tissue from antimiR-132-treated pigs (Fig. 5e). When combined
day 3, 28 and 56 post-MI). There was no indication of drug- with functional miR-132 levels in these tissue samples, these data
related effects at any point (Supplementary Fig. 6a). The provide a multi-level proof of target engagement for antimiR-132
expression of inflammatory mediators, such as IL-6 (Interleukin- in vivo. In this proof-of-concept study we demonstrate that
6) and TNF-α (Tumor necrosis factor alpha), was also not antimiR-132 effectively prevents maladaptive growth, remodel-
affected by treatments in cardiac tissue samples at the study ing and restore cardiac function via several cardiomyocyte spe-
endpoint (Supplementary Fig. 6b). Further, there was no differ- cific pathways. We also demonstrate sufficient target tissue
ence in scar tissue size between the various treatment groups at exposure, strong dose-dependent PK/PD relationship with our
the endpoint, indicating that antimiR-132 treatment does not compound in a clinically relevant model. In addition, in vivo
affect the evolution of the fibrotic scar or the revascularisation in target engagement in cardiac tissue was demonstrated at
and around the infarcted area in the post-MI hearts (Supple- microRNA and downstream target mRNA level. The dose-
mentary Fig. 6c, d). dependent improvement in cardiac function and the reversal of
remodeling in both treatment arms reinforces the therapeutic
Proof of target engagement for antimiR-132. To analyze the potential of our compound.
direct effects of antimiR-132 on miR-132-controlled gene net- We also demonstrate non-inferiority of IV vs. IC treatment
works in the target tissue, we established a target gene panel. We based on the similar therapeutic effect and PK profiles. This
utilized RNA sequencing first to identify potential transcripts enables us to utilize the IV administration scheme in subsequent
that interact with (target capture with biotinylated miR-132) and clinical developments.
are regulated by miR-132 (target de-repression upon antimiR- The compound was also safe and well tolerated at a wide
132 treatment) in human induced pluripotent stem cell-derived pharmacological range.
cardiomyocytes (hiPS-CMs) (Supplementary Fig. 7a, b, c). Top Most importantly, we provide strong efficacy data and high
regulated hits were derived by overlapping genes upregulated in clinical potential of our antimiR-132 treatment scheme in a large
both datasets and further analyzed by Gene Enrichment Analysis animal post-MI HF model, paving the way for clinical develop-
that unrevealed pathways highly associated with the cardiovas- ment of an innovative and effective therapy for patients with HF.
cular system and disease (Supplementary Fig. 7d). This approach Indeed, the compound has recently entered the clinical stage
revealed several potential miR-132 target transcripts, such as with regulatory approval in June 2019 and subsequent starting of
STIL (SCL/TAL1 Interrupting Locus) and TEK (TEK Receptor a Phase 1b clinical trial in HF patients (https://clinicaltrials.gov/
Tyrosine Kinase), along with the cardiac relevant NOS3 ct2/show/NCT04045405).
NATURE COMMUNICATIONS | (2020)11:633 | https://doi.org/10.1038/s41467-020-14349-2 | www.nature.com/naturecommunications 5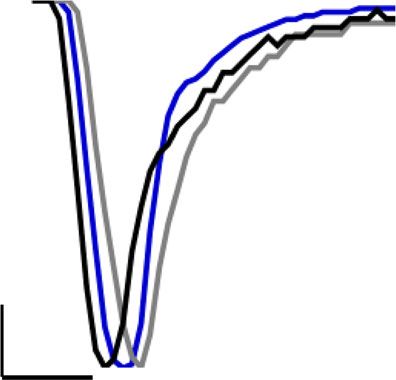
ARTICLE NATURE COMMUNICATIONS | https://doi.org/10.1038/s41467-020-14349-2
a Treatment ICIV or IVIV:
Placebo/antimiR-132
d0 d3 d28 d56
Placebo
MI Endpoint Low dose
LAD occlusion cardiac MRT Medium dose
(90 min, i.c. balloon) LV function High dose
b Placebo Low dose Medium dose High dose c
70 20
60
delta EF (%)
10
EF (%)
50
40 0
30
–10
20
d0 d3 d56 d0 d3 d56 d0 d3 d56 d0 d3 d56
d e Placebo Low dose Medium dose High dose
100 700
NT-proBNP (pg/ml)
Percent of animals
600
80
500
60 400
40 300
200
20
100
0 0
> 3% > 7% d0 d56 d0 d56 d0 d56 d0 d56
EF improvement
f g IVIV
Placebo Low dose Placebo
20 350
15
Cell size (a.u.)
8
Fibrosis (%)
PSR 300 WGA
6
Medium dose High dose High dose
4 250
2
0 200
Fig. 4 Proof-of-concept study in a large animal model of post-MI HF. a Study outline of treatment regimen (LAD = left anterior descending coronary
artery). b Ejection fraction (EF) at baseline, day 3 and day 56 for different dosing groups of intracoronary/intravenous (ICIV) and intravenous/intravenous
(IVIV) treated animals (Placebo: NaCl; Low = 1 mg/kg, Medium = 5 mg/kg and High = 10 mg/kg antimiR-132). c Functional improvement indicated by EF
change from day 3 to day 56 (delta EF) for different dosing groups of ICIV and IVIV treated animals. d Responder analysis for different dosing groups of
ICIV and IVIV treated animals. e N-terminal prohormone of brain natriuretic peptide (NT-proBNP) levels at baseline and day 56 for different dosing groups
of ICIV and IVIV treated animals. f Quantification and representative micrographs of picrosirius red (PSR) staining of the left ventricular (LV) remote
regions for different dosing groups of ICIV and IVIV treated animals (scale bar = 200 µm). g Quantification and representative micrographs of wheat germ
agglutinin (WGA) staining for cardiac cell size measurement of the LV remote regions of IVIV treated placebo and high dose animals (scale bar = 50 µm).
ICIV and IVIV: Placebo: n = 22, Low dose: n = 20, Medium dose: n = 20, High dose: n = 17. IVIV: Placebo n = 12, High dose: n = 7. Data are mean ± s.e.m;
*P < 0.05, ***P < 0.001; unpaired two-sided Mann–Whitney U test (d3 vs. d56) or Kruskal–Wallis test with Dunn’s multiple comparison (Placebo vs.
treatment groups).
Methods mg/kg/application. Wild type (WT) littermates served as controls. At the study
Small animal studies and functional analysis. All mouse experiments were endpoint, echocardiography was performed using Vevo 2100 (VisualSonics) under
performed in accordance to the relevant regulations and guidelines of the Fed- 2% isoflurane anesthesia, images recorded and analyzed using the Vevo LAB
eration of European Laboratory Animal Science and with the approval of the software 3.1.0 (VisualSonics).
governmental animal ethics committee LAVES (Nds. Landesamt für Ver-
braucherschutz und Lebensmittelsicherheit). For pharmacological studies, we used
a previously generated2 transgenic mouse model overexpressing cardiomyocyte- Isolation and culture of adult murine cardiomyocytes. Cardiac myocytes of
specific miR-132 (C57BL/6N background). Transgenic animals were treated with adult mice were generated by a modified protocol of the retrograde perfusion
antimiR-132 (LNA microRNA Inhibitor, Exiqon/Qiagen), as specified in the study method18. Briefly, mice received 0.1 ml heparin (2000 UI/kg body weight) under
design Fig. 1a. AntimiR-132 was diluted in 0.9% physiological saline that served as isoflurane anesthesia. After thoracotomy, the aorta was cannulated and the heart
placebo as well. Mice received four intraperitoneal (i.p.) injections at a dose of 20 was perfused for 3 min with prewarmed Perfusion buffer (113 mM NaCl, 4.7 mM
6 NATURE COMMUNICATIONS | (2020)11:633 | https://doi.org/10.1038/s41467-020-14349-2 | www.nature.com/naturecommunications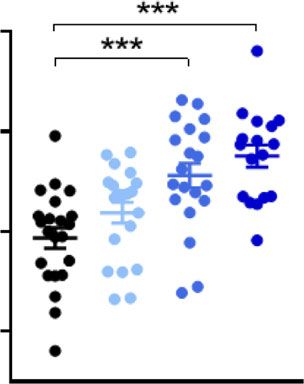
NATURE COMMUNICATIONS | https://doi.org/10.1038/s41467-020-14349-2 ARTICLE
a b c d
4000 4000 r = 0.5704 3 4000 r = –0.6390
(relative to Placebo)
miR-132/U6 snRNA
antimiR-132 (ng/g)
antimiR-132 (ng/g)
antimiR-132 (ng/g)
P < 0.0001 P < 0.0001
3000 3000 3000
2
2000 2000
2000
1000
1 1000
1000
0
0
0 –1000 0
Placebo
–10 0 10 20 0 1 2 3
Low dose Delta EF (%) miR-132/U6 snRNA
e Medium dose FOXO3 (relative to Placebo)
High dose 1.6
1.4
5.5 14
(relative to Placebo)
1.2
5.0 12
mRNA/TBP10
1
TEK SERCA2A
Radar area
0.8 10
3
0.6 8
2 6
4
1
2
0 STIL NOS3 0
3 A S3 IL K
XO A2 O ST TE
C
FO R N
SE
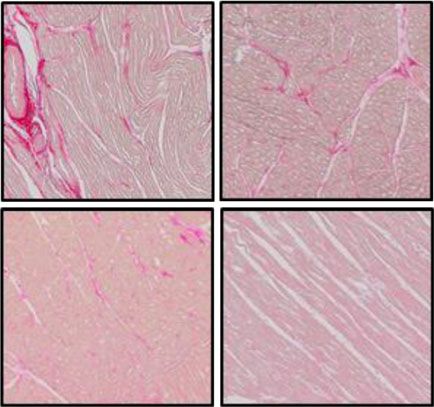
Fig. 5 PK/PD relationship and target engagement panel. a Tissue levels of antimiR-132 detected in the left ventricular (LV) remote region for different
dosing groups of intracoronary/intravenous (ICIV) and intravenous/intravenous (IVIV) treated animals (Placebo: NaCl; Low = 1 mg/kg, Medium = 5 mg/
kg and High = 10 mg/kg antimiR-132). b Correlation between antimiR-132 tissue levels and functional improvement (delta ejection fraction (EF) = EFday 56
– EFday 3). c Functional tissue level of miR-132 detected in the LV remote region. d Correlation between antimiR-132 and miR-132 tissue levels. e Target de-
repression in the LV remote region after antimiR-132 treatment (Forkhead Box Protein O3, FOXO3; Sarcoplasmic/Endoplasmic Reticulum Ca2+ ATPase 2,
SERCA2A; Endothelial Nitric Oxide Synthase 3, NOS3; SCL/TAL1 Interrupting Locus, STIL; TEK Receptor Tyrosine Kinase, TEK). Radar chart depicting the
target engagement panel. ICIV and IVIV: Placebo: n = 22, Low dose: n = 20, Medium dose: n = 20, High dose: n = 17. Data are mean ± s.e.m; *P < 0.05,
**P < 0.01, ***P < 0.001; Kruskal–Wallis test with Dunn’s multiple comparison and linear regression using non‐parametric Spearman correlation.
KCl, 0.6 mM KH2PO4, 0.6 mM Na2HPO4, 1.2 mM MgSO-7H2O, 0.032 mM phenol with the ClampFit software (Molecular Devices). Only cells with an input resis-
red, 12 mM NaHCO3, 10 mM KHCO3, 10 mM HEPES, 30 mM taurine, 0.1% tance of above 1 MΩ were used for analysis20.
glucose, 10 mM butanedione monoxime (BDM)). The buffer was switched to 1x
Perfusion Buffer supplemented with 200 U/mL collagenase II (Worthington) and
12.5 µM CaCl2 and perfused for additional 10 min until the heart became soft. Single-cell sarcomere contraction and relaxation analysis. For single-cell sar-
After removing the extraneous tissues including the atria, the digested heart was comere contraction and relaxation analysis21–23 a glass coverslip with single
teased into small pieces and dissociated into single cell suspension. This digestion adherent cardiomyocytes was placed into a custom-made perfusion chamber.
was stopped by addition of an equal amount of Stop buffer (perfusion buffer Myocytes were electrically stimulated with the MyoPacer EP Cell Stimulator
containing 10% FBS and 12.5 µM CaCl2) and the cell suspension filtered through a (IonOptix) under constant perfusion with Hepes buffer (117 mM NaCl, 5.7 mM
100 µM cell strainer. Myocytes were separated from other cardiac cells by sedi- KCl, 1.2 mM NaH2PO4, 0.66 mM MgSO4, 10 mM glucose, 5 mM sodium pyruvate,
mentation and centrifugation. Calcium was gradually introduced before cells were 10 mM creatine, 20 mM HEPES, 1.0 mM EGTA, 1.25 mM CaCl2 adjusted to pH 7.4
plated on laminin-coated plates with plating medium (Medium 199, Hanks’ and 37 °C)24. Only quiescent cardiomyocytes with clear striations and rod-like
Balanced Salts (Thermo Fisher Scientific) pH 7.3 supplemented with 0.1232 g shape, which reacted to electrical pacing were randomly selected for single-cell
gluthation and 0.008 g BSA) and incubated at 37 °C and 5% CO2. experiments. For each cardiomyocyte, a rectangular region of interest (ROI) which
Cardiac fibroblasts were separated from myocyte and non-myocyte fractions by typically included 15 to 20 sarcomeres, was adjusted and sarcomere length was
preplating at 37 °C and 1% CO2 for 45 min in minimal essential medium (Animed) calculated automatically by IonWizard software version 6.5 (IonOptix) using Fast
supplemented with 4.2 mM NaHCO3, 2 ng/ml Vitamin B12, 1× Penicillin/ Fourier Transformation analysis. Sarcomere contractions were recorded at 1 Hz, 3
Streptomycin and 10% FBS. Cardiac endothelial cells were prepared from the Hz, and 5 Hz. Raw data was collected and stored with the IonWizard software
preplating supernatant using MACS MS Columns and CD146 (LSEC) MicroBeads version 6.5. For each cell at each stimulation frequency 20 to 30 single twitches
for mouse (Miltenyi Biotec) according to the manufacturer’s instructions. Cardiac were averaged. Parameters analyzed were diastolic sarcomere length (µm), con-
fractions for gene expression analyses were washed once with PBS and pelleted at traction amplitude (measured as average shortening per sarcomere, µm), nor-
900 × g for 5 min before freezing in liquid nitrogen. malized maximum systolic shortening velocity in 1/s [(maximum slope in the
contraction phase (-dL/dt), in µm/s) /contraction amplitude in s)], normalized
maximum diastolic relaxation velocity in 1/s [(maximum slope of the relaxation
Current clamp. Whole cell patch clamp analyses were performed in adult murine phase (+dL/dt), in µm/s) /contraction amplitude in s], time to peak (ttp) and half
ventricular cardiomyocytes 6 h after isolation. Voltage changes were digitized with relaxation time (hrt), both in s.
a Digidata 1550 and recorded with an Axopatch 200B amplifier (Molecular
Devices). Pipettes were pulled from borosilicate glass (Harvard Apparatus) with
resistances between 2 and 6 MΩ. The extracellular solution contained 140 mM Analysis of intracellular calcium transients. Intracellular Ca2+-transients of
NaCl, 5.4 mM KCl, 1.8 mM CaCl2, 1 mM MgCl2, 10 mM HEPES, 10 mM glucose, single cardiomyocytes were recorded using a dual excitation fluorescence photo-
and pH 7.4 (adjusted with NaOH). The intracellular solution contained: 120 mM multiplier system (IonOptix Corp.)21–23. Therefore, cardiomyocytes were loaded
K-gluconate, 10 mM Na-Gluconate, 1 mM MgCl2, 3 mM Mg-ATP, 10 mM EGTA, for 20 min at 37 °C and 5% CO2 with 1.5 μM fura-2 acetoxymethyl (AM) (Invi-
10 mM HEPES and pH 7.2 (adjusted with KOH). Agar bridges were used to trogen) and washed twice for 15 min. The ROI was adjusted to the individual
connect the amplifier and the pipette solution. Results were corrected for junction cardiomyocytes and fluorescence measurements were performed21–23. Ratio tran-
potentials calculated using the JPCalc software19. Cells were hyperpolarized to −80 sients were recorded and stored using IonWizard software version 6.5 (IonOptix).
mV. AP were evoked by a current pulse of 1 ms duration. RMP or maximum Prior to analysis autofluorescence which was recorded separately from a group of
diastolic potential (MDP), AP amplitude, AP duration at 50% repolarization not with fura-2 AM loaded cardiomyocytes using the same ROI as for loaded ones,
(APD50) and upstroke velocity were determined. AP morphology was analyzed was subtracted.
NATURE COMMUNICATIONS | (2020)11:633 | https://doi.org/10.1038/s41467-020-14349-2 | www.nature.com/naturecommunications 7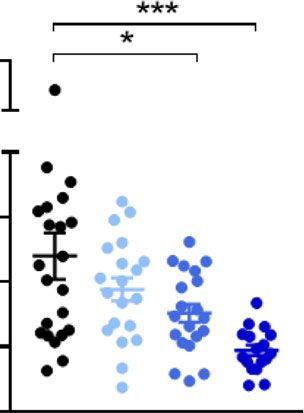
ARTICLE                                                                              NATURE COMMUNICATIONS | https://doi.org/10.1038/s41467-020-14349-2

    Parameters analyzed were diastolic ratio (R) and ratio amplitude (R),                  randomly assigned to the dosing groups. Further, animals were treated in a blinded
normalized maximum velocities of ratio increase in 1/s [maximum slope of calcium           fashion.
increase in(R/s)/ ratio amplitude in R] and ratio decay in 1/s [maximum slope of               Blood sampling was performed at baseline, day 3 (pre-treatment), day 28 (pre-
calcium decay in (R/s) /ratio amplitude in R] as well as time to peak and half decay       treatment) and day 56. On day 56 after MI, the animals were euthanized, and tissue
time (RT50) of ratio transients, both in s.                                                samples were collected from pigs, frozen on dry ice, and stored at −80 °C for later
                                                                                           processing.
Isolation, culture, and treatment of NRCM. NRCM were isolated from newborn
rats by enzymatic digestion25. NRCM were cultivated in minimal essential medium            Functional parameter. Analysis of cardiac function was assessed by cardiac
(Animed) containing 2 mg/L vitamin B12, 4.2 mM NaHCO3, 2 mM L-glutamine,                   magnetic resonance imaging (cMRI) in a serial fashion, at baseline, day 3 (with late
0.1 mM Bromdesoxyuridin (BrdU), 1% penicillin/streptomycin, and 5% FBS                     enhancement (LE)) and day 56 (with LE) post-MI. MRI assessment was performed
(Invitrogen) at 37 °C and 1% CO2. Cells were transiently transfected with pre-miRs         at Medicopus using Siemens Magnetom Vision 1.5 Tesla field strength equipment
using liposomal transfection. Briefly, premiR-132 (Ambion, PM10166) or premiR-              (whole body magnetic resonance tomographic equipment; Siemens) under 3–5%
control (Ambion, AM17111) and Lipofectamine 2000 (Thermo Fisher Scientific)                 isoflurane anesthesia. MRI images were evaluated by MUW using Segment for
were mixed with Opti-MEM I media (Thermo Fisher Scientific) and incubated                   Windows software (version 1.9; Medviso AB). The primary endpoint was LV
separately for 5 min. Both solutions were combined, incubated for additional 20 min        ejection fraction (EF) on day 56 post-MI. Animals showing an EF on day 3 of ≥40%
and added to the cells that have been washed with DPBS (Thermo Fisher Scientific).          were excluded from the study due to low response to the MI-model (see Supple-
Cells were incubated for 4 h before the media were changed to fresh cultivation            mentary Fig. 2a). Secondary endpoints were end-diastolic volume (EDV), end-
medium. Overexpression of miR-132 was monitored for 72 h after transfection.               systolic volume (ESV), stroke volume (SV), cardiac output (CO) and heart rate.
                                                                                           Volumetric measurements of the left and right ventricle were performed using the
                                                                                           freely available academic license software Segment for Windows software, and the
Protein isolation of the cellular membrane fraction. The Mem-PER Plus                      global left and right ventricular EF and LV mass was calculated by measuring the
Membrane Protein Extraction Kit (Thermo Fisher Scientific) was used to isolate              EDV and ESV on short axis cine MRI images.
proteins from the cellular membrane based on a mild detergent-based and selective
extraction protocol. In brief, around 5 × 10⁶ cells were scraped off the culture plate
surface, centrifuged and washed. Cells were then permeabilized with 0.75 mL of             Assessment of antimiR-132 tissue and plasma concentrations. AntimiR-132
Permeabilization Buffer, a mild detergent that allows the release of soluble cytosolic     levels from biological matrices were quantified at Axolabs using a HPLC assay that
proteins. Then, 0.5 mL of Solubilization Buffer was added to solubilize membrane           is based on the specific hybridization of the fully phosphorothioated LNA sequence
proteins. The fractions were stored at −80 °C. With this kit, membrane proteins            with a complementary 16-mer PNA-probe labeled with an Atto425 fluorescence
with at least 1–2 transmembrane domains were extracted.                                    dye at the N-terminus. The PNA-probe with the sequence Atto425-OO-aac agt cta
                                                                                           cag cca t was purchased from Panagene Inc.
                                                                                               Snap frozen tissue samples were sonicated in buffer containing proteinase K. In
Proteomics. Proteins of the cellular membrane fraction were digested with trypsin          the resulting proteinase K lysates antimiR-132 was fully stable as all nuclease
using an enzyme:protein ratio = 1:50 for in-solution digestion at 37 °C overnight.         present in the biological matrix were degraded. For the subsequent hybridization
The digested samples were cleaned up by using C18 spin plate and separated by              step, an aliquot of the proteinase K lysates was mixed with a hybridization buffer
nanoflow HPLC (U3000 RSLCnano, EASY-SPRAY C18 column 75 µm × 50 cm)                         containing 2.4 M urea in 12 mM Tris buffer pH 8 with 12% acetonitrile and the 16
with a 2 h gradient and then analyzed with an Orbitrap Fusion Lumos (Thermo                mer PNA-probe.
Fisher Scientific). Full MS was acquired on Orbitrap with a resolution of 120,000               The HPLC analysis was conducted on an Ultimate3000 HPLC system (Thermo
and MS2 was acquired on linear ion trap using CID fragmentation for most                   Fisher Scientific) equipped with a low pressure gradient pump at a flow rate of 1
abundant ions within 3 s cycle time and with dynamic exclusion enabled. Each               mL/min, a 96-well plate autosampler, a column compartment at 50 °C and a
sample was injected twice.                                                                 Shimadzu Florescence detector RF-20Axs (excitation wavelength: 436 nm; emission
   Proteome Discoverer 1.4.0.288 (Thermo Fisher Scientific) was used to search              wavelength: 484 nm). HPLC buffer A was composed of 25 mM Tris buffer pH 8,
RAW files against UniProt/SwissProt Mammalia database (version 2015_02) using               30% acetonitrile and 1 mM EDTA. HPLC buffer B contained 800 mM sodium
Mascot (version 2.3.1, Matrix Science). Search results were loaded into Scaffold           perchlorate in HPLC buffer A. The HPLC column was washed after each sample
(version 4.3.2, Proteome Science) for further validation with the following filters:        using HPLC buffer C with 2 M sodium perchlorate, 3 M urea, 1 mM EDTA and 25
peptide probability >95%, protein probability >99% with at least two unique                mM Tris buffer pH 8. Chromatography was performed on a DNA Pac PA100
peptides. Proteins were quantified using a Top3 precursor intensity method and              column (4 × 250 mm, Thermo Fisher Scientific). Gradient elution of the compound
missing values were imputed using a small number (1000). Proteins with a                   was achieved by increasing the concentration of HPLC buffer B from 10% after 1
Student’s t-test P value < 0.05 were considered as significantly changed. Pathway           min to 45% at 9 min. An aliquot of 0.5 mg of tissue was injected per run in 100 µL
enrichment analysis was performed using Enrichr26. All the data has been                   of the final hybridized sample solution. The method was qualified for accuracy,
deposited in PRIDE with dataset identifier PXD015337 and 10.6019/PXD015337.                 precision, selectivity, carry-over, and linearity.

PK studies and PoC study in a pig model of post-MI HF. The in-life phase of the            Histology and fibrosis assessment. Heart tissue samples from the LV remote
studies was carried out in a collaboration with the Medical University Wien                region were fixed in 4% formalin (Merck), embedded in paraffin and cut to 4–5 µm
(MUW), Austria and the Institute of Diagnostic Imaging and Radiation Oncology              slices. For quantification of collagen and fibrosis, the samples were stained with
(IDIRO) of the University of Kaposvar (now Medicopus Nonprofit Ltd.) in                     Picro Sirius Red (PSR) and microscopy photographs were taken on an Olympus
Kaposvar, Hungary. The study protocols have been reviewed and approved by the              microscope IX83 (Olympus). Fibrosis was assessed based on collagen quantity by
Animal Welfare Committee of the University of Kaposvar, Hungary for com-                   computerized planimetry using ImageJ (version 1.51) thresholding of four stained
pliance with regulations prior to study initiation. All experiments were performed         sections per animal, and mean values of the identical samples of the same animal
according to the Animal Study Registration Numbers SOI/31/26-11/2014 and SOI/              were calculated.
31/01473-9/2017.                                                                               Paraffin sections of the LV myocardium were visualized by wheat germ
    To assess pharmacokinetics (PK) in healthy pigs, animals were subjected to             agglutinin (WGA) stain coupled to Alexa Flour 488 (Thermo Fisher Scientific). The
different doses (Low (1 mg/kg), Medium (5 mg/kg) or High (10 mg/kg)) of                    cell surface area of cardiomyocytes was calculated using the NIS-Elements BR 3.2
antimiR-132 via intravenous (IV) or intracoronary (IC) injections. A total volume          package (Nikon Instruments Inc).
of 20 mL solution/animal was applied at a flow rate of 80 mL/hour. Once
completed, the tube was flushed with 5 mL sterile saline solution. Tissue samples
were collected at 48 h post injection. Blood sampling was performed before (0 min)         Plasma sampling and laboratory diagnostics. Blood was collected into EDTA
as well as at 3 min, 9 min, 30 min, 1 h, 3 h, 9 h, 24 h, and 48 h post injection. In the   tubes for plasma sampling or coagulated for 30 min and centrifuged at 1300 xg for
5 mg/kg IV dose group additional tissue and blood samples were collected at 7, 14          10 min to generate serum samples. Hematology and biochemical analysis were
and 28 days post injection. Untreated animals served as controls.                          performed by PraxisLab Kft (Budapest, Hungary) using fully automated instru-
    MI (PK study) and subsequent HF (multi-arm proof of concept (PoC) study)               ments. Cell counts in anticoagulated whole blood sample and physical character-
was induced by occlusion of the coronary artery for 90 min via a balloon catheter          istics of the different cell types (red blood cells, white blood cells and platelets) were
followed by removal of the balloon in 135 female, 4–5 months old Mangalica pigs            analyzed by a flow cytometry-based fully automated ADVIA 120 Hematology
(Hungarian breed of domestic pigs). The ensuing myocardial damage (ischemic/               System (Siemens), using commercial reagents. Biochemical parameters were ana-
reperfusion injury) led to restricted myocardial function, progressive remodeling          lyzed by spectrophotometric and potentiometric assay using the AU480 Chemistry
and signs of HF during the post-MI follow-up period.                                       Analyzer (Beckman Coulter) and commercial reagents. The results provide
    Treatment groups of the multi-arm PoC study received a Low (1 mg/kg),                  information on general health status and disease conditions, as well as model and
Medium (5 mg/kg) or High (10 mg/kg) dose of antimR-132 applied either IC or IV             potential treatment-related effects.
on day 3 after MI and a second injection on day 28 after MI by IV application, as a            Troponin T (TnT) and N-terminal pro-brain natriuretic peptide (NT-proBNP)
short perfusion as described above. Control groups received saline solution, the           were assessed using an Enzyme-linked Immunosorbent Assay (ELISA) kit (Cloud
vehicle of antimiR-132, as placebo. Prior to study start, the animals were assigned        Clone Corp) according to the manufacturer’s protocol. The enzyme-substrate
to either the IVIV or ICIV treatment arm and within these arms, animals were               reaction was measured spectrophotometrically with a Sunrise Multiplate reader

8                     NATURE COMMUNICATIONS | (2020)11:633 | https://doi.org/10.1038/s41467-020-14349-2 | www.nature.com/naturecommunications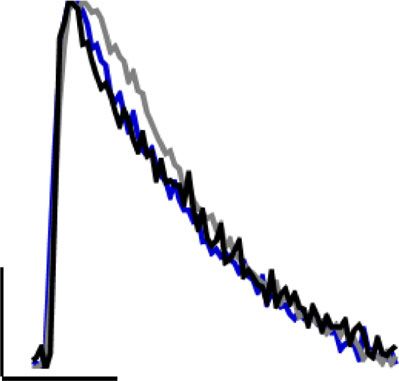
NATURE COMMUNICATIONS | https://doi.org/10.1038/s41467-020-14349-2                                                                                       ARTICLE

(Tecan) at a wavelength of 450 nm ± 10 nm. The plasma concentrations of TnT and          Real-Time PCR System using iQ SYBR Green supermix (BioRad) and gene-specific
NT-proBNP were calculated based on the serial dilution of the protein standard.          primer (murine Foxo3: 5′CAAAGCTGGGTACCAGGCTG3′, 5′TTCCACGGGTA
                                                                                         AGGGCTTCA3′; murine reference gene ActB: 5′ATCAAGATCATTGCTCCTCC
                                                                                         TG3′, 5′AGGGTGTAAAACGCAGCTCA 3′) or the ABsolute Blue QPCR Mix
Differentiation and culture of hiPSC-derived cardiomyocytes. Human induced               (Thermo Fisher Scientific) and TaqMan Gene Expression assays for human sam-
pluripotent stem cells (hiPSC)27 were maintained in feeder-free culture on Geltrex       ples (Thermo Fisher Scientific; Cacna1g: Hs00367969_m1, Bcl2L11:
(Thermo Fisher Scientific) in StemMACS full medium with supplements (Miltenyi             Hs00367969_m1, Nos3: Hs01574665_m1, Stil: Hs00161700_m1, Tek:
Biotec) using polystyrene plates (CELLSTAR; Greiner Bio-One).                            Hs00945150_m1, and Tbp10: Hs00427620_m1 as a reference gene) or pre-
   Directed differentiation of hiPSCs towards cardiomyocytes was performed by            validated in pig tissue samples (Thermo Fisher Scientific; Serca2a: Ss03392433_m1,
modulating the Wnt pathway28. hiPSCs were split using Versene (Thermo Fisher             Foxo3a: Ss03374015_m1, Nos3: Ss03383840_u1, Stil: Hg05118054m1, Tek:
Scientific) at 37 °C and then seeded onto a Geltrex-coated cell-culture dish in           Ss03388274m1, Tnf-α: Ss03391318_g1, IL-6: Ss03384604_u1, and Tbp10:
StemMACS supplemented with 2 μM Thiazovivin (Peprotech) (day −3) for 24 h.               Ss03391165_m1 as a reference gene) or for murine samples (Thermo Fisher Sci-
The medium was shifted to RPMI 1640 + GlutaMAX (Thermo Fisher Scientific)                 entific; Serca2a: Mm01201431_m1, murine reference gene ActB:
supplemented with albumin human recombinant (Sigma-Aldrich), L-Ascorbic acid             Mm02619580_g1).
2-phosphate sesquimagnesium salt hydrate (Sigma-Aldrich) and the GSK3β                       To quantify miRNA levels, cDNA was generated using the TaqMan MicroRNA
inhibitor CHIR99021 (4 μM, synthesized by the Institute of Organic Chemistry,            Reverse Transcription Kit (Thermo Fisher Scientific) and corresponding TaqMan
Leibniz University Hannover) when the cells reached a density of 70–80% (day 0).         MicroRNA RT Assays (Thermo Fisher Scientific). QRT-PCR was performed using
After 48 h, medium was changed to fresh media supplemented with 5 mM of the              the ABsolute Blue QPCR Mix (Thermo Fisher Scientific) and the TaqMan
Wnt signaling inhibitor IWP2 (Peprotech). Following medium changes were                  MicroRNA Assays (Thermo Fisher Scientific; miR-132-3p: 000457, snoRNA202:
performed every 48 h. From day 8 on, the cells were cultured in cardio culture           001232 as a reference gene for murine samples and U6 snRNA: 001973 as a
medium containing RPMI 1640 + GlutaMAX supplemented with 1× B27 with                     reference gene for porcine and human samples).
insulin (Thermo Fisher Scientific), with a medium change every 2–3 days. CMs                  Data were collected and analyzed using the QuantStudio Real-Time PCR
were purified using metabolic selection29 and studied on day 60 (calculated from          Software versions 1.1 and 1.3 (Thermo Fisher Scientific).
day 0 of differentiation).
                                                                                         Statistics. Data were analyzed using GraphPad Prism 7 software. Data are shown
Establishment of a target engagement panel. To identify transcripts that                 as mean ± s.e.m. P values were calculated using unpaired two-tailed unpaired
interact with and are possibly regulated by miR-132 RNA sequencing was per-              Student’s t-test, two-sided Mann–Whitney U test (comparing two groups) or
formed in two sample sets generated to (a) capture direct interaction partners of        Kruskal–Wallis test with Dunn’s multiple comparison (comparing more than two
miR-132 using a synthetic biotinylated hsa-miR-132-3p-duplex and to (b) to               groups) (as indicated). Linear regression analysis was based on non‐parametric
determine transcriptional changes after antimiR-132 treatment.                           Spearman correlation. Trend analysis was done by ANOVA, post-test for trend.
    For the target capture experiment30 10 nM of a synthetic biotinylated hsa-miR-
132-3p-duplex (Integrated DNA Technologies) was introduced into human iPS-               Reporting summary. Further information on research design is available in
derived cardiomyocytes27,28 (hiPS-CM) by liposome-mediated transfection using            the Nature Research Reporting Summary linked to this article.
Lipofectamine and Opti-MEM I (both from Thermo Fisher Scientific) according to
the manufacturers protocol. Reference cells that underwent the same procedure
were treated with a transfection mix where the synthetic miRNA was substituted by        Data availability
an equal volume of ultrapure RNase-free water. This transfection mix was replaced        Proteomics data has been deposited in PRIDE with dataset identifier PXD015337 and
by culture medium (serum-free RPMI 1640 medium supplemented with Glutamax                10.6019/PXD015337. The datasets generated during and/or analyzed during the current
and B27, Thermo Fisher Scientific) after 12 h and cells lysed after an additional         study are available from the corresponding author on reasonable request.
incubation for 24 h in culture medium. At endpoint, cell harvest was performed by
scraping and centrifugation at 100 ×g for 10 min. Cells were lysed in Cell Lysis
Buffer (10 mM Tris-Cl pH 7.5, 10 mM KCl, 1.5 mM MgCl2, 0.5% IGEPAL CA-630,               Received: 26 April 2019; Accepted: 27 December 2019;
5 mM DTT, 60 U/mL RNaseOut, 1× cOmplete Mini EDTA-free protease inhibitor
cocktail), frozen on dry ice for 5 min, thawed at room temperature, and precleared
from debris by centrifugation at 16,200 ×g at 4 °C for 2 min. Then, NaCl was added
to a final concentration of 1 M. The lysate was combined with Dynabeads MyOne
Streptavidin C1 (Thermo Fisher Scientific) that have been blocked with Bead
Blocking Solution (1 µg/µL BSA, 1 µg/µL Yeast tRNA in RNase-free water) at 4 °C
overnight. After incubation with gentle agitation for 30 min, Dynabeads were             References
washed three times with Wash Buffer (10 mM Tris-Cl pH 7.5, 10 mM KCl, 1.5 mM             1.  Kumarswamy, R. & Thum, T. Non-coding RNAs in cardiac remodeling and
MgCl2, 0.5% IGEPAL CA-630, 1 M NaCl, 5 mM DTT, 60 U/mL RNaseOut, 1×                          heart failure. Circ. Res. 113, 676–689 (2013).
cOmplete Mini EDTA-free protease inhibitor cocktail) to remove non-specifically           2. Ucar, A. et al. The miRNA-212/132 family regulates both cardiac hypertrophy
bound molecules. Target transcripts bound to the Dynabeads via interactions to               and cardiomyocyte autophagy. Nat. Commun. 3, 1078 (2012).
hsa-miR-132-3p-biotin were released by addition of 700 µL Qiazol Lysis Reagent           3. Thum, T. et al. MicroRNAs in the human heart. Circulation 116, 258–267
(Qiagen) and total RNA further purified using the miRNeasy Micro Kit (Qiagen)                 (2007).
according to the manufacturer’s instructions.                                            4. Kaprielian, R. et al. Relationship between K+ channel down-regulation and
    To determine the effect of miR-132 suppression on transcripts (target de-                [Ca2+]i in rat ventricular myocytes following myocardial infarction. J.
repression), hiPS-CM were treated with 100 nM antimiR-132 for 48 h. Cells treated            Physiol. 517(Pt 1), 229–245 (1999).
with NaCl served as controls. At endpoint, RNA was isolated and sequenced along          5. Wang, Y. & Hill, J. A. Electrophysiological remodeling in heart failure. J. Mol.
with samples from the target capture experiment. RNA sequencing of both                      Cell. Cardiol. 48, 619–632 (2010).
experiments was performed by Biogazelle NV.                                              6. Beuckelmann, D. J., Näbauer, M. & Erdmann, E. Intracellular calcium
    To identify target transcripts of miR-132 datasets from the capture as well as the       handling in isolated ventricular myocytes from patients with terminal heart
de-repression experiment were compared. Since direct interactions between miR-               failure. Circulation 85, 1046–1055 (1992).
132-3p and its targets are expected to be enriched in biotinylated miR-132 fraction      7. Gwathmey, J. K. et al. Abnormal intracellular calcium handling in
and to be upregulated after antimiR-132 treatment, the analysis specifically focused          myocardium from patients with end-stage heart failure. Circ. Res. 61, 70–76
on these datasets. Using the overlapping gene list, a pathway enrichment analysis            (1987).
was performed using Enrichr26. Genes involved in pathways relevant for                   8. Mørk, H. K., Sjaastad, I., Sejersted, O. M. & Louch, W. E. Slowing of
cardiovascular disease were selected and expression levels of overlapping target hits        cardiomyocyte Ca2+ release and contraction during heart failure progression
were validated in hiPSC-CM treated with antimiR-132 as described above and                   in postinfarction mice. Am. J. Physiol. Heart Circ. Physiol. 296, H1069–H1079
along with known targets in heart tissue derived from the multi-arm PoC study in a           (2009).
pig model of post-MI HF. Results were represented as radar chart displaying              9. Bøkenes, J. et al. Slow contractions characterize failing rat hearts. Basic Res.
multivariate data in the form of a two-dimensional chart of three or more                    Cardiol. 103, 328–344 (2008).
quantitative variables represented on axes starting from the same point.
                                                                                         10. Litwin, S. E., Zhang, D. & Bridge, J. H. Dyssynchronous Ca(2+) sparks in
                                                                                             myocytes from infarcted hearts. Circ. Res. 87, 1040–1047 (2000).
Gene expression analysis. RNA of mouse heart tissue was isolated using the               11. Louch, W. E. et al. T-tubule disorganization and reduced synchrony of Ca 2+
TriFast method (Peqlab) according to the manufacturer’s instructions, while por-             release in murine cardiomyocytes following myocardial infarction. J. Physiol.
cine tissue biopsies of the LV remote region were isolated using miRNeasy Mini Kit           574, 519–533 (2006).
(Qiagen). For mRNA detection, RNA samples were reverse transcribed with the              12. Lyon, A. R. et al. Loss of T-tubules and other changes to surface topography in
iScript Select cDNA Synthesis Kit (BioRad; murine samples) or Verso cDNA                     ventricular myocytes from failing human and rat heart. Proc. Natl Acad. Sci.
Synthesis Kit (Thermo Fisher Scientific; porcine samples) and quantified on a Viia7            USA 106, 6854–6859 (2009).

NATURE COMMUNICATIONS | (2020)11:633 | https://doi.org/10.1038/s41467-020-14349-2 | www.nature.com/naturecommunications                                                   9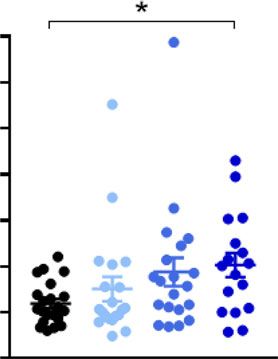
You can also read