Predicting the Mortality and Readmission of In-Hospital Cardiac Arrest Patients With Electronic Health Records: A Machine Learning Approach ...
←
→
Page content transcription
If your browser does not render page correctly, please read the page content below
JOURNAL OF MEDICAL INTERNET RESEARCH                                                                                                           Chi et al

     Original Paper

     Predicting the Mortality and Readmission of In-Hospital Cardiac
     Arrest Patients With Electronic Health Records: A Machine
     Learning Approach

     Chien-Yu Chi1*, MD; Shuang Ao2*, PhD; Adrian Winkler2, BEng; Kuan-Chun Fu2, MSc; Jie Xu2, PhD; Yi-Lwun
     Ho3, MD; Chien-Hua Huang4, MD; Rohollah Soltani2, MSc
     1
      Department of Emergency Medicine, Yunlin Branch, National Taiwan University Hospital, Yunlin, Taiwan
     2
      Knowtions Research, Toronto, ON, Canada
     3
      Department of Internal Medicine, National Taiwan University Hospital, Taipei, Taiwan
     4
      Department of Emergency Medicine, National Taiwan University Hospital, Taipei, Taiwan
     *
      these authors contributed equally

     Corresponding Author:
     Chien-Hua Huang, MD
     Department of Emergency Medicine
     National Taiwan University Hospital
     #7 Chung-Shan South Road
     Taipei, 100
     Taiwan
     Phone: 886 0972651304
     Email: chhuang5940@ntu.edu.tw

     Abstract
     Background: In-hospital cardiac arrest (IHCA) is associated with high mortality and health care costs in the recovery phase.
     Predicting adverse outcome events, including readmission, improves the chance for appropriate interventions and reduces health
     care costs. However, studies related to the early prediction of adverse events of IHCA survivors are rare. Therefore, we used a
     deep learning model for prediction in this study.
     Objective: This study aimed to demonstrate that with the proper data set and learning strategies, we can predict the 30-day
     mortality and readmission of IHCA survivors based on their historical claims.
     Methods: National Health Insurance Research Database claims data, including 168,693 patients who had experienced IHCA
     at least once and 1,569,478 clinical records, were obtained to generate a data set for outcome prediction. We predicted the 30-day
     mortality/readmission after each current record (ALL-mortality/ALL-readmission) and 30-day mortality/readmission after IHCA
     (cardiac arrest [CA]-mortality/CA-readmission). We developed a hierarchical vectorizer (HVec) deep learning model to extract
     patients’ information and predict mortality and readmission. To embed the textual medical concepts of the clinical records into
     our deep learning model, we used Text2Node to compute the distributed representations of all medical concept codes as a
     128-dimensional vector. Along with the patient’s demographic information, our novel HVec model generated embedding vectors
     to hierarchically describe the health status at the record-level and patient-level. Multitask learning involving two main tasks and
     auxiliary tasks was proposed. As CA-mortality and CA-readmission were rare, person upsampling of patients with CA and
     weighting of CA records were used to improve prediction performance.
     Results: With the multitask learning setting in the model learning process, we achieved an area under the receiver operating
     characteristic of 0.752 for CA-mortality, 0.711 for ALL-mortality, 0.852 for CA-readmission, and 0.889 for ALL-readmission.
     The area under the receiver operating characteristic was improved to 0.808 for CA-mortality and 0.862 for CA-readmission after
     solving the extremely imbalanced issue for CA-mortality/CA-readmission by upsampling and weighting.
     Conclusions: This study demonstrated the potential of predicting future outcomes for IHCA survivors by machine learning.
     The results showed that our proposed approach could effectively alleviate data imbalance problems and train a better model for
     outcome prediction.

     (J Med Internet Res 2021;23(9):e27798) doi: 10.2196/27798

     https://www.jmir.org/2021/9/e27798                                                                J Med Internet Res 2021 | vol. 23 | iss. 9 | e27798 | p. 1
                                                                                                                     (page number not for citation purposes)
XSL• FO
RenderX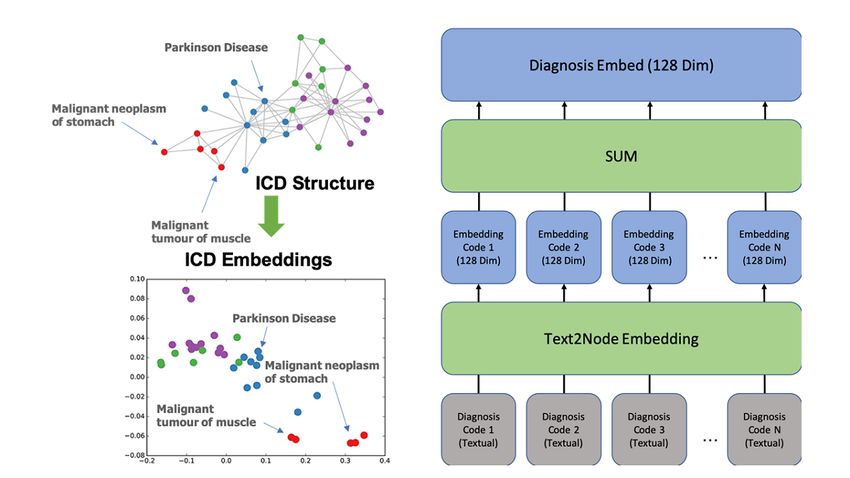
JOURNAL OF MEDICAL INTERNET RESEARCH                                                                                                       Chi et al

     KEYWORDS
     in-hospital cardiac arrest; 30-day mortality; 30-day readmission; machine learning; imbalanced dataset

                                                                          of patients. To achieve a better performance, we developed a
     Introduction                                                         novel deep learning model, hierarchical vectorizer (HVec), to
     Background                                                           analyze the patients’ historical EHRs and predict mortality and
                                                                          readmission. This study aimed to demonstrate that with the
     In the United States, approximately 209,000 patients experience      proper data set and learning strategies, we can predict the
     in-hospital cardiac arrest (IHCA) each year [1]. The rate of         outcome of IHCA patients based on their historical claims and
     survival to hospital discharge is around 14%, and only 7% of         help clinicians design more effective intervention programs.
     IHCA patients could regain an independent life or a partially
     independent life [2]. In order to reduce the severe effect of IHCA   Methods
     on personal life or society, identifying measures to improve
     IHCA outcomes is crucial.                                            Data Collection
     Prior Work                                                           This study was approved by the Institutional Review Board of
     Prognostic factors and prediction tools for survivors of IHCA        National Taiwan University Medical College. The IHCA cohort
     and their neurologic outcomes have been identified in previous       extracted from the NHIRD consisted of 168,693 patients who
     studies [3-8]. However, the evidence of an early warning system      had at least one IHCA event over 9 years (between January 1,
     for predicting the mortality of IHCA survivors is limited.           2002, and December 31, 2010). The Taiwan National Health
     Current early warning scoring systems using physiologic              Insurance program is the only health insurance scheme in
     track-and-trigger systems (TTSs) have been developed for             Taiwan and covers up to 99.99% of Taiwan’s population [16].
     identifying patients at risk for IHCA or other serious outcomes      The NHIRD contains all health records in inpatient and
     including mortality [9-11]. Most of TTSs rely on the routine         outpatient settings (clinic or emergency department); however,
     observations of vital signs carried out by ward staff. Although      the records cannot be specifically linked to each patient.
     many patients could be monitored with this approach, the quality     International Classification of Disease, 9th Revision (ICD-9)
     of evidence underpinning the use of TTSs is poor. Specifically,      was used during the study period for diagnosis and medical
     most TTSs have low sensitivity, low positive predictive values,      procedures. The NHIRD contains medical information, including
     and high specificity [12,13]. In addition to the high mortality       gender, age, diagnosis, medical procedure, operation,
     after IHCA, readmission after IHCA has a significant cost            medication, laboratory test, care site, discharge status, and cost
     burden and is associated with comorbidities. Predicting              of each hospital visit. Laboratory test results and bedside
     readmission events provides the chance for appropriate               information, including vital signs, blood pressure, and physical
     interventions and reducing health care costs, including further      examination, are not included in the NHIRD.
     readmission [14,15].                                                 The IHCA population was defined by inpatient records with
                                                                          the ICD-9 procedure codes 99.60 (cardiopulmonary
     Our Study
                                                                          resuscitation, not otherwise specified) and 99.63 (closed-chest
     Here, we first extracted the IHCA cohort from the National           cardiac massage) [17]. We used the extract, transform, and load
     Health Insurance Research Database (NHIRD). We assessed              (ETL, see Figure 1) procedure to process raw data into a clean
     their risk based on historical electronic health records (EHRs)      database by eliminating records with missing or invalid
     in the NHIRD. To provide a long enough window for clinical           information. Raw data in the cleaned database were re-grouped
     intervention, we used the 30-day mortality and readmission           into three major categories (insurer, person, and caregiver) to
     after IHCA as our prediction targets. In contrast to TTSs, EHRs      improve data organization. In addition, vocabulary tables were
     are prepared by physicians, and they contain several important       constructed based on extracted concepts that were used in the
     medical information, including the diagnosis and management          raw data.

     https://www.jmir.org/2021/9/e27798                                                            J Med Internet Res 2021 | vol. 23 | iss. 9 | e27798 | p. 2
                                                                                                                 (page number not for citation purposes)
XSL• FO
RenderX
JOURNAL OF MEDICAL INTERNET RESEARCH                                                                                                                 Chi et al

     Figure 1. ETL process for converting raw NHIRD data into the data set. The raw data are extracted, transformed, and loaded into the cleaned database
     after cohort selection and eliminating the invalid data. ETL: extract, transform, load; ICD: International Classification of Disease; NHIRD: National
     Health Insurance Research Database.

                                                                                 For comparison, we trained two single-task models for both
     Experimental Data Set                                                       mortality and readmission. Person upsampling and event
     The 168,693 patients in the data set were split into three data             weighting were only performed on the training data set so as
     sets: train, validation, and test. The training data set (70% of            not to affect the distribution of the validation and test data set.
     the data set) was used to train each model. The remaining 30%               The F1 score and area under the receiver operating characteristic
     of patients were split between the validation and test data set             (AUROC) were our main evaluation metrics.
     evenly to tune the hyperparameters (Table 1) and evaluate model
     performance, respectively.

     Table 1. Hyperparameter settings.
         Hyperparameter                                                                 Value
         Visit embed size                                                               200

         RNNa output size                                                               128

         Learning rate                                                                  1e-3
         Dropout rate                                                                   0.5
         l2_weights                                                                     0.01
         Code embed size                                                                128

     a
         RNN: recurrent neural network.

                                                                                 2 and 3). The input features consisted of five major groups
     Input Features                                                              described as follows:
     In the retrospective review of the data set, each person may
                                                                                 1.   Medical records consisted of five types of codes, and all
     have multiple clinical records (inpatient/outpatient visit) to the
     hospital within a 9-year period. Each clinical record was set as                 codes in the clinical records were mapped to over 400,000
     a unit of analysis. For each clinical record, information was                    clinical concepts. The health status of the patient in the
     extracted and grouped into input and target features (see Tables                 current record can be determined from this group.

     https://www.jmir.org/2021/9/e27798                                                                      J Med Internet Res 2021 | vol. 23 | iss. 9 | e27798 | p. 3
                                                                                                                           (page number not for citation purposes)
XSL• FO
RenderX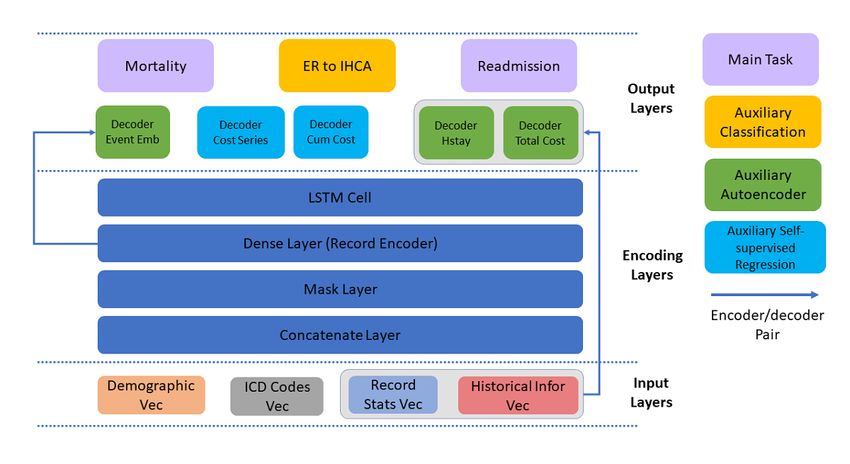
JOURNAL OF MEDICAL INTERNET RESEARCH                                                                                                                          Chi et al

     2.      Demographics included the age, gender, and information                           Classification of Disease (ICD) code category, and the total
             of the targeted patients.                                                        monetary cost involved. This could help the model estimate
     3.      Care site information included information of the clinical                       the severity of the patient’s disease at the record level.
             institution where the patient received treatment.                           5.   Historical information described previous hospital stays
     4.      Record statistics provided information on the length (by                         and admissions. It was used to estimate the overall health
             day) of the record, the number of codes in each International                    status of the patient in our model.

     Table 2. Summary of the input features of the model.
         Group and feature name                          Feature description                                                                                 Dimension
         Medical records
             Diagnosis                                   Diagnosis codes from the health record                                                              128
             Procedures                                  Procedure codes from the health record                                                              128
             Meds                                        Medication codes from the health record                                                             128
             Tests                                       Lab test codes from the health record                                                               128
             Other                                       Other codes from the health record                                                                  128
         Demographics
             Claim type                                  Inpatient or outpatient                                                                             2
             Age                                         Age at the event                                                                                    1
             Gender                                      Male or female                                                                                      2
         Care site information
             Care site type                              Type of site (public, corporate, or private)                                                        21
             Care site specialization                    Medical center, community hospital, district hospital, regional hospital, or clinic                 5
             Care site rank                              Rank of the care site                                                                               17
         Record statistics
             Hospital stay                               Duration of current hospital stay                                                                   1
             Total cost                                  Monetary cost of each of the five ICDa codes                                                        5

             Total count                                 Counts of each of the five ICD codes                                                                5
         Historical information
             Past hospitalization duration               The number of days a person spends in the hospital within 3, 6, 12, and 24 months                   4
             Past admission count                        The number of times a person is admitted to the hospital within 3, 6, 12, and 24 months             4

     a
         ICD: International Classification of Disease.

     Table 3. Summary of the prediction targets.
         Group and feature name              Feature description                                                                                   Dimension
         Main target
             Mortality                       Whether this event would lead to another mortality event in (within 1 to 30) days                     1
             Readmission                     Whether this event would lead to another readmission event in (within 1 to 30) days                   1

                                                                                         records. Our initial results showed that the features of mortality
     Targets                                                                             records usually contain information (eg, respiratory failure)
     A threshold of 30 days was set to predict whether a person                          explicitly indicating patient mortality. Indeed, these features
     would die or readmit within 30 days. Mortality was defined                          are significant factors for predicting mortality. However, such
     when the patient had an inpatient or outpatient record of                           cases are not beneficial to our model as the severe condition of
     mortality or was discharged under critical condition following                      these patients makes it hard to treat them with any intervention.
     IHCA. For readmission, whether the patient is readmitted within                     Moreover, the high degree of correlation of these features and
     1 to 30 days from hospital discharge was predicted. In contrast                     mortality would cause the model to rely on them and
     to other mortality studies, records with mortality (0-day                           underestimate other potential predictive factors. In order to
     mortality record) were excluded in our study. The main purpose                      avoid leakage and let the model focus on other predictive factors,
     of this strategy was to reduce the “leakage” of features in these
     https://www.jmir.org/2021/9/e27798                                                                              J Med Internet Res 2021 | vol. 23 | iss. 9 | e27798 | p. 4
                                                                                                                                   (page number not for citation purposes)
XSL• FO
RenderX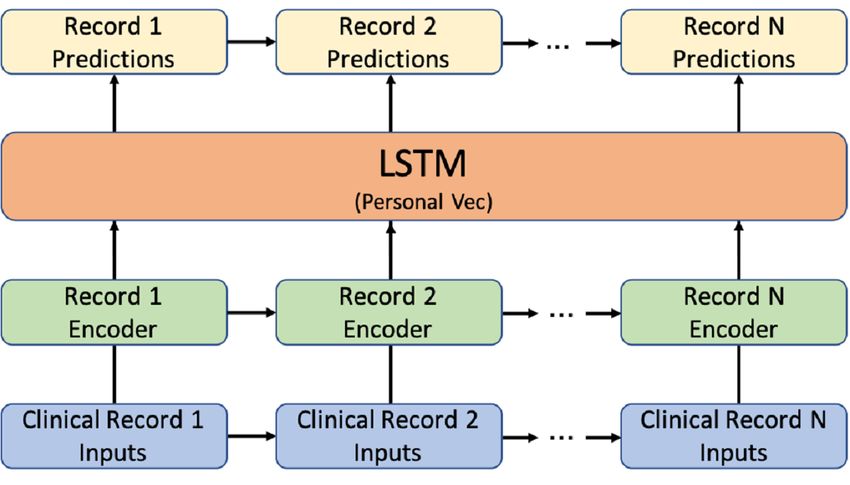
JOURNAL OF MEDICAL INTERNET RESEARCH Chi et al
mortality records were set as the negative class, and previous CA-mortality/CA-readmission) is a subset of 30-day mortality
records of mortality (within 30 days) were the positive class. or readmission. In the rest of the paper, ALL-mortality/
ALL-readmission will be used to represent the 30-day mortality
In clinical practice, the 30-day outcomes of patients after IHCA
or readmission for all records. CA-mortality/CA-readmission
and discharge from hospitalization are of great interest. The
refers to the 30-day mortality or readmission following CA
30-day mortality or readmission after cardiac arrest (CA;
(Figure 2).
Figure 2. ALL/CA-mortality and ALL/CA-readmission. 3 scenarios of 30-days mortality & readmission after cardiac arrest. Events in red are the
outcomes we want to predict. ALL-mortality: 30-day mortality after all records; ALL-readmission: 30-day readmission after all records; CA: cardiac
arrest; CA-mortality: 30-day mortality after cardiac arrest records; CA-readmission: 30-day readmission after cardiac arrest records.
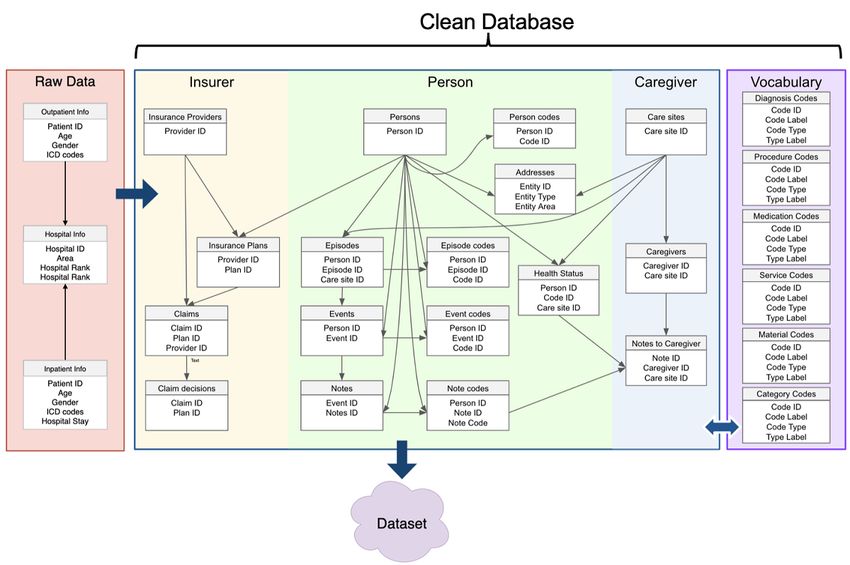
ALL-mortality/ALL-readmission is more common than encoding. The features of ICD codes were extracted directly
CA-mortality/CA-readmission as most people would not survive from the health record. A medical knowledge embedding system
after the first CA event. This means that when we want to predict called Text2Node was used to embed the textual features into
the future outcome of a recovered CA patient, we do not have vectors [18]. Each of the five categories of ICD codes could
enough positive cases for analysis. contain many ICD codes from a single record, and all codes
were added together as a single code for a given category (see
Hierarchical Vectorizer (HVec) Figure 3 as an example). Trained from a substantial medical
Each record was constructed into a 707-dimension vector for knowledge database, Text2Node can effectively transform the
further training. Based on Table 1, all features except for ICD textual medical concepts into a latent space while preserving
code features (textual features) can be vectorized with one-hot the relationship of similar concepts.
https://www.jmir.org/2021/9/e27798 J Med Internet Res 2021 | vol. 23 | iss. 9 | e27798 | p. 5
(page number not for citation purposes)
XSL• FO
RenderXJOURNAL OF MEDICAL INTERNET RESEARCH Chi et al
Figure 3. Example of Text2Node embedding [18] and code embedding for diagnosis codes in a clinical record. Dim: dimension; ICD: International
Classification of Disease.
For each clinical record, by concatenating all feature vectors vector according to the date, time series techniques were used
into group vectors hierarchically (see Figure 4), the clinical to train a model to predict the outcomes of each record.
record vector was obtained. After sorting each clinical record
Figure 4. Feature concatenation to generate clinical record vectors for time series analysis. ICD: International Classification of Disease; Vec: vector.
record encoder was a fully-connected layer that generated the
Model Architecture record embedding for each clinical record independently. The
Deep recurrent neural networks (RNNs) have been proven to record embedding was a latent vector that contained all the
be a powerful tool for predicting time series data. In clinical information representing the current clinical record. This latent
research, the use of RNNs, especially long short-term memory vector was used as the input of the LSTM to update the person
(LSTM), for clinical prediction has been widely investigated vector (ie, patient status). This person vector was then used to
[19-21]. Inspired by Choi’s work [19], we proposed an HVec predict our targets.
model using LSTM networks (Figure 5). In this framework, the
https://www.jmir.org/2021/9/e27798 J Med Internet Res 2021 | vol. 23 | iss. 9 | e27798 | p. 6
(page number not for citation purposes)
XSL• FO
RenderXJOURNAL OF MEDICAL INTERNET RESEARCH Chi et al
Figure 5. HVec model using LSTM networks. HVec: hierarchical vectorizer; LSTM: long short-term memory; Vec: vector.
However, most previous studies were based on a relatively the distribution was different, they still can be achieved
balanced data set. As we pointed out earlier, the distribution of simultaneously with the proposed person upsampling and CA
CA-mortality/CA-readmission is extremely imbalanced. record weighting (described in the next section). Inspired by a
Training LSTM networks with an extremely imbalanced data previous study [22], three auxiliary autoencoder tasks were
set is always challenging because, without a carefully designed introduced to help the model learn the embeddings (Figure 6).
training strategy, the model could be biased (ie, predicting the Two self-supervised regression tasks were also introduced to
negative class for all records). In order to address this problem, allow the embedding to “memorize” the current cost and predict
two different training strategies have been proposed to alleviate the future cost. Furthermore, another classification task was
model bias during the training step: implemented to predict whether a record is an IHCA record
1.
considering that we observed the correlation of IHCA to
The multitask learning framework was introduced to
mortality in the previous analysis.
combine several related learning tasks to regularize the
gradient and alleviate data imbalance problems during To monitor the gradients of different tasks and regularize the
training. learning process with auxiliary tasks, Theorem 1 was adopted
2. At the person level, CA-mortality/CA-readmission records from Du et al [23].
were upsampled, and at the record level, higher weights
were assigned to CA records. Theorem 1 given any gradient vector field G(θ(t)) = ∇θ (θ) (1)
to denote the main task and an arbitrary vector field V(θ(t)) to
Multitask Learning
denote the gradient from another auxiliary task, the update
The multitask learning framework was proposed, and several strategy using:
auxiliary related tasks were added to the HVec outputs (Figure
6). In this framework, the main functions were mortality and θ(t+1) := θ(t) - α(t) (G(θ(t)) + V(θ(t)) + max (0,
readmission. Here, instead of dividing each main task output cos(G(θ(t)), V(θ(t)))) (2)
into ALL-mortality/ALL-readmission and CA-mortality/ with a proper can coverage to a local minimum.
CA-readmission independently, an output was considered to
cover both because the latter is a subset of the former. Although Following this theorem, HVec can learn and converge with a
large data set.
https://www.jmir.org/2021/9/e27798 J Med Internet Res 2021 | vol. 23 | iss. 9 | e27798 | p. 7
(page number not for citation purposes)
XSL• FO
RenderXJOURNAL OF MEDICAL INTERNET RESEARCH Chi et al
Figure 6. Multiple outputs for multitask learning. Cum: cumulative; Emb: embedding; ER: emergency room; Hstay: hospital staying; ICD: International
Classification of Disease; IHCA: in-hospital cardiac arrest; Infor: information; LSTM: long short-term memory; Stats: statistics; Vec: vector.
assigned to CA records to make the objective function more
Person Upsampling and CA Record Weighting sensitive to CA-mortality/CA-readmission records. The
Although the gradients from different tasks can be monitored upsampling of patients with CA-mortality/CA-readmission
in multitask learning, with a heavily imbalanced data set (eg, records can guarantee that at the person level, there are more
CA-mortality), the auxiliary tasks may fail to regularize the CA-mortality/CA-readmission records [25].
main task. When we trained the HVec model, all records of a
person were treated as a single sequential record and fed together Assigning a higher weight to CA records could also emphasize
into the model. Therefore, in each batch, the batch size was the CA records during training by modifying the loss functions
equal to the number of people in the batch. Compared with the accordingly. Considering N-loss functions {L1,…,LN}
number of all records, the number of CA records for each person corresponding to auxiliary tasks, the loss function can be written
was relatively rare. CA-mortality and CA-readmission were as (3).
rare compared with ALL-mortality and ALL-readmission.
The weighting strategy [24] was proposed to solve this problem Where (4) is a function that equals 1 if the statement in the
from two perspectives: at the person level, patients with bracket is true and otherwise 0; wpos and wneg are the positive
CA-mortality/CA-readmission records were upsampled per and negative class weight, respectively. Combined with the
batch (see Figure 7); at the record level, a higher weight was gradient update strategy in equation 1, the HVec can learn from
the extremely imbalanced data set effectively.
https://www.jmir.org/2021/9/e27798 J Med Internet Res 2021 | vol. 23 | iss. 9 | e27798 | p. 8
(page number not for citation purposes)
XSL• FO
RenderXJOURNAL OF MEDICAL INTERNET RESEARCH Chi et al
Figure 7. Person upsampling.
(dentist records, traditional medicine records, or local clinic
Results records) were excluded because these records were concentrated
Overview with repetitive conditions and mainly added noise to the machine
learning models (Figure 8).
A total of 168,693 patients and 4,622,079 clinical records were
extracted from the NHIRD over 9 years, and 3,052,601 records
https://www.jmir.org/2021/9/e27798 J Med Internet Res 2021 | vol. 23 | iss. 9 | e27798 | p. 9
(page number not for citation purposes)
XSL• FO
RenderXJOURNAL OF MEDICAL INTERNET RESEARCH Chi et al
Figure 8. CONSORT diagram of the study cohort. ALL-mortality: 30-day mortality after all records; ALL-readmission: 30-day readmission after all
records; CA: cardiac arrest; CA-mortality: 30-day mortality after CA records; CA-readmission: 30-day readmission after CA records; IHCA: in-hospital
cardiac arrest.
There were 1,569,478 clinical records in the cleaned database, The age of the patients in the data set ranged from 0 (newborn)
including both inpatient and outpatient records, from 168,693 to 118 years (mean age 68.66, SD 18.96 years), including
patients (mean number of records per person: 9.30, SD 10.90) 104,691 females and 64,002 males. Overall, 164,322 patients
who have experienced at least one IHCA event. The results (97.4%) had CA only once, 4,174 patients (2.4%) had CA twice,
indicate an imbalanced data set, where the most imbalanced and only 197 patients (0.2%) had CA more than twice. Death
task was CA-mortality with a ratio of 0.53%. The characteristics was recorded for 87,311 patients (51.75% mortality rate). Of
of the study population are summarized in Table 4. There were these 87,311 patients, 82,225 patients died during their first
173,345 IHCA records (11.04% of the total clinical records), hospitalization for CA (94.17%; Figure 9).
and on average, there were 1.02 IHCA records for each person.
Table 4. Characteristics of the study population.a
Characteristics Study population (N=168,693)
Age (years), mean (SD) 68.66 (18.96)
Gender (male), n (%) 64,002 (37.9)
Record number per person, mean (SD) 9.30 (10.90)
Cardiac arrest frequency, n (%)
1 164,322 (97.4)
2 4174 (2.4)
≥3 197 (0.2)
Mortality, n (%) 87,311 (51.75)
a
Continuous variables are presented as the mean (SD), and categorical variables are presented as the number (percentage of the study population).
https://www.jmir.org/2021/9/e27798 J Med Internet Res 2021 | vol. 23 | iss. 9 | e27798 | p. 10
(page number not for citation purposes)
XSL• FO
RenderXJOURNAL OF MEDICAL INTERNET RESEARCH Chi et al
Figure 9. Age and mortality statistics of the data set. CA: cardiac arrest.
terms of the AUROC and F1 scores. Based on single-task and
Experiment 1: Single-Task Learning Versus Multitask multitask results, there was a relatively high improvement in
Learning performance for the extremely imbalanced CA-mortality task
In this experiment, person upsampling and event weighting compared with the ALL-mortality task. However, the precision
were not applied. The model performance is summarized in was relatively low due to the imbalance ratio, which also
Tables 5 and 6. affected the F1 score. Moreover, the F1 score of CA-mortality
was too low for real-life applications.
As shown in Table 5, multitask learning could improve the
model performance for ALL-mortality and CA-mortality in
Table 5. Single-task and multitask learning performance for CA-mortality and ALL-mortality.a
Mortality CA-mortality ALL-mortality
AUROCb F1 Precision Recall AUROC F1 Precision Recall
Single-task learning 0.658 0.014 0.010 0.024 0.663 0.130 0.101 0.180
Multitask learning 0.752 0.049 0.041 0.060 0.711 0.147 0.093 0.349
a
CA-mortality: cardiac arrest mortality (30-day mortality after CA records); ALL-mortality: 30-day mortality after all records.
b
AUROC: area under the receiver operating characteristic.
As shown in Table 6, the improvement in multitask learning mortality prediction. Furthermore, in CA-readmission prediction,
for readmission prediction was not as significant as that for the F1 score and precision were decreased.
Table 6. Single-task and multitask learning performance for CA-readmission and ALL-readmission.a
Readmission CA-readmission ALL-readmission
AUROCb F1 Precision Recall AUROC F1 Precision Recall
Single-task learning 0.847 0.214 0.162 0.315 0.872 0.554 0.424 0.801
Multitask learning 0.852 0.209 0.152 0.335 0.889 0.562 0.430 0.811
a
CA-readmission: cardiac arrest readmission (30-day readmission after CA records); ALL-readmission: 30-day readmission after all records.
b
AUROC: area under the receiver operating characteristic.
In this experiment, compared with single-task learning, multitask experiment, we demonstrated that by applying person
learning could achieve a better performance for ALL-mortality upsampling and event weighting, we could further improve the
and ALL-readmission. However, multitask learning could not performance for CA-mortality and CA-readmission without
solve the extremely imbalanced data set. considerably affecting ALL-mortality and ALL-readmission.
In our experiment, the upsampling rate indicates how many
Experiment 2: Improving CA Prediction Performance times upsampling was performed for the positive class (patients
Experiment 1 showed that models had difficulties making good with CA-mortality or CA-readmission) in a batch, and an
predictions based on the CA-mortality and CA-readmission upsampling rate of 1 means we did not perform upsampling.
data due to the extremely imbalanced data set. In this The CA event weight indicates the loss weight wpos in equation
https://www.jmir.org/2021/9/e27798 J Med Internet Res 2021 | vol. 23 | iss. 9 | e27798 | p. 11
(page number not for citation purposes)
XSL• FO
RenderXJOURNAL OF MEDICAL INTERNET RESEARCH Chi et al
3, and we always set wneg=1. We used different upsampling performance when applying balancing techniques. As shown
rates and event weights in our experiments. Our results are in Table 7, after upsampling and event weighting, the models
summarized in Tables 7 and 8, including the previous results demonstrated improved performance for both ALL-mortality
on single-task model performance (first row of each table). and CA-mortality. For CA-mortality, the F1 score was increased
by 36.7% (from 0.049 to 0.067).
Overall, compared with the 30-day mortality task, the
imbalanced 30-day mortality task showed a larger increase in
Table 7. Mortality models with their respective hyperparameter configuration and their performance in predicting both CA-mortality and ALL-mortality.a
Mortality CA-mortality ALL-mortality
Upsampling rate Event weight Multitask AUROCb F1 AUROC F1
1 1 No 0.658 0.014 0.663 0.130
1 1 Yes 0.752 0.049 0.711 0.147
10 1 Yes 0.808 0.064 0.728 0.155
10 5 Yes 0.802 0.067 0.726 0.158
a
CA-mortality: cardiac arrest mortality (30-day mortality after CA records); ALL-mortality: 30-day mortality after all records.
b
AUROC: area under the receiver operating characteristic.
Similar to ALL-mortality and CA-mortality, the AUROC and in CA-readmission prediction. However, there was no significant
F1 score were increased for both ALL-readmission and improvement in ALL-readmission prediction. This is because
CA-readmission by applying the two techniques. Based on the upsampling and event weighting would not greatly affect the
results in Table 8, a minor but consistent increase was achieved learning process for a more balanced data set.
Table 8. Readmission models with their respective hyperparameter configuration and their performance in predicting CA-readmission and
ALL-readmission.a
Readmission CA-readmission ALL-readmission
Upsampling rate Event weight Multitask AUROCb F1 AUROC F1
1 1 No 0.847 0.214 0.872 0.554
1 1 Yes 0.852 0.209 0.889 0.562
5 1 Yes 0.861 0.230 0.884 0.555
5 5 Yes 0.862 0.237 0.884 0.555
a
CA-readmission: cardiac arrest readmission (30-day readmission after CA records); ALL-readmission: 30-day readmission after all records.
b
AUROC: area under the receiver operating characteristic.
In summary, the results indicated that multitask learning, improvements were achieved in CA-mortality and CA-admission
upsampling, and event weighting could effectively improve the prediction.
model prediction performance for an imbalanced data set. We
In contrast to other studies using deep learning models to predict
also showed that these techniques could be collectively used to
another IHCA event after CA [26], our study focused on
achieve better results for an extremely imbalanced data set.
predicting the future outcomes of IHCA patients after discharge.
To the best of our knowledge, this is the first study to predict
Discussion mortality and readmission after IHCA events by machine
In this study, we constructed a large patient database that learning. The model may serve as a surveillance system for
includes 9 years of EHRs for over 168,000 IHCA patients, which those who experienced IHCA. Patients with a high risk of
can be used for future IHCA-related research. In addition, we mortality or readmission in the near future could be identified
developed an HVec model (LSTM model) that uses a multitask and re-evaluated before discharge. This study also demonstrated
learning strategy to predict the 30-day mortality and the potential of another model for predicting future mortality
readmission. and readmission after each record using previous EHRs
(ALL-mortality/ALL-readmission). The model might help
The results showed that our model could successfully predict identify those with a high risk in inpatient and outpatient
future mortality and readmission using EHR data for IHCA situations. However, mortality and readmission rates are
patients. We proposed the person upsampling and record different in the general population compared with the patients
weighting strategies to handle the extremely imbalanced data selected in this study. Using hospital EHRs with patients’
problem in this study. After applying these techniques, some information in the NHIRD, we can construct a real-time alert
https://www.jmir.org/2021/9/e27798 J Med Internet Res 2021 | vol. 23 | iss. 9 | e27798 | p. 12
(page number not for citation purposes)
XSL• FO
RenderXJOURNAL OF MEDICAL INTERNET RESEARCH Chi et al
system based on machine learning methods to predict the as Deep Patient [22] and MixEHR [27], we showed that the use
adverse events of IHCA survivors and improve their outcomes. of deep neural networks to extract information from EHRs might
Further prospective studies are needed to verify the utility of solve complex clinical research problems.
this system in the general population.
An imbalanced data distribution is common in clinical research,
Several studies have reported models for predicting the especially for disease-related predictions. In comparison with
outcomes of CA patients [8]. In a systematic review of current common diseases, many important diseases lack positive cases,
prediction models, the median AUROC value was 0.84 with an making it difficult to train a good model. In a previous study
IQR of 0.80 to 0.89 [8]. For IHCA survivors, Chan et al. [19], the authors attempted to address this problem by using a
reported that the cardiac arrest survival post-resuscitation balanced, distributed data set and train a deep learning model
in-hospital (CASPRI) score could be used to predict favorable with the balanced data set. Similarly, in this study involving
neurologic outcomes after discharge [3]. The AUROC of the CA-mortality and CA-readmission, we demonstrated that by
CASPRI score was 0.80. Nanayakkara et al used deep learning carefully designing model learning strategies (eg, multitask
models to predict the IHCA events of CA survivors, and the learning and upsampling), some common problems in clinical
AUROC was 0.87 [26]. In our study, we encountered the research could be solved effectively with machine learning
difficulty of imbalanced data. Using proper learning strategies, models.
we achieved comparable AUROC values (0.808 for
This study has some limitations. First, the IHCA cohort was
CA-mortality and 0.862 for CA-readmission). However, the
retrospectively extracted from the NHIRD. Further studies are
recall and precision rates were low in our study due to
needed to evaluate the efficacy of this model as an early warning
imbalanced data. This is a challenge we aim to resolve. When
system and determine how this system affects patients’
using historical medical records to predict outcomes, in many
outcomes. Second, as our model was developed based on the
cases, the records contain information that may indicate the
NHIRD, the generalization of this model to other health
outcomes. For example, critical diagnosis and rescue medication
insurance data sets is not proven. Third, each patient’s vital
are often associated with mortality. Including these types of
signs and laboratory data were not included in the analysis due
information can facilitate training and give a high AUROC and
to the study design. A combination of EHRs and patients’
F1; however, the model itself is of limited use. Mortality records
clinical data may further improve model performance. Fourth,
were set as the negative class in our study to avoid overfitting.
traditional machine learning methods have the limitation of
In further studies, the model may be improved by adjusting the
interpretability. Specific risk factors for 30-day
threshold to optimize the trade-off between specificity and
mortality/readmission were unknown in this study. In future
sensitivity.
studies, we plan to develop an explainable model and investigate
In our HVec framework, we encoded each person’s EHRs in specific predictive factors in the model.
two levels of latent vectors (record-level and person-level) and
In summary, our model showed good performance in predicting
ensured that the model learns both simultaneously using the
30-day mortality and readmission after IHCA, which can help
unsupervised autoencoder strategy. The predictive results were
clinicians monitor CA patients' status better. We aim to provide
promising with these latent vectors. The latent vectors in these
more insights to clinicians with proactive intervention
two levels may be further explored to facilitate clinicians’
recommendations. Nevertheless, a challenge remains in the
decision-making and provide better clinical interventions. In
interpretative ability of the deep learning model. Our future
addition, the person vector may be used as a biomarker to
work will mainly focus on the interpretative power of the model
evaluate the overall health status of a person beyond the health
trained using EHRs.
care setting. Along with some recently developed models such
Acknowledgments
This study was supported by the Ministry of Science and Technology, Taiwan (project: 109-2634-F-002-031). CYC, YLH, and
CHH were involved in data collection. SA, AW, KCF, and JX were involved in constructing the deep learning model. CYC and
SA contributed equally to this paper and drafted the article. Finally, YLH, CHH, and RS made the final revision. YLH, CHH,
and RS contributed equally as corresponding authors. All authors approved the final version of the article.
Conflicts of Interest
None declared.
References
1. Writing GM, Mozaffarian D, Benjamin EJ, Go AS, Arnett DK, Blaha MJ, et al. Heart Disease and Stroke Statistics-2016
Update: A Report From the American Heart Association. Circulation 2016 Jan 26;133(4):e38-e360. [doi:
10.1161/CIR.0000000000000350] [Medline: 26673558]
2. Wang C, Huang C, Chang W, Tsai M, Yu P, Wu Y, et al. Outcomes of Adult In-Hospital Cardiac Arrest Treated with
Targeted Temperature Management: A Retrospective Cohort Study. PLoS One 2016;11(11):e0166148 [FREE Full text]
[doi: 10.1371/journal.pone.0166148] [Medline: 27820847]
https://www.jmir.org/2021/9/e27798 J Med Internet Res 2021 | vol. 23 | iss. 9 | e27798 | p. 13
(page number not for citation purposes)
XSL• FO
RenderXJOURNAL OF MEDICAL INTERNET RESEARCH Chi et al
3. Chan PS, Spertus JA, Krumholz HM, Berg RA, Li Y, Sasson C, Get With the Guidelines-Resuscitation Registry Investigators.
A validated prediction tool for initial survivors of in-hospital cardiac arrest. Arch Intern Med 2012 Jun 25;172(12):947-953
[FREE Full text] [doi: 10.1001/archinternmed.2012.2050] [Medline: 22641228]
4. Holmberg MJ, Moskowitz A, Raymond TT, Berg RA, Nadkarni VM, Topjian AA, American Heart Association’s Get With
The Guidelines-Resuscitation Investigators. Derivation and Internal Validation of a Mortality Prediction Tool for Initial
Survivors of Pediatric In-Hospital Cardiac Arrest. Pediatr Crit Care Med 2018 Mar;19(3):186-195 [FREE Full text] [doi:
10.1097/PCC.0000000000001416] [Medline: 29239980]
5. Chan PS, Nallamothu BK, Krumholz HM, Spertus JA, Li Y, Hammill BG, American Heart Association Get with the
Guidelines–Resuscitation Investigators. Long-term outcomes in elderly survivors of in-hospital cardiac arrest. N Engl J
Med 2013 Mar 14;368(11):1019-1026 [FREE Full text] [doi: 10.1056/NEJMoa1200657] [Medline: 23484828]
6. Chelly J, Mpela A, Jochmans S, Brunet J, Legriel S, Guerin L, et al. OHCA (Out-of-Hospital Cardiac Arrest) and CAHP
(Cardiac Arrest Hospital Prognosis) scores to predict outcome after in-hospital cardiac arrest: Insight from a multicentric
registry. Resuscitation 2020 Nov;156:167-173. [doi: 10.1016/j.resuscitation.2020.09.021] [Medline: 32976962]
7. Chung C, Chiu W, Huang Y, Chan L, Hong C, Chiu H. Identifying prognostic factors and developing accurate outcome
predictions for in-hospital cardiac arrest by using artificial neural networks. J Neurol Sci 2021 Jun 15;425:117445. [doi:
10.1016/j.jns.2021.117445] [Medline: 33878655]
8. Carrick RT, Park JG, McGinnes HL, Lundquist C, Brown KD, Janes WA, et al. Clinical Predictive Models of Sudden
Cardiac Arrest: A Survey of the Current Science and Analysis of Model Performances. JAHA 2020 Aug 18;9(16):e017625.
[doi: 10.1161/jaha.119.017625]
9. Jansen JO, Cuthbertson BH. Detecting critical illness outside the ICU: the role of track and trigger systems. Curr Opin Crit
Care 2010 Jun;16(3):184-190. [doi: 10.1097/MCC.0b013e328338844e] [Medline: 20305556]
10. Smith GB, Prytherch DR, Schmidt PE, Featherstone PI. Review and performance evaluation of aggregate weighted 'track
and trigger' systems. Resuscitation 2008 May;77(2):170-179. [doi: 10.1016/j.resuscitation.2007.12.004] [Medline: 18249483]
11. Gao H, McDonnell A, Harrison DA, Moore T, Adam S, Daly K, et al. Systematic review and evaluation of physiological
track and trigger warning systems for identifying at-risk patients on the ward. Intensive Care Med 2007 Apr;33(4):667-679.
[doi: 10.1007/s00134-007-0532-3] [Medline: 17318499]
12. Sharpley JT, Holden JC. Introducing an early warning scoring system in a district general hospital. Nurs Crit Care
2004;9(3):98-103. [doi: 10.1111/j.1362-1017.2004.0063.x] [Medline: 15152751]
13. Priestley G, Watson W, Rashidian A, Mozley C, Russell D, Wilson J, et al. Introducing Critical Care Outreach: a
ward-randomised trial of phased introduction in a general hospital. Intensive Care Med 2004 Jul;30(7):1398-1404. [doi:
10.1007/s00134-004-2268-7] [Medline: 15112033]
14. Chan PS, Nallamothu BK, Krumholz HM, Curtis LH, Li Y, Hammill BG, American Heart Association’s Get With The
Guidelines-Resuscitation Investigators. Readmission rates and long-term hospital costs among survivors of an in-hospital
cardiac arrest. Circ Cardiovasc Qual Outcomes 2014 Nov;7(6):889-895 [FREE Full text] [doi:
10.1161/CIRCOUTCOMES.114.000925] [Medline: 25351479]
15. Morita Y, Haruna T, Haruna Y, Nakane E, Yamaji Y, Hayashi H, et al. Incidence, predictors, causes, and costs of 30-day
readmission after in-hospital cardiopulmonary resuscitation in the United States. Resuscitation 2019 Jan;134:19-25. [doi:
10.1016/j.resuscitation.2018.12.001] [Medline: 30566891]
16. Hsieh C, Su C, Shao S, Sung S, Lin S, Kao Yang Y, et al. Taiwan's National Health Insurance Research Database: past and
future. Clin Epidemiol 2019;11:349-358 [FREE Full text] [doi: 10.2147/CLEP.S196293] [Medline: 31118821]
17. DeZorzi C, Boyle B, Qazi A, Luthra K, Khera R, Chan PS, et al. Administrative Billing Codes for Identifying Patients
With Cardiac Arrest. J Am Coll Cardiol 2019 Apr 02;73(12):1598-1600 [FREE Full text] [doi: 10.1016/j.jacc.2019.01.030]
[Medline: 30922482]
18. Soltani R, Tomberg A. Text2node: a cross-domain system for mapping arbitrary phrases to a taxonomy. arXiv. 2019 Apr
11. URL: https://arxiv.org/abs/1905.01958v1 [accessed 2019-04-11]
19. Choi E, Bahadori MT, Schuetz A, Stewart WF, Sun J. Doctor AI: Predicting Clinical Events via Recurrent Neural Networks.
JMLR Workshop Conf Proc 2016 Aug;56:301-318 [FREE Full text] [Medline: 28286600]
20. Rajkomar A, Oren E, Chen K, Dai AM, Hajaj N, Hardt M, et al. Scalable and accurate deep learning with electronic health
records. NPJ Digit Med 2018;1:18 [FREE Full text] [doi: 10.1038/s41746-018-0029-1] [Medline: 31304302]
21. Shickel B, Tighe PJ, Bihorac A, Rashidi P. Deep EHR: A Survey of Recent Advances in Deep Learning Techniques for
Electronic Health Record (EHR) Analysis. IEEE J Biomed Health Inform 2018 Dec;22(5):1589-1604. [doi:
10.1109/JBHI.2017.2767063] [Medline: 29989977]
22. Miotto R, Li L, Kidd BA, Dudley JT. Deep Patient: An Unsupervised Representation to Predict the Future of Patients from
the Electronic Health Records. Sci Rep 2016 Dec 17;6:26094 [FREE Full text] [doi: 10.1038/srep26094] [Medline: 27185194]
23. Du Y, Czarnecki W, Jayakumar S, Pascanu R, Lakshminarayanan B. Adapting auxiliary losses using gradientsimilarity.
arXiv 2018 Dec 5:1812 [FREE Full text]
24. Haibo He, Garcia E. Learning from Imbalanced Data. IEEE Trans Knowl Data Eng 2009 Sep;21(9):1263-1284. [doi:
10.1109/TKDE.2008.239]
https://www.jmir.org/2021/9/e27798 J Med Internet Res 2021 | vol. 23 | iss. 9 | e27798 | p. 14
(page number not for citation purposes)
XSL• FO
RenderXJOURNAL OF MEDICAL INTERNET RESEARCH Chi et al
25. Ertekin Ş. Adaptive Oversampling for Imbalanced Data Classification. In: Gelenbe E, Lent R, editors. Information Sciences
and Systems 2013. Lecture Notes in Electrical Engineering, vol 264. Cham: Springer; Sep 24, 2013:261-269.
26. Nanayakkara S, Fogarty S, Tremeer M, Ross K, Richards B, Bergmeir C, et al. Characterising risk of in-hospital mortality
following cardiac arrest using machine learning: A retrospective international registry study. PLoS Med 2018
Nov;15(11):e1002709 [FREE Full text] [doi: 10.1371/journal.pmed.1002709] [Medline: 30500816]
27. Li Y, Nair P, Lu XH, Wen Z, Wang Y, Dehaghi AAK, et al. Inferring multimodal latent topics from electronic health
records. Nat Commun 2020 May 21;11(1):2536 [FREE Full text] [doi: 10.1038/s41467-020-16378-3] [Medline: 32439869]
Abbreviations
AUROC: area under the receiver operating characteristic
CA: cardiac arrest
CASPRI: cardiac arrest survival post-resuscitation in-hospital
CPR: cardiopulmonary resuscitation
EHR: electronic health record
ETL: extract, transform, and load
HVec: hierarchical vectorizer
ICD: International Classification of Disease
IHCA: in-hospital cardiac arrest
LSTM: long short-term memory
NHIRD: National Health Insurance Research Database
OHCA: out-of-hospital cardiac arrest
RNN: recurrent neural network
TTS: track-and-trigger system
Edited by R Kukafka; submitted 08.02.21; peer-reviewed by A Ćirković, W Yang, SF Sung, B Richards; comments to author 15.03.21;
revised version received 09.05.21; accepted 21.07.21; published 13.09.21
Please cite as:
Chi CY, Ao S, Winkler A, Fu KC, Xu J, Ho YL, Huang CH, Soltani R
Predicting the Mortality and Readmission of In-Hospital Cardiac Arrest Patients With Electronic Health Records: A Machine Learning
Approach
J Med Internet Res 2021;23(9):e27798
URL: https://www.jmir.org/2021/9/e27798
doi: 10.2196/27798
PMID:
©Chien-Yu Chi, Shuang Ao, Adrian Winkler, Kuan-Chun Fu, Jie Xu, Yi-Lwun Ho, Chien-Hua Huang, Rohollah Soltani. Originally
published in the Journal of Medical Internet Research (https://www.jmir.org), 13.09.2021. This is an open-access article distributed
under the terms of the Creative Commons Attribution License (https://creativecommons.org/licenses/by/4.0/), which permits
unrestricted use, distribution, and reproduction in any medium, provided the original work, first published in the Journal of
Medical Internet Research, is properly cited. The complete bibliographic information, a link to the original publication on
https://www.jmir.org/, as well as this copyright and license information must be included.
https://www.jmir.org/2021/9/e27798 J Med Internet Res 2021 | vol. 23 | iss. 9 | e27798 | p. 15
(page number not for citation purposes)
XSL• FO
RenderXYou can also read