PREDICTION OF PAST SARS-COV-2 INFECTIONS: A PROSPECTIVE COHORT STUDY AMONG SWISS SCHOOLCHILDREN - FRONTIERS
←
→
Page content transcription
If your browser does not render page correctly, please read the page content below
ORIGINAL RESEARCH
                                                                                                                                                       published: 16 August 2021
                                                                                                                                                 doi: 10.3389/fped.2021.710785

                                                Prediction of Past SARS-CoV-2
                                                Infections: A Prospective Cohort
                                                Study Among Swiss Schoolchildren
                                                Jacob Blankenberger 1 , Sarah R. Haile 1 , Milo A. Puhan 1 , Christoph Berger 2 ,
                                                Thomas Radtke 1† , Susi Kriemler 1*† and Agne Ulyte 1†
                                                1
                                                 Epidemiology, Biostatistics and Prevention Institute, University of Zurich, Zurich, Switzerland, 2 Division of Infectious
                                                Diseases and Hospital Epidemiology, University Children Hospital Zurich, Zurich, Switzerland

                                                Objective: To assess the predictive value of symptoms, sociodemographic
                                                characteristics, and SARS-CoV-2 exposure in household, school, and community
                                                setting for SARS-CoV-2 seropositivity in Swiss schoolchildren at two time points
                                                in 2020.
                              Edited by:
                 Dimitri Van der Linden,
                                                Design: Serological testing of children in primary and secondary schools (aged 6–13
                 Cliniques Universitaires       and 12–16 years, respectively) took place in June–July (T1) and October–November
                      Saint-Luc, Belgium
                                                (T2) 2020, as part of the longitudinal, school-based study Ciao Corona in the canton of
                        Reviewed by:
                                                Zurich, Switzerland. Information on sociodemographic characteristics and clinical history
                    Danilo Buonsenso,
      Catholic University of the Sacred         was collected with questionnaires to parents; information on school-level SARS-CoV-
                             Heart, Italy       2 infections was collected with questionnaires to school principals. Community-level
                       Joanna Merckx,
             McGill University, Canada
                                                cumulative incidence was obtained from official statistics. We used logistic regression to
                    Laura Cornelissen,          identify individual predictors of seropositivity and assessed the predictive performance of
                   Sciensano, Belgium
                                                symptom- and exposure-based prediction models.
                     *Correspondence:
                           Susi Kriemler        Results: A total of 2,496 children (74 seropositive) at T1 and 2,152 children (109
              susi.kriemlerwiget@uzh.ch         seropositive) at T2 were included. Except for anosmia (odds ratio 15.4, 95% confidence
 † These   authors share last authorship        interval [3.4–70.7]) and headache (2.0 [1.03–3.9]) at T2, none of the individual symptoms
                                                were significantly predictive of seropositivity at either time point. Of all the exposure
                      Specialty section:        variables, a reported SARS-CoV-2 case in the household was the strongest predictor
           This article was submitted to
           Pediatric Infectious Diseases,       for seropositivity at T1 (12.4 [5.8–26.7]) and T2 (10.8 [4.5–25.8]). At both time points,
                 a section of the journal       area under the receiver operating characteristic curve was greater for exposure-based
                   Frontiers in Pediatrics
                                                (T1, 0.69; T2, 0.64) than symptom-based prediction models (T1, 0.59; T2, 0.57).
             Received: 17 May 2021
             Accepted: 20 July 2021             Conclusions: In children, retrospective identification of past SARS-CoV-2 infections
           Published: 16 August 2021            based on symptoms is imprecise. SARS-CoV-2 seropositivity is better predicted
                              Citation:         by factors of SARS-CoV-2 exposure, especially reported SARS-CoV-2 cases in the
           Blankenberger J, Haile SR,
      Puhan MA, Berger C, Radtke T,
                                                household. Predicting SARS-CoV-2 seropositivity in children in general is challenging,
        Kriemler S and Ulyte A (2021)           as few reliable predictors could be identified. For an accurate retrospective identification
      Prediction of Past SARS-CoV-2
                                                of SARS-CoV-2 infections in children, serological tests are likely indispensable.
     Infections: A Prospective Cohort
  Study Among Swiss Schoolchildren.             Trial registration number: NCT04448717.
             Front. Pediatr. 9:710785.
     doi: 10.3389/fped.2021.710785              Keywords: SARS-CoV-2, serology, predictors, COVID-19, symptoms, exposure

Frontiers in Pediatrics | www.frontiersin.org                                            1                                              August 2021 | Volume 9 | Article 710785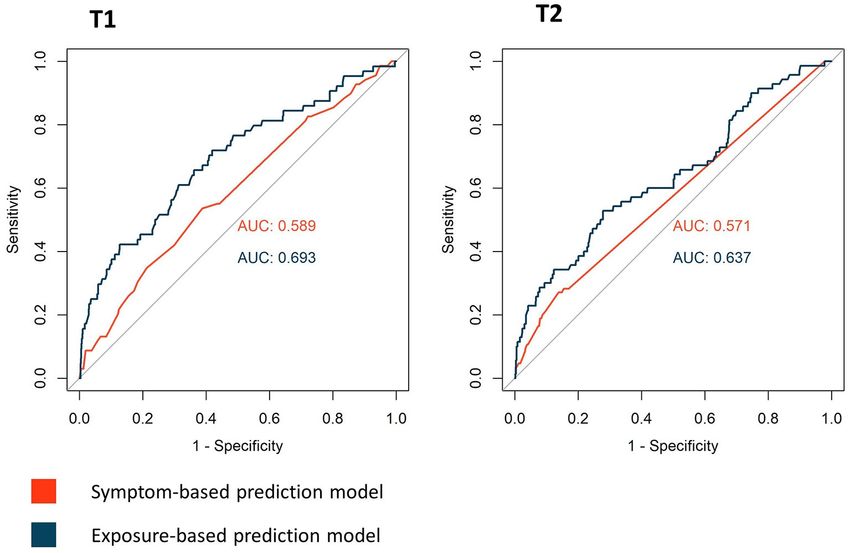
Blankenberger et al.                                                                                  Predictors for Pediatric SARS-CoV-2 Infections

INTRODUCTION                                                              2020. In-person teaching in schools was interrupted only from
                                                                          March 16 until May 10, 2020, along with other containment
Clinical manifestation of severe acute respiratory syndrome               measures that were gradually lifted at the end of April 2020
coronavirus type 2 (SARS-CoV-2) infections in children is milder          and progressively reinstated as the number of cases increased in
and less specific than in adults (1–4). Therefore, identifying            October 2020. A timeline of SARS-CoV-2 incidence and school
children with a SARS-CoV-2 infection is challenging, and many             operation is given in Figure 1. In-person teaching in schools was
acute infections remain unnoticed (5).                                    interrupted only from March 16 until May 10, 2020. Schools
    Serological testing is useful to identify past SARS-CoV-              were reopened for June–July 2020 and, afterwards, after summer
2 infections. Its importance to understand the clinical and               holiday in August 2020 with implemented preventive measures
epidemiological characteristics of the full spectrum of SARS-             (e.g., distancing rules in classrooms and teachers’ rooms, no
CoV-2 in children has already been addressed (6). Predictors              mixing of classes, reduction of large group activities, and school-
for SARS-CoV-2 seropositivity could be valuable indicators                specific contact tracing system). The measures varied, but all
for identifying past infections in children without the need              schools required children to stay at home if they were ill
of serological testing. As such, they could facilitate diagnosis          unless their symptoms were very mild (such as a runny nose
of pediatric multisystem inflammatory syndrome temporally                 or mild cough). As the number of community SARS-CoV-2
associated with SARS-CoV-2 (PIMS-TS), a disease typically                 cases increased in October 2020, adults in schools were required
occurring 3–4 weeks after a SARS-CoV-2 infection (7), or long-            to wear masks from October 19 and secondary schoolchildren
COVID (8).                                                                (older than 12 years) from November 2, 2020.
    In contrast to those in adults (9–12), associations of SARS-
CoV-2 seropositivity with history of symptoms in children are             Study Design and Participants
less clear (9, 11, 13). Retrospectively assessed symptoms might be        Prior to the first round of testing, we randomly selected primary
less reliable to predict past SARS-CoV-2 infections in children.          schools within the canton of Zurich, stratified by region, as well
Evidence on non-clinical factors (e.g., SARS-CoV-2 cases in the           as the closest geographically matched secondary school, and we
environment and sociodemographic characteristics) associated              invited them to participate in the study. To represent the full
with seropositivity in children is scarce (9, 11, 13) or restricted       range of the Swiss education system, both public and private
to specific settings (14, 15). In addition, many of these serology        (about 10%) schools were eligible. After the initial invitation
studies were conducted at an early stage of the pandemic and              round, overall school participation was assessed, and additional
therefore represent only the situation at a specific time.                schools were randomly selected within the required regions.
    As part of the longitudinal, school-based, prospective cohort         From a total of 156 invited schools, 55 agreed to participate, of
study Ciao Corona, approximately 2,500 schoolchildren of                  which two were private schools. Selection of classes was stratified
primary and secondary schools (aged 6–16 years) in the canton of          by school level (lower, middle, and upper) and limited to grades
Zurich, Switzerland, have been tested for SARS-CoV-2 antibodies           1–2 (typically attended by 6- to 8-year-old children) in the lower
in June–July and October–November 2020. We aimed to assess                school level, grades 4–5 (typically attended by 9- to 11-year-old
the predictive value of both clinical and non-clinical variables on       children) in the middle school level, and grades 7–8 in the upper
SARS-CoV-2 seropositivity in schoolchildren at the two different          school level (typically attended by 12- to 14-year-old children).
time points, representing different epidemiological situations            All children of the randomly selected classes were eligible.
in the course of the SARS-CoV-2 pandemic in Switzerland.
In particular, we (1) assessed and compared the individual                Serological Tests
predictive value of reported symptoms, and factors of SARS-               The outcome measure was the binary (positive/negative) SARS-
CoV-2 exposure (sociodemographic characteristics, household               CoV-2 antibody test result. Venous blood was collected from
living conditions, and reported SARS-CoV-2 cases in household,            the children at schools at two time points: between June 16
school, and community) and (2) compared a symptom-based                   and July 9, 2020 (T1), and between October 26 and November
vs. exposure-based prediction approach to predict SARS-CoV-               19, 2020 (T2). Samples were analyzed using ABCORA 2.0
2 seropositivity.                                                         test (sensitivity 94.3%, specificity 99.0%), a Luminex-based
                                                                          binding assay developed by the Institute of Medical Virology,
MATERIALS AND METHODS                                                     University of Zurich, measuring the binding of IgG, IgA, and
                                                                          IgM plasma antibodies against subunits of the SARS-CoV-2
The detailed protocol of the Ciao Corona study is reported                S-Protein (S1, S2, and RBD) and nucleoprotein, yielding 12
elsewhere (16). Ciao Corona is part of Corona Immunitas, a                different measurements. Samples were defined as seropositive for
nationally coordinated research network in Switzerland (17).              SARS-CoV-2 if at least two of the 12 parameters were above the
The canton of Zurich, where the study is conducted, has a                 cutoff value. Test performance was verified on separate validation
linguistically and ethnically diverse population of 1.5 million,          cohorts of pre-pandemic healthy adults, pre-pandemic children,
living in both rural and urban areas. The first SARS-CoV-2                and individuals with documented SARS-CoV-2 infection (18,
epidemic wave peaked at the end of March and was followed by              19).
a period of low daily incidence in May–June 2020. Thereafter,                Figure 2 shows a flowchart of the study participants.
infection numbers have steadily increased, resulting in steep             Serological results were available for 2,496 children at T1 (2,484
growth of new infections starting at the beginning of October             children tested in June–July and additional 12 children in

Frontiers in Pediatrics | www.frontiersin.org                         2                                     August 2021 | Volume 9 | Article 710785
Blankenberger et al. Predictors for Pediatric SARS-CoV-2 Infections
FIGURE 1 | Daily incidence of SARS-CoV-2 cases in the canton of Zurich, Switzerland, and school operation between January and December 2020. T1, June 16 to
July 9, 2020; T2, October 26 to November 19, 2020.
August–September 2020). Of these, 2,153 children seronegative Logistic regression was used to assess the predictive effect
at T1 were also tested in October–November 2020 and included for seropositivity of a selected subset of variables. The selection
in the T2 analysis. of symptom variables was based on most typical SARS-CoV-
2 related symptoms in children reported in literature (4, 9,
Questionnaires and Other Data Sources 13). Exposure variables were chosen to represent potential
Information on sociodemographic characteristics, household exposure to SARS-CoV-2 due to RT-PCR-confirmed cases
size, SARS-CoV-2-compatible symptoms, and SARS-CoV-2 in the household, school, and community; household size
infections confirmed by reverse transcriptase polymerase chain (21); socioeconomic status (22) (approximated by education
reaction (RT-PCR) of participants and their household members of parents); and behavior and contact patterns depending
was collected in baseline and follow-up questionnaires. Parents on the child’s age (23). Included variables are listed in
were asked to fill in baseline questionnaires in parallel to Figure 3. Apart from age (in years) and rate of SARS-
T1, covering SARS-CoV-2-compatible symptoms and RT-PCR- CoV-2 cases in the community (cumulative incidence of
confirmed infections since January 2020 (complete for 1,904, RT-PCR-confirmed SARS-CoV-2 cases per 1,000 inhabitants),
partially complete for 325 participants). Data on symptoms and included variables were binary. Analysis was performed for
positive SARS-CoV-2 tests following T1 were obtained from serology results at T1 (representing January–June/July 2020) and
follow-up questionnaires in September–October 2020 (complete T2 (representing August–October 2020) separately, to assess
for 1,688, partially complete for 17 participants) and if available possible differences in the variable’s predictive value depending
in January 2021 (complete for 1,413, partially complete 18 on the epidemiological situation.
participants). Symptoms and positive SARS-CoV-2 tests reported Association of each individual variable with SARS-CoV-2
to have occurred at least 2 weeks prior to antibody testing at T2 seropositivity was assessed using univariate logistic regression.
were included, allowing time for potential seroconversion (20). To assess and compare total predictive value per category
Information on RT-PCR-confirmed SARS-CoV-2 cases in (total predictive value of all symptom variables vs. all exposure
schools was reported by school principals at the start of each variables) for each T1 and T2, two separate multivariable
round of testing (all 55 schools at T1 and 53 schools at T2). logistic regression models were built. In both univariate and
Cumulative incidence of RT-PCR-confirmed cases of all age multivariable analyses, only cases with complete data on the
groups 14 days before the testing dates was obtained on the postal respective variables were analyzed (symptom- and exposure-
code level of children’s home address from the health directorate based models at T1 2,223 and 2,117 cases, and symptom- and
of the canton of Zurich. exposure-based models at T2 1,768 and 1,593 cases, respectively).
Overall predictive performance of the models was assessed using
Statistical Analysis the Brier score, a proper score assessing the difference of the
Categorical variables are presented as count and percentage, and predicted probability with the actual binary outcome (Brier score
continuous variables as mean with standard deviation, stratified = mean (observed – predicted)2 ) (24). Discrimination, the ability
by seropositivity. of the prediction model to distinguish between cases with and
Frontiers in Pediatrics | www.frontiersin.org 3 August 2021 | Volume 9 | Article 710785Blankenberger et al. Predictors for Pediatric SARS-CoV-2 Infections FIGURE 2 | Flowchart of study participants. T1, June 16 to July 9, 2020; T2, October 26 to November 19, 2020. a Some classes were split or rearranged into multiple classes after summer break. b Eighteen of these children were enrolled from late August to early September 2020 (12 serology results, 18 questionnaires). without the outcome, was assessed using area under the receiver a SARS-CoV-2 infection in adults (9, 12) (75% of household operating characteristic (ROC) curve (AUC) (24). members reporting symptoms were older than 18 years). To assess the models’ practical usefulness for identifying children with past SARS-CoV-2 infections, we also calculated RESULTS positive predictive value (PPV) and negative predictive value (NPV) for all categorical variables with statistically significant Of the 2,496 participants tested for SARS-CoV-2 antibodies association in univariate analyses. Furthermore, we used the at T1, 74 (3.0%) were seropositive. Of the 2,153 seronegative highest Youden’s J to determine optimal thresholds for the children at T1 with an available test result at T2, 109 (5.1%) were multivariable models (25), and we calculated the PPV and NPV seropositive. The detailed seroprevalence results of both testing for SARS-CoV-2 seropositivity based on these thresholds. rounds are reported elsewhere (5, 26). Specific SARS-CoV-2-compatible symptoms in household Reported symptoms, sociodemographic characteristics, and members were assessed for T1 only. These variables were presence of factors of SARS-CoV-2 exposure in household, analyzed in univariate analysis and not included in the school, and community are shown in Table 1. Six of 55 schools multivariable models, to ensure the model’s comparability reported at least one RT-PCR-confirmed case among their pupils between T1 and T2. Of the reported symptoms in household or school personnel (one to six cases per school) between January members, we selected fever, cough, anosmia, fatigue, and myalgia and June–July and 21/53 schools from August to October (one to be assessed for their association with seropositivity in children to seven cases per school). Children resided in 101 different at T1, as these symptoms are most typically associated with post-code areas (1–112 children per post-code area) for which Frontiers in Pediatrics | www.frontiersin.org 4 August 2021 | Volume 9 | Article 710785
Blankenberger et al.                                                                                                    Predictors for Pediatric SARS-CoV-2 Infections

 FIGURE 3 | Univariate and multivariable logistic regression analyses of symptom and exposure variables at T1 and T2. a Any of the following symptoms: fever, cough,
 runny nose, sneezing, sore throat, shortness of breath, headache, myalgia, fatigue, loss of appetite, nausea, emesis, diarrhea, upset stomach, and anosmia. b Any of
 the following symptoms: loss of appetite, nausea, emesis, diarrhea, and upset stomach.

cumulative incidence per 1,000 inhabitants was 0.0–6.1 at T1 and                      Multivariable Prediction Models
0.0–24.6 at T2.                                                                       Coefficients of variables of the symptom- and exposure-based
                                                                                      prediction models are displayed in Table 3.
Univariate Prediction Analysis                                                            The Brier score was slightly lower for the exposure-based
                                                                                      compared model with the symptom-based prediction model at
Results of the univariate analysis of symptoms and exposure
                                                                                      both T1 (symptom-based model: 0.030, exposure-based model:
variables at T1 and T2 are shown in Table 2.
                                                                                      0.028) and T2 (symptom-based model: 0.045, exposure-based
    Analysis of symptoms showed no statistically significant
                                                                                      model 0.041), indicating a better overall prediction performance
predictive effect for any of the variables at T1. Of three variables
                                                                                      of the exposure-based model.
at T2 for which a statistically significant predictive effect was
                                                                                          Discriminative abilities of the models are illustrated with ROC
observed, odds ratios (ORs) were the highest for anosmia,
                                                                                      curves in Figure 4; optimal thresholds and resulting PPV and
followed by headache, and the presence of any SARS-CoV-2-
                                                                                      NPV are in Table 4. Exposure-based predictions showed superior
compatible symptoms (fever, cough, rhinorrhea, sore throat,
                                                                                      discriminative ability than the symptom-based models, with an
shortness of breath, headache, myalgia, fatigue, loss of appetite,
                                                                                      AUC of 0.59 [95% confidence interval (CI) 0.52–0.66] for the
nausea, emesis, diarrhea, upset stomach, and anosmia). At T2,
                                                                                      symptom-based model and 0.69 (95% CI 0.62–0.76) for the
PPVs for anosmia, presence of any symptoms, and headache were
                                                                                      exposure-based model at T1; and 0.57 (95% CI 0.52–0.62) for
42.9, 7.0, and 8.6%, respectively; and NPVs were 95.3, 95.7, and
                                                                                      the symptom-based model and 0.64 (95% CI 0.56–0.70) for the
95.5%, respectively. Given the seroprevalence of 5.1% at T2 in our
                                                                                      exposure-based model at T2.
cohort, neither of these variables adds significant information to
exclude past SARS-CoV-2 infections.
    Among exposure variables, an RT-PCR-confirmed SARS-
                                                                                      Predictions Based on Symptoms in
CoV-2 case of a household member had the time strongest                               Household
predictive effect on seropositivity in both T1 and T2. At T1, a                       In univariate analysis of symptoms of household members,
weaker but statistically significant predictive effect was further                    the predictive effect on the child’s seropositivity at T1 was
observed for SARS-CoV-2-compatible symptoms in household                              statistically significant for all assessed symptoms except cough.
members, followed by reported SARS-CoV-2 cases at school and                          The predictive effect was the highest for anosmia (OR 8.6, 95% CI
age (lower odds of SARS-CoV-2 seropositivity with older age).                         4.7–15.5), followed by myalgia (OR 2.7, 95% CI 1.7–4.4), fatigue
RT-PCR-confirmed SARS-CoV-2 cases in household members                                (OR 1.9, 95% CI 1.2–3.2), and fever (OR 1.8, 95% CI 1.1–2.9).
showed also a comparatively high PPV in both T1 (21.6%) and T2
(30.8%), in contrast to symptoms in household members (PPV:                           DISCUSSION
3.6%) and reported SARS-CoV-2 cases at school (PPV: 5.7%)
at T1. SARS-CoV-2 infections at T1 were most reliably ruled                           In this population-based study, we described the predictive effect
out when household members were asymptomatic (NPV: 98.6%),                            of individual symptoms and factors of SARS-CoV-2 exposure
followed by the absence of SARS-CoV-2 cases in school (NPV:                           for SARS-CoV-2 seropositivity in schoolchildren. We identified
97.3%) and SARS-CoV-2 cases at home (NPV: 97.3%).                                     RT-PCR-confirmed infections of household members to be

Frontiers in Pediatrics | www.frontiersin.org                                     5                                            August 2021 | Volume 9 | Article 710785
Blankenberger et al. Predictors for Pediatric SARS-CoV-2 Infections
TABLE 1 | Demographics, symptoms, and exposure information in seronegative and seropositive children.
T1 T2
Variable Complete Seronegative Seropositive Complete Seronegative Seropositive
SARS-CoV-2 serology 2,496 2,422 (97) 74 (3.0) 2,153 2,044 (95) 109 (5.1)
Demographic characteristics
Agea 2,496 12.0 (±2.5) 10.1 (±2.5) 2,153 11.3 (±2.5) 11.4 (±2.3)
Female sex 2,496 1,246 (51) 34 (46) 2,153 1,057 (52) 55 (51)
RT-PCR diagnosis and reported symptoms in child
Positive PCR test 2,223 0 (0.0) 1 (1.4) 1,768 0 (0.0) 2 (1.8)
Any symptomsb 2,223 1569 (73) 51 (74) 1,768 311 (19) 20 (24)
Fever 2,223 558 (26) 22 (32) 1,768 80 (4.8) 6 (7.1)
Cough 2,223 805 (37) 27 (39) 1,768 130 (7.7) 8 (9.4)
Runny nose/sneezing 2,223 963 (45) 35 (51) 1,768 225 (13) 9 (11)
Sore throat 2,223 737 (34) 21 (30) 1,768 163 (9.7) 9 (11)
Shortness of breath 2,223 63 (2.9) 1 (1.4) 1,768 8 (0.5) 0 (0.0)
Headache 2,223 821 (38) 23 (33) 1,768 113 (6.7) 7 (8.2)
Myalgia 2,223 292 (14) 7 (10) 1,768 26 (1.5) 2 (2.4)
Fatigue 2,223 493 (23) 19 (28) 1,768 80 (4.8) 4 (4.7)
Gastrointestinal symptomsc 2,223 541 (25) 13 (19) 1,768 83 (4.9) 5 (5.9)
Anosmia 2,223 33 (1.5) 0 (0.0) 1,768 4 (0.2) 3 (3.5)
Socioeconomic characteristics of the household of child
Either parent with high education 2,124 1,469 (71) 46 (72) 1,859 1,323 (74) 58 (67)
Either parent Swiss 1,961 1,737 (92) 57 (91) 1,710 1,507 (74) 70 (65)
Household size >3 persons 2,227 1,811 (84) 53 (77) 1,942 1,389 (84) 70 (85)
RT-PCR diagnosis and reported symptoms in household members*
RT-PCR-confirmed SARS-CoV-2 case in household 2,227 29 (1.3) 10 (15) 1,772 21 (1.2) 10 (12)
SARS-CoV-2 symptom in household 2,227 1,596 (74) 61 (88) 1,766 328 (20) 16 (21)
Fever 2,227 702 (33) 32 (46)
Cough 2,227 979 (45) 34 (49)
Runny nose/sneezing 2,227 993 (46) 32 (46)
Sore throat 2,227 987 (46) 38 (55)
Shortness of breath 2,227 150 (7.0) 15 (22)
Headache 2,227 949 (44) 39 (57)
Myalgia 2,227 433 (20) 28 (41)
Fatigue 2,227 664 (31) 32 (46)
Gastrointestinal symptoms 2,227 568 (26) 27 (39)
Anosmia 2,227 79 (3.7) 17 (25)
SARS-CoV-2 in schoolBlankenberger et al. Predictors for Pediatric SARS-CoV-2 Infections
TABLE 2 | Univariate analysis of symptom and exposure variables assessing the TABLE 3 | Multivariable logistic regression models assessing the predictive effect
predictive effect on SARS-CoV-2 seropositivity. of symptoms and of exposure variables on SARS-CoV-2 seropositivity.
T1 T2 T1 T2
Variable Odds ratio (95% CI) Odds ratio (95% CI) Variable Odds ratio (95% CI) Odds ratio (95% CI)
Symptom variables Symptom-based prediction model
Any symptoma 1.06 (0.61–1.8) 1.7 (1.03–2.7) (Intercept) 0.03 (0.02–0.05) 0.04 (0.03–0.06)
Fever 1.3 (0.80–2.2) 1.8 (0.79–4.0) Any symptoma 1.1 (0.55–2.2) 1.4 (0.67–3.1)
Cough 1.08 (0.66–1.8) 1.7 (0.88–3.3) Fever 1.5 (0.82–2.8) 1.03 (0.37–2.9)
Headache 0.81 (0.49–1.3) 2.0 (1.03–3.9) Cough 0.98 (0.54–1.8) 1.1 (0.47–2.6)
Fatigue 1.3 (0.75–2.2) 1.4 (0.61–3.4) Headache 0.71 (0.39–1.3) 1.5 (0.59–3.9)
Anosmia –d 15.4 (3.4–70.7) Fatigue 1.6 (0.84–2.9) 0.69 (0.23–2.1)
Gastrointestinal 0.69 (0.38–1.3) 1.4 (0.58–3.2) Anosmia –c 12.2 (2.3–64.0)
symptomsb Gastrointestinal 0.6 (0.3–1.2) 0.69 (0.24–2.0)
Exposure variables symptomsb
Age 0.87 (0.79–0.96) 1.01 (0.92–1.2) Exposure-based prediction model
RT-PCR-confirmed 12.4 (5.8–26.7) 10.8 (4.5–25.8) (Intercept) 0.11 (0.02–0.62) 0.04 (0.01–0.17)
SARS-CoV-2 case in Age 0.87 (0.78–0.96) 1.01 (0.91–1.1)
household
RT-PCR-confirmed 8.0 (3.4–19.0) 10.1 (4.2–24.6)
SARS-CoV-2 2.7 (1.3–5.6) 1.04 (0.58–1.9) SARS-CoV-2 case in
symptom in household
household
SARS-CoV-2 2.5 (1.1–5.5) 0.97 (0.53–1.7)
Either parent with 1.03 (0.59–1.8) 0.69 (0.41–1.2) symptom in
high education household
Household size of 0.63 (0.35–1.1) 1.5 (0.70–3.1) Either parent with 0.80 (0.45–1.4) 0.62 (0.36–1.06)
>3 persons high education
SARS-CoV-2 case 1.9 (1.08–3.6) 0.58 (0.34–1.00) Household size of 0.52 (0.29–0.95) 1.4 (0.66–3.0)
at school >3 persons
SARS-CoV-2 1.2 (0.98–1.5) 1.02 (0.97–1.06) SARS-CoV-2 case 2.6 (1.3–5.3) 0.59 (0.34–1.02)
incidence at at school
communityc
SARS-CoV-2 0.97 (0.74–1.3) 1.02 (0.98–1.07)
Data are presented as odds ratios with 95% confidence interval (CI). incidence at
T1, January–June/July 2020; T2, August–October/November 2020. communityd
Estimates in bold are statistically significant (p < 0.05).
a Any of the following symptoms: fever, cough, runny nose, sneezing, sore throat, Data are presented as odds ratio with 95% confidence interval (CI).
Estimates in bold are statistically significant (p < 0.05).
shortness of breath, headache, myalgia, fatigue, loss of appetite, nausea, emesis, a Any of the following symptoms: fever, cough, runny nose, sneezing, sore throat,
diarrhea, upset stomach, and anosmia.
b Any of the following symptoms: loss of appetite, nausea, emesis, diarrhea, and shortness of breath, headache, myalgia, fatigue, loss of appetite, nausea, emesis,
diarrhea, upset stomach, and anosmia.
upset stomach. b Any of the following symptoms: loss of appetite, nausea, emesis, diarrhea, and
c Cumulative incidence of SARS-CoV-2 cases on community level per 1,000 inhabitants.
d Estimate is 0.00000072 (95% CI 0–infinity), as no cases of anosmia were reported among upset stomach.
c Estimate is 0.00000066 (95% CI 0–infinity), as no cases of anosmia were reported among
seropositive children at T1.
seropositive children at T1.
d Cumulative incidence of SARS-CoV-2 cases on community level per 1,000 inhabitants.
and T2 analyses; and in line with observations by Tönshoff
et al. (11), none of the assessed symptoms were significantly
associated with SARS-Co-2 seropositivity in children at T1. T2 identification of past infections over a period of several months
results (see Table 2: any symptom, anosmia, and headache) and (i.e., at T1 and T2 symptoms were assessed over 6–7 and 3–
other studies (9, 13) show that, in some contexts, significant 4 months, respectively), symptom-based prediction approaches
associations of some symptoms with seropositivity can be appear too unreliable.
identified. However, based on PPV, with the exception of The predictive performance of the exposure-based models
anosmia, presence of any or any specific symptoms was an was generally better than that of the symptom-based models.
unreliable indicator of a past SARS-CoV-2 infection in our In line with other studies (27, 28), our results indicate that
cohort. The longer the time periods for symptom recall, the information on SARS-CoV-2 situation in the household
less precise they can be expected to be for the identification can be valuable for identifying SARS-CoV-2 infections
of past SARS-CoV-2 infections, as the likelihood of children in children. In particular, RT-PCR-confirmed SARS-CoV-
experiencing symptoms not related to SARS-CoV-2 increases. 2 cases in household members proved to be consistent
Discriminative ability of the symptom-based models was low, predictors for seropositivity in children, with similar effect
and even with the optimal threshold for classification, a sizes in T1 and T2, and also in comparison with other
substantial number of cases would be misclassified. For an studies (13, 29). In contrast to the child’s symptoms,
Frontiers in Pediatrics | www.frontiersin.org 7 August 2021 | Volume 9 | Article 710785Blankenberger et al. Predictors for Pediatric SARS-CoV-2 Infections
FIGURE 4 | Receiver operating characteristics (ROC) curves for the symptom- and exposure-based prediction models for T1 and T2.
TABLE 4 | Positive and negative predictive values of the symptom- and observations from T2 (when schools were open and 21/53 (38%)
exposure-based prediction models based on optimal threshold determined by the schools reported at least one RT-PCR-confirmed SARS-CoV-2
highest Youden’s J.
case) suggest that this variable is likely of little relevance for
Model Thresholda PPV (%) NPV (%) reliable predictions of SARS-CoV-2 seropositivity. We further
found no significant association of SARS-CoV-2 seropositivity
T1 and SARS-CoV-2 cases at the community level, although
Symptom-based prediction model ≥0.0319 4.2% 97.6% average cumulative incidence on community level was higher in
Exposure-based prediction model ≥0.0257 5.1% 98.5% seropositive compared with seronegative children at both T1 and
T2 T2. Similar effects were observed for socioeconomic status, which
Symptom-based prediction model ≥0.0553 9.1% 95.9% was not significantly associated with seropositivity at both time
Exposure-based prediction model ≥0.0431 8.0% 97.1% points. While likely being of too little relevance for prediction,
some socioeconomic gradients (see Table 1: foreign origin and
T1, January–June/July 2020; T2, August–October/November 2020; PPV, positive
predictive value; NPV, negative predictive value. education of parents at T2) in distribution of SARS-CoV-2
a Threshold for the predicted probability of SARS-CoV-2 seropositivity. cases as also documented elsewhere (31) in children cannot be
ruled out.
In general, predicting SARS-CoV-2 seropositivity in children
most individual symptoms in household members were is challenging, which is reflected by the lack of reliable
significantly associated with the child’s seropositivity, individual predictors and low accuracy of the multivariable
underlining the importance of collecting this information models developed in this study. Accurate serological tests will
if SARS-CoV-2 infections in household members are not remain indispensable for an accurate retrospective identification
laboratory confirmed. of SARS-CoV-2 infections in children. The predictive value
A few other observations regarding our assessment of of both symptoms and exposure variables can change over
exposure variables as predictors for SARS-CoV-2 seropositivity time. Specificity of symptoms for prediction of SARS-CoV-2
are worth mentioning. Attending a school, with at least one seropositivity depends on the prevalence of symptoms unrelated
reported SARS-CoV-2 case, was significantly associated with to SARS-CoV-2, which can change seasonally (e.g., flu season
seropositivity at T1, but not at T2. The extent of school- in winter and allergy season in spring). The predictive effect of
related SARS-CoV-2 transmission is not yet fully understood; the exposure variables on the other hand is likely dependent
however, current evidence suggests that in-person teaching does on the epidemiological situation and implemented protective
not play a particularly strong role in amplifying transmission measures. For instance, as lockdown measures in Switzerland
(5, 30). While some causal effects of SARS-CoV-2 cases at were in place in March–April 2020, household transmission
school cannot be ruled out, PPV and NPV as well as our might have been more common before T1 compared with
Frontiers in Pediatrics | www.frontiersin.org 8 August 2021 | Volume 9 | Article 710785Blankenberger et al. Predictors for Pediatric SARS-CoV-2 Infections
T2 (32). This could to some extent explain the significant DATA AVAILABILITY STATEMENT
association of seropositivity with household symptoms at T1,
which was absent at T2. Finally, transmission dynamics are The datasets presented in this article are not readily available.
changing in many countries due to progressing vaccination. Raw data supporting the conclusions of this article will
With an increasing number of adults with partial or complete be made available by the authors, on reasonable request.
immunity, SARS-CoV-2 infections in children might be linked Requests to access the datasets should be directed to Thomas
to infections in household members less frequently, and Radtke, thomas.radtke@uzh.ch.
a higher proportion of infections might take other routes
of transmission. ETHICS STATEMENT
This study has some limitations. Due to the low number
of seropositive children in both testing rounds, the power of The study involving human participants was reviewed and
the statistical models is limited and allowed the assessment of approved by Ethics Committee of the Canton of Zurich,
only several predictive variables. Although the antibody test Switzerland (2020-01336). Written informed consent to
used in our study has shown superior performance measures in participate in this study was provided by the participants’
comparison with other SARS-CoV-2 antibody tests (18), some legal guardian.
misclassifications are possible. Misclassification was likely higher
at T1 (PPV of the test 74.5%, NPV 99.8%) compared with T2 AUTHOR CONTRIBUTIONS
(PPV 83.5%, NPV 99.7%), due to lower seroprevalence at T1.
False-negative results could have predominantly affected children SK and MP initiated the project and preliminary design. SK, MP,
with asymptomatic and mild infection, as loss of antibodies can CB, TR, JB, and AU developed the design and methodology.
occur at an early stage of convalescence (33). Furthermore, as SK, AU, TR, and JB recruited study participants, collected,
questionnaires asked for symptoms retrospectively over a time and managed the data. SH and JB developed the statistical
of several months, recall bias is likely. Symptoms of children analysis plan. JB wrote the first draft of the manuscript. All
were retrospectively reported by parents, which could have been authors contributed to the design of the study and interpretation
different to what the children perceived themselves (34) and is of its results, revised, and approved the manuscript for
also dependent on how much attention was given to symptoms intellectual content.
in general. All those factors could increase the noise and alter
effect sizes. FUNDING
CONCLUSION This study was part of Corona Immunitas research network,
coordinated by the Swiss School of Public Health (SSPH+),
In children, the identification of past SARS-CoV-2 infections and funded by fundraising of SSPH+ that includes funds of
based on retrospectively reported symptoms and exposure the Swiss Federal Office of Public Health and private funders
factors is generally imprecise. Factors of SARS-CoV-2 exposure, (ethical guidelines for funding stated by SSPH+ were respected),
especially history of confirmed SARS-CoV-2 infections in the by funds of the Cantons of Switzerland (Vaud, Zurich, and
household, predict seropositivity in children better than the Basel), and by institutional funds of the Universities. Additional
child’s symptoms. Typical SARS-CoV-2 symptoms in adult funding specific to this study was from the Pandemic Fund
household members could to some extent be a predictor of the University of Zurich Foundation. The funder/sponsor
for a child’s SARS-CoV-2 infection if RT-PCR diagnosis did not have any role in the design and conduct of the study;
information is not available. For an accurate retrospective collection, management, analysis, and interpretation of the data;
identification of SARS-CoV-2 infections in children, serological preparation, review, or approval of the manuscript; and decision
tests remain indispensable. to submit the manuscript for publication.
REFERENCES in children and adolescents. Archiv Dis Childhood. (2020) 106:802–7.
doi: 10.1136/archdischild-2020-320972
1. Dong Y, Dong Y, Mo X, Hu Y, Qi X, Jiang F, et al. Epidemiology 5. Ulyte A, Radtke T, Abela IA, Haile SR, Berger C, Huber M, et al. Clustering and
of COVID-19 among children in China. Pediatrics. (2020) longitudinal change in SARS-CoV-2 seroprevalence in school children in the
145:20200702. doi: 10.1542/peds.2020-0702 canton of Zurich, Switzerland: prospective cohort study of 55 schools. BMJ.
2. Castagnoli R, Votto M, Licari A, Brambilla I, Bruno R, Perlini S, et al. (2021) 372:n616. doi: 10.1136/bmj.n616
Severe acute respiratory syndrome coronavirus 2 (SARS-CoV-2) infection 6. Buonsenso D, Zampino G, Valentini P. Novel coronavirus
in children and adolescents: a systematic review. JAMA Pediatrics. (2020) disease 2019 infection in children: the dark side of a worldwide
174:882–9. doi: 10.1001/jamapediatrics.2020.1467 outbreak. Front Pediatr. (2020) 8:215. doi: 10.3389/fped.2020.00
3. Hoang A, Chorath K, Moreira A, Evans M, Burmeister-Morton F, Burmeister 215
F, et al. COVID-19 in 7780 pediatric patients: a systematic review. 7. Ahmed M, Advani S, Moreira A, Zoretic S, Martinez J, Chorath K,
EClinicalMedicine. (2020) 24:100433. doi: 10.1016/j.eclinm.2020.100433 et al. Multisystem inflammatory syndrome in children: a systematic
4. Viner RM, Ward JL, Hudson LD, Ashe M, Patel SV, Hargreaves D, review. EClinicalMedicine. (2020) 26:100527. doi: 10.1016/j.eclinm.2020.100
et al. Systematic review of reviews of symptoms and signs of COVID-19 527
Frontiers in Pediatrics | www.frontiersin.org 9 August 2021 | Volume 9 | Article 710785Blankenberger et al. Predictors for Pediatric SARS-CoV-2 Infections
8. Buonsenso D, Munblit D, de Rose C, Sinatti D, Ricchiuto A, Carfi A, et al. 23. Mossong J, Hens N, Jit M, Beutels P, Auranen K, Mikolajczyk R, et al. Social
Preliminary evidence on long COVID in children. Acta Paediatrica. (2021) contacts and mixing patterns relevant to the spread of infectious diseases.
110:2208–11. doi: 10.1111/apa.15870 PLoS Med. (2008) 5:e74. doi: 10.1371/journal.pmed.0050074
9. Richard A, Wisniak A, Perez-Saez J, Garrison-Desany H, Petrovic D, 24. Steyerberg EW, Vickers AJ, Cook NR, Gerds T, Gonen M, Obuchowski N,
Piumatti G, et al. Seroprevalence of anti-SARS-CoV-2 IgG antibodies, risk et al. Assessing the performance of prediction models. Epidemiology. (2010)
factors for infection and associated symptoms in Geneva, Switzerland: 21:128–38. doi: 10.1097/EDE.0b013e3181c30fb2
a population-based study short title: SARS-CoV-2 seroprevalence and 25. Perkins NJ, Schisterman EF. The inconsistency of “optimal” cutpoints
associated risk factors and symptoms. medRxiv. (2020) 2020.12.16.20248180. obtained using two criteria based on the receiver operating characteristic
doi: 10.1101/2020.12.16.20248180 curve. Am J Epidemiol. (2006) 163:670–5. doi: 10.1093/aje/kwj063
10. Carrat F, de Lamballerie X, Rahib D, Blanché H, Lapidus N, Artaud F, et al. 26. Ulyte A, Radtke T, Abela IA, Haile SH, Blankenberger J, Jung R,
Seroprevalence of SARS-CoV-2 among adults in three regions of France et al. Variation in SARS-CoV-2 seroprevalence across districts, schools
following the lockdown and associated risk factors: a multicohort study. and classes: baseline measurements from a cohort of primary and
medRxiv. (2020) 2020.09.16.20195693. doi: 10.1101/2020.09.16.20195693 secondary school children in Switzerland. BMJ Open. (2021) 11:e047483.
11. Tönshoff B, Müller B, Elling R, Renk H, Meissner P, Hengel H, et al. Prevalence doi: 10.1136/bmjopen-2020-047483
of SARS-CoV-2 infection in children and their parents in Southwest Germany. 27. Soriano-Arandes A, Gatell A, Serrano P, Biosca M, Campillo F, Capdevila
JAMA Pediatr. (2021) 175:586–93. doi: 10.1001/jamapediatrics.2021.0001 R, et al. Household SARS-CoV-2 transmission and children: a network
12. Lehmann J, Giesinger JM, Rumpold G, Borena W, Knabl L, Falkensammer prospective study. Clin Infect Dis. (2021) ciab228. doi: 10.1093/cid/ciab228
B, et al. Estimating seroprevalence of SARS-CoV-2 antibodies 28. Buonsenso D, Valentini P, de Rose C, Pata D, Sinatti D, Speziale D,
using three self-reported symptoms: development of a prediction et al. Seroprevalence of anti-SARS-CoV-2 IgG antibodies in children with
model based on data from Ischgl, Austria. Epidemiol Infect. (2021) household exposure to adults with COVID-19: Preliminary findings. Pediatr
149:e52. doi: 10.1017/S0950268821000418 Pulmonol. (2021) 56:1374–7. doi: 10.1002/ppul.25280
13. Waterfield T, Watson C, Moore R, Ferris K, Tonry C, Watt A, et al. 29. Lachassinne E, de Pontual L, Caseris M, Lorrot M, Guilluy C, Naud
Seroprevalence of SARS-CoV-2 antibodies in children: a prospective A, et al. SARS-CoV-2 transmission among children and staff in daycare
multicentre cohort study. Archiv Dis Childhood. (2020) 106:680–6. centres during a nationwide lockdown in France: a cross-sectional,
doi: 10.1136/archdischild-2020-320558 multicentre, seroprevalence study. Lancet Child Adolesc Health. (2021) 5:256–
14. Brotons P, Launes C, Buetas E, Fumado V, Henares D, de Sevilla MF, 64. doi: 10.1016/S2352-4642(21)00024-9
et al. Susceptibility to Sars-COV-2 infection among children and adults: a 30. Buonsenso D, Roland D, de Rose C, Vásquez-Hoyos P, Ramly B, Chakakala-
seroprevalence study of family households in the barcelona metropolitan Chaziya JN, et al. Schools closures during the COVID-19 pandemic. Pediatr
region, Spain. Clin Infect Dis. (2020) 72:e970–7. doi: 10.1093/cid/ciaa1721 Infect Dis J. (2021) 40:e146–50. doi: 10.1097/INF.0000000000003052
15. Fontanet A, Tondeur L, Grant R, Temmam S, Madec Y, Bigot 31. Willeit P, Krause R, Lamprecht B, Berghold A, Hanson B, Stelzl E, et al.
T, et al. SARS-CoV-2 infection in schools in a northern French Prevalence of RT-qPCR-detected SARS-CoV-2 infection at schools: first
city: a retrospective serological cohort study in an area of high results from the Austrian school-SARS-CoV-2 prospective cohort study.
transmission, France, January to April 2020. Eurosurveillance. (2021) Lancet Region Health Eur. (2021) 5:100086. doi: 10.1016/j.lanepe.2021.100086
26:2001695. doi: 10.2807/1560-7917.ES.2021.26.15.2001695 32. Curmei M, Ilyas A, Evans O, Steinhardt J. Estimating household
16. Ulyte A, Radtke T, Abela IA, Haile SR, Braun J, Jung R, et al. transmission of SARS-CoV-2. medRxi. (2020) 2020.05.23.20111559.
Seroprevalence and immunity of SARS-CoV-2 infection in children and doi: 10.1101/2020.05.23.20111559
adolescents in schools in Switzerland: design for a longitudinal, school- 33. Long QX, Tang XJ, Shi QL, Li Q, Deng HJ, Yuan J, et al. Clinical and
based prospective cohort study. Int J Public Health. (2020) 65:1549– immunological assessment of asymptomatic SARS-CoV-2 infections. Nat
57. doi: 10.1007/s00038-020-01495-z Med. (2020) 26:1200–4. doi: 10.1038/s41591-020-0965-6
17. West EA, Anker D, Amati R, Richard A, Wisniak A, Butty A, et al. 34. Lu Y, Marks T, Lin S, Neamtiu IA, Csobod E, Gurzau E. Agreement
Corona Immunitas: study protocol of a nationwide program of SARS-CoV- between parental and student reports on respiratory symptoms and school
2 seroprevalence and seroepidemiologic studies in Switzerland. Int J Public environment in young romanian children - evidence from the SINPHONIE
Health. (2020) 65:1529–48. doi: 10.1007/s00038-020-01494-0 project. Rev Environ Health. (2019) 34:275–81. doi: 10.1515/reveh-2018-0087
18. Pasin C, Schwarzmüller M, Epp S, Sickmann ME, Schanz MM, Rusert P,
et al. Multifactorial SARS-CoV-2 seroprofiling dissects interdependencies Conflict of Interest: The authors declare that the research was conducted in the
with human coronaviruses and 1 predicts neutralization activity 2 3 Irene A. absence of any commercial or financial relationships that could be construed as a
medRxiv. (2021) 2021.04.21.21255410. doi: 10.1101/2021.04.21.21255410 potential conflict of interest.
19. Institute of Medical Virology IMV SARS-CoV-2 Antikörper
Differenzierung (ABCORA). Available online at: https://www.virology.uzh.ch/ Publisher’s Note: All claims expressed in this article are solely those of the authors
dam/jcr:0f9bbdba-e215-4e42-a877-131a04a2e175/IMVABCORASerologie. and do not necessarily represent those of their affiliated organizations, or those of
pdf (accessed July 29, 2021).
the publisher, the editors and the reviewers. Any product that may be evaluated in
20. Post N, Eddy D, Huntley C, van Schalkwyk MCI, Shrotri M, Leeman D,
this article, or claim that may be made by its manufacturer, is not guaranteed or
et al. Antibody response to SARS-CoV-2 infection in humans: a systematic
review. PLoS ONE. (2020) 15:e0244126. doi: 10.1371/journal.pone.024 endorsed by the publisher.
4126
21. Streeck H, Schulte B, Kümmerer BM, Richter E, Höller T, Fuhrmann C, et al. Copyright © 2021 Blankenberger, Haile, Puhan, Berger, Radtke, Kriemler and Ulyte.
Infection fatality rate of SARS-CoV2 in a super-spreading event in Germany. This is an open-access article distributed under the terms of the Creative Commons
Nat Commun. (2020) 11:5829. doi: 10.1038/s41467-020-19509-y Attribution License (CC BY). The use, distribution or reproduction in other forums
22. Goyal MK, Simpson JN, Boyle MD, Badolato GM, Delaney M, is permitted, provided the original author(s) and the copyright owner(s) are credited
McCarter R, et al. Racial and/or ethnic and socioeconomic disparities and that the original publication in this journal is cited, in accordance with accepted
of SARS-CoV-2 infection among children. Pediatrics. (2020) academic practice. No use, distribution or reproduction is permitted which does not
146:e2020009951. doi: 10.1542/peds.2020-009951 comply with these terms.
Frontiers in Pediatrics | www.frontiersin.org 10 August 2021 | Volume 9 | Article 710785You can also read