Prediction of Sugarcane Yield Based on NDVI and Concentration of Leaf-Tissue Nutrients in Fields Managed with Straw Removal - MDPI
←
→
Page content transcription
If your browser does not render page correctly, please read the page content below
agronomy
Article
Prediction of Sugarcane Yield Based on NDVI and
Concentration of Leaf-Tissue Nutrients in Fields
Managed with Straw Removal
Izaias Pinheiro Lisboa , Júnior Melo Damian * , Maurício Roberto Cherubin ,
Pedro Paulo Silva Barros , Peterson Ricardo Fiorio, Carlos Clemente Cerri and
Carlos Eduardo Pellegrino Cerri
 “Luiz de Queiroz” College of Agriculture, University of São Paulo, 11 Pádua Dias Avenue,
 Piracicaba, SP 13418-900, Brazil; iplisboaa@gmail.com (I.P.L.); cherubin@usp.br (M.R.C.);
 pedropaulo@usp.br (P.P.S.B.); fiorio@usp.br (P.R.F.); cerri@cena.usp.br (C.C.C.); cepcerri@usp.br (C.E.P.C.)
 * Correspondence: damianjrm@usp.br; Tel.: +55-559-996-90524

 Received: 29 July 2018; Accepted: 13 September 2018; Published: 19 September 2018

 Abstract: The total or partial removal of sugarcane (Saccharum spp. L.) straw for bioenergy production
 may deplete soil quality and consequently affect negatively crop yield. Plants with lower yield
 potential may present lower concentration of leaf-tissue nutrients, which in turn changes light
 reflectance of canopy in different wavelengths. Therefore, vegetation indexes, such as the normalized
 difference vegetation index (NDVI) associated with concentration of leaf-tissue nutrients could be a
 useful tool for monitoring potential sugarcane yield changes under straw management. Two sites in
 São Paulo state, Brazil were utilized to evaluate the potential of NDVI for monitoring sugarcane yield
 changes imposed by different straw removal rates. The treatments were established with 0%, 25%,
 50%, and 100% straw removal. The data used for the NDVI calculation was obtained using satellite
 images (CBERS-4) and hyperspectral sensor (FieldSpec Spectroradiometer, Malvern Panalytical,
 Almelo, Netherlands). Besides sugarcane yield, the concentration of the leaf-tissue nutrients (N, P, K,
 Ca, and S) were also determined. The NDVI efficiently predicted sugarcane yield under different
 rates of straw removal, with the highest performance achieved with NDVI derived from satellite
 images than hyperspectral sensor. In addition, leaf-tissue N and P concentrations were also important
 parameters to compose the prediction models of sugarcane yield. A prediction model approach based
 on data of NDVI and leaf-tissue nutrient concentrations may help the Brazilian sugarcane sector to
 monitor crop yield changes in areas intensively managed for bioenergy production.

 Keywords: crop residue management; remote sensing; satellite images; hyperspectral sensor;
 vegetation index; yield monitoring

1. Introduction
      Brazil is the largest sugarcane producer in the world, representing 40% of global production [1].
Sugarcane area extends for approximately 9 million ha, with an ethanol production at around 27 billion
liters and about 40 million tonnes of sugar [2]. Although Brazil is a major player in the global
biofuel market, growing internal and external demands have been stimulated an increase in ethanol
production. Considering the current global production of 98.6 billion liters [3], it will be necessary
to double ethanol production to meet the estimated global demand of 200 billion liters in 2021 [4].
In addition, bioelectricity represents an important proportion of the revenues in the industry, and it
is projected that about 17% of the domestic electric energy production in Brazil will be provided by
sugarcane biomass by 2023 [5].

Agronomy 2018, 8, 196; doi:10.3390/agronomy8090196                              www.mdpi.com/journal/agronomy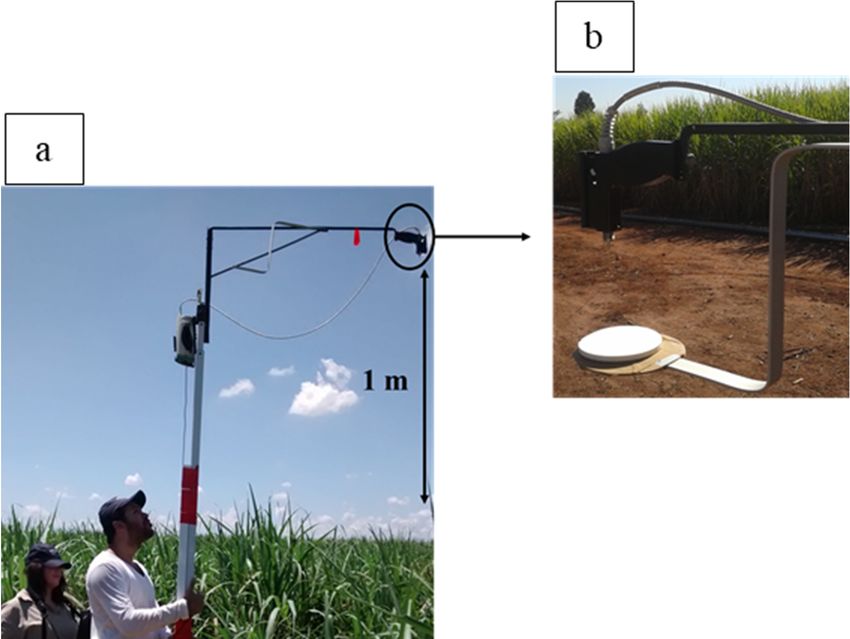
Agronomy 2018, 8, 196 2 of 21
An alternative to increase bioenergy production, without expanding area, is to use lignocellulosic
raw materials, such as bagasse and straw. In this process, crop residues, rich in carbohydrates,
are converted into simple sugars using enzymatic hydrolysis, followed by yeast fermentation to
produce ethanol, or crop residues are burnt to generate bioelectricity [6].
More recently, sugarcane straw has been considered as an alternative raw material to address
the increasing demand for bioenergy production [7]. Since adoption of mechanized harvesting of
sugarcane, about 10 to 20 Mg ha−1 (as dry mass) remains on the field annually [8]. However, integral or
partially straw retention on the soil surface is essential to support several soil functions [9,10], such as
thermal regulation [11], control of soil compaction [12], water retention [13], carbon storage [14],
nutrient cycling [15], biological activities [16], and control of erosion [17]. Consequently, changes in
soil quality can affect, directly or indirectly, crop production [14,18,19]. Therefore, monitoring the
yield of sugarcane could be a strategy to evaluate the effects of varying the amount of straw in the
soil–plant system.
Crop yield can be monitored by vegetation indexes. Indeed, Tucker et al. [20] reported that up to
64% of the grain yield variation was explained by spectral data. The applications of NDVI has been
broadly increased, not only because NDVI can be derived from data of either hyperspectral sensors or
satellite images [21], but also because it is closely correlated with yield of different crops [22], such as
maize (Zea mays L.) [23], soybean (Glycine max L.) [24], and sugarcane [25]. Additionally, deficiency and
excess of nutrients in the leaves can be diagnosed through spectral responses obtained by sensors
and, consequently, by vegetation indexes (e.g., NDVI) [26]). The variation in the concentration of
nutrients in the leaves indicates physiological stress, which can be caused by diverse limiting factors
that occurring in the production environment [27].
Although NDVI has been used for different purposes, as previously stated, in our knowledge,
there are no studies in the literature in which NDVI and concentration of leaf-tissue nutrients under
sugarcane straw removal management were used to develop predictive models for stalk yield. Thus,
the following hypotheses were established: (i) the NDVI and concentration of leaf-tissue nutrients
are efficient parameters to predict sugarcane yield under different straw removal rates; (ii) the NDVI
obtained using data from satellite images or hyperspectral sensors have similar performance for
predicting sugarcane yield; and (iii) the nutritional status of the crop (evaluated by the leaf-tissue
nutrient concentrations) is affected by the different straw removal rates. To test the hypotheses, a study
was conducted in areas managed with straw removal in southeastern Brazil to predict sugarcane yield
based on NDVI and plant nutritional status. In addition, the efficiency of the NDVI data for predicting
sugarcane yield, obtained using remote sensing imagery from various platforms, was compared.
2. Materials and Methods
2.1. Study Sites
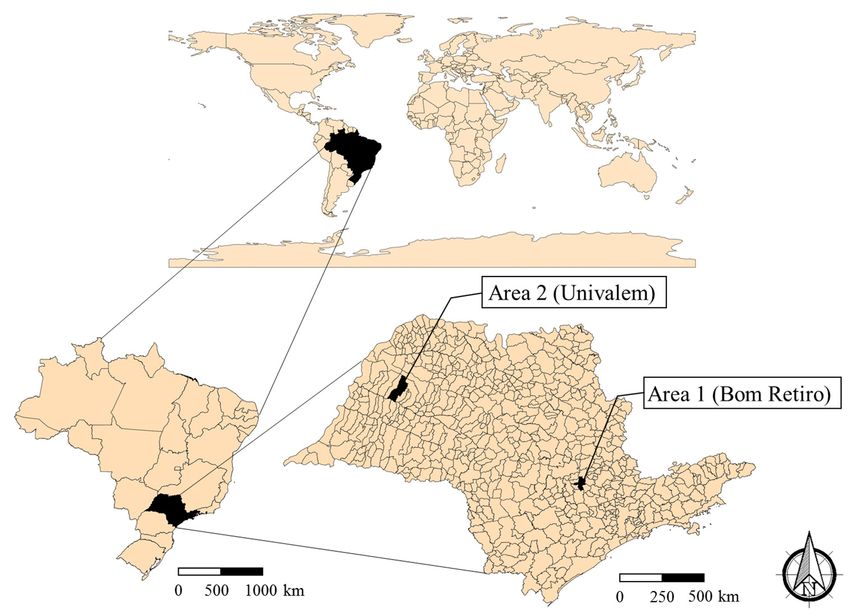
The field study was conducted at two sites in southeastern Brazil, which represents the largest
sugarcane-producing region of the country. These areas are located in São Paulo state, near to Capivari,
at the Bom Retiro mill (Area 1) (Lat. 22◦ 590 4200 S; Long. 47◦ 300 3400 W) and Valparaiso, at the Univalem
mill (Area 2) (Lat. 21◦ 140 48” S; Long. 50◦ 470 04” W) (Figure 1).
Soil is classified as Rhodic Kandiudox [28] with a sandy clay loam texture in Area 1, whereas in
Area 2, the soil is classified as Kanhaplic Haplustults [28] with a sandy loam texture.
The regional climate for the Area 1 is humid subtropical-Cwa type (Köppen classification)
characterized by dry winters and hot summers, with a mean annual temperature of 21.8 ◦ C and annual
precipitation of 1289 mm (Figure 2A). In the Area 2, the climate is tropical-Aw type, characterized
by dry winters, with a mean annual temperature of 23.4 ◦ C and annual precipitation of 1241 mm
(Figure 2B). Rainfall at both sites is concentrated in the spring and summer (October to April), while the
dry season is in the autumn and winter (May to September).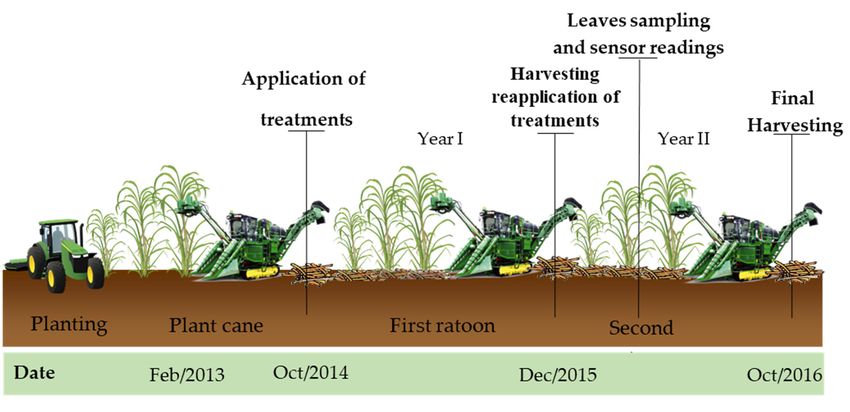
Agronomy 2018, 8, 196 3 of 21
Agronomy2018,
Agronomy 2018,8,8,xxFOR
FORPEER
PEERREVIEW
REVIEW 33of
of21
21
Figure1.1.1.Geographical
Figure
Figure Geographicallocation
Geographical locationof
location ofthe
of the experimental
theexperimental areas
experimentalareas used
areasused
used inin
in the
the study.
study.
the study.
600
600 48
48
AA Precipitation
Precipitation
TT__max
max
500
500 TT__min
min 40
40
TT__med
med
(mm)
Precipitation (mm)
400 32
C)
Temperature ((o C)
400 32 o
Temperature
Precipitation
300
300 24
24
200
200 16
16
100
100 88
00 00
600
600 48
48
B
B
500
500 40
40
(mm)
Precipitation (mm)
400 32
C)
Temperatura ((o C)
400 32
o
Temperatura
Precipitation
300
300 24
24
200
200 16
16
100
100 88
00 00
Nov
Nov Jan
Jan Mar
Mar May
May Jul
Jul Sep
Sep Nov
Nov Jan
Jan
Months
Months
Figure2. 2.2. Mean
Figure
Figure Mean monthly
Mean monthly temperatures
monthly temperatures (maximum,
temperatures (maximum, mean,
(maximum,mean,mean,andand minimum)
andminimum)
minimum) (◦ C)
(°C)
(°C) and
and monthly
monthly
and monthly
precipitation(mm)
precipitation
precipitation (mm)in
(mm) inArea
in Area111(Capivari,
Area (Capivari, SP)
SP)
(Capivari, SP) (A)
(A) and
and
(A) Area
Area
and 22(Valparaiso,
Area (Valparaiso, SP)(B)
SP)
2 (Valparaiso, (B) from
(B)11from
from
SP) December
December 2015
2015
1 December
to 31
to
2015 31 December
December
to 31 December 2016.
2016. Sources:
Sources:
2016. CEPAGRI
CEPAGRI
Sources: [29] and
[29]
CEPAGRI [29]ESALQ
and ESALQ [30]. [30].
[30].
and ESALQ
Agronomy 2018, 8, 196 4 of 21
Agronomy 2018, 8, x FOR PEER REVIEW 4 of 21
2.2.Experimental
2.2. ExperimentalDesign
Design
Withineach
Within each site,
site, sugarcane
sugarcane was
wasplanted
plantedinin
15 15
February 2013,
February using
2013, the varieties
using CTC 14
the varieties and14
CTC RB
867515 in Area 1 and Area 2, respectively. These varieties are broadly cultivated in
and RB 867515 in Area 1 and Area 2, respectively. These varieties are broadly cultivated in thisthis sugarcane-
producing region of region
sugarcane-producing Brazil.of
Before
Brazil.the experiment
Before was installed,
the experiment the areasthe
was installed, were sampled
areas in orderinto
were sampled
obtain a chemical and physical characterization of the soils (Table 1), as previously presented
order to obtain a chemical and physical characterization of the soils (Table 1), as previously presented by
Satiro et al. [12].
by Satiro et al. [12].
Table1.1.Initial
Table Initialcharacterization
characterizationofofthe
thesoils
soilsininthe
theexperimental
experimentalareas.
areas.
Soil Base
Base Al
Al
Soil pH
pH C
C PP K K Ca Ca Mg Mg Clay
Clay
Layer Saturation Saturation
Saturation Saturation
Layer
(cm)
(cm) H
H2O
O gg kg
kg−1 −1 mg
mgdm
−3
dm−3 mmol c dm−3 −3
mmol %%
2 c dm
Area 1 (Bom Retiro)
Area 1 (Bom Retiro)
0–10
0–10 5.2
5.2 11.3
11.3 29.3
29.3 9.3 9.3 26.126.1 7.7 7.7 68.868.8 0.8
0.8 3333
10–20
10–20 4.8
4.8 11.0
11.0 24.9
24.9 5.1 5.1 19.019.0 5.9 5.9 54.754.7 3.5
3.5 3333
20–30
20–30 4.5
4.5 9.4
9.4 22.1
22.1 3.3 3.3 12.512.5 2.95 2.95 36.836.8 4.2
4.2 3434
Area
Area 22(Univalem)
(Univalem)
0–10
0–10 5.2
5.2 6.1
6.1 17.4
17.4 3.3 3.3 9.3 9.3 2.9 2.9 51.151.1 2.4
2.4 1111
10–20 4.8 5.5 14.1 2.6 4.8 1.5 34.8 5.6 11
10–20 4.8 5.5 14.1 2.6 4.8 1.5 34.8 5.6 11
20–30 4.5 4.9 12.7 2.1 3.6 1.0 27.5 7.4 12
20–30 4.5 4.9 12.7 2.1 3.6 1.0 27.5 7.4 12
The
Thecane
caneplant
plant(i.e.,
(i.e.,first
firstcycle)
cycle)waswascultivated
cultivatedfor for2020months,
months,thereafter
thereafterthetheharvested
harvestedwaswas
performed in 15 October 2014 and the experiments with different rates
performed in 15 October 2014 and the experiments with different rates of straw removal were of straw removal were
established.
established. After
After 1414 months,
months, in in 17
17December
December2015,2015,thetheareas
areaswere
wereharvested
harvestedagain
againandandsimilar
similar
experiments were conducted. Leaf sampling and sensor data collection were done
experiments were conducted. Leaf sampling and sensor data collection were done during the second during the second
sugarcane
sugarcaneratoon
ratoonseason
season(Figure
(Figure3).3).The
Theexperiments
experimentswere weremechanically
mechanicallyestablished
establishedwithwithharvester,
harvester,
which
whichwas
wasset setup
upwith
withdifferent
differentangular
angularvelocities
velocitiesononthe
theprimary
primaryextractor
extractorfan
fanwhile
whilethe
thesecondary
secondary
extractor
extractorfan
fanwaswasswitched
switched ononor off to remove
or off different
to remove quantities
different of sugarcane
quantities straw.straw.
of sugarcane DetailsDetails
on howon
extractors were set up are described in Lisboa et al.
how extractors were set up are described in Lisboa et al. [7]. [7].
Figure3.3.Timeline
Figure Timelineofofthe
theexperiments
experimentsestablishment
establishment(at(atharvesting)
harvesting)and
andconduction
conductionover
overtwo
twoyears
yearsinin
southeast of Brazil. Source: adapted from Lisboa et al. [19].
southeast of Brazil. Source: adapted from Lisboa et al. [19].
The
Theexperimental
experimentaldesign
designwas
wasrandomized
randomizedblocks
blockswith
withfour
fourtreatments
treatments(i.e.,
(i.e.,straw
strawremoval
removalrates),
rates),
and four replications (four plots of ~50 × 25 m). Initially, the aim was to remove the
and four replications (four plots of ~50 × 25 m). Initially, the aim was to remove the amount amount of
of straw
proportional to 0%, 25%, 50%, and 100% of the straw yield in each area. However, under field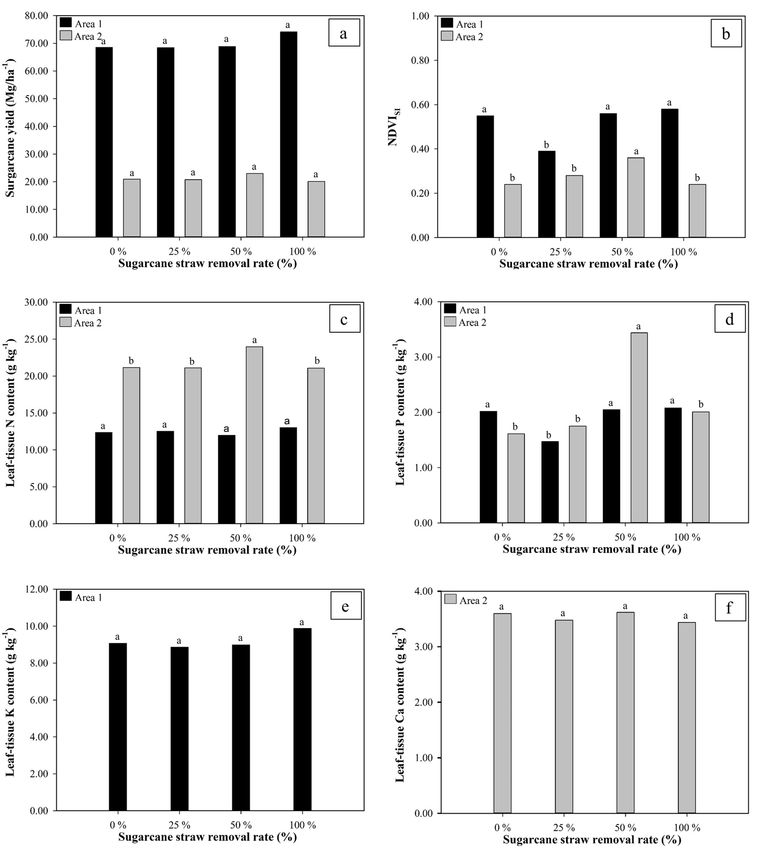
Agronomy 2018, 8, 196                                                                                                      5 of 21

straw proportional to 0%, 25%, 50%, and 100% of the straw yield in each area. However, under field
conditions, the exact proportion was hard to be achieved, but the removal rates were very close to
those proposed (Table 2).

     Table 2. Amount of sugarcane straw left on soil surface after each treatment in the first and second
     years in each experimental area.

                                                    Area 1 (Bom Retiro)                    Area 2 (Univalem)
             Straw Removal Rate (%)
                                                   Year I            Year II             Year I            Year II
                                                     Amount of straw left on the soil surface (Mg ha−1 ) #
                          100                    0.0 ± 0.0       0.0 ± 0.0         0.0 ± 0.0        0.0 ± 0.0
                           50                    8.7 ± 0.9       5.5 ± 1.0        10.2 ± 0.9        6.8 ± 0.4
                           25                    15.1 ± 1.5     10.5 ± 0.1        12.5 ± 0.9       11.6 ± 0.5
                            0                    18.9 ± 1.6     13.6 ± 2.0        16.4 ± 1.4       13.7 ± 1.1
                                       #   Dry mass; Source: adapted from Lisboa et al. [19].

   At the start of each experiment period, the sugarcane straw was sampled to determine its elemental
composition (Table 3).

     Table 3. Carbon (C) and macronutrient (nitrogen—N, phosphorus—P, potassium—K, calcium—Ca,
     magnesium—Mg, sulphur—S) content of the sugarcane straw used in each experiment.

                                           C        N          P          K       Ca       Mg         S       C:N Ratio
                      Sites
                                                                     g   kg−1
                  I
       Area 1 (Bom Retiro)              479        2.58      0.39        1.66    1.96      1.38     0.45          177
       Area 1 II (Bom Retiro)           470        3.10      0.34        0.56    2.44      1.24     0.35          152
        Area 2 I (Univalem)             467        4.02      0.38        2.45    2.44      1.54     0.74          116
       Area 2 II (Univalem)             422        6.04      0.58        1.30    8.55      2.55     0.95           73
         I   and II denote the first and second sugarcane ratoon, respectively. Source: adapted from Lisboa et al. [19].

     Overall, this study frames the development of models based on NDVI and plant nutritional status
to predict sugarcane yield in field managed with straw removal. Plant tillering, growth, and stalk yield
under the same straw management were discussed in detail by Lisboa et al. [19]. Thus, part of the
primary data (i.e., amount of straw, characterization and stalk yield) presented on this study (mainly
in Material and Methods) were originally shown in Lisboa et al. [19].

2.3. Calculation of the NDVI
      The data were obtained in the field using the FieldSpec Spectroradiometer (ASD–Analytical
Spectral Devices Inc., Boulder, CO, USA) hyperspectral sensor. This equipment is classified as
a passive hyperspectral sensor that uses the visible and infrared wavelengths (325 to 1075 nm),
with a spectral resolution of 3 nm and a view angle of 25◦ . Before the canopy reading was initiated,
the spectroradiometer was calibrated using the standard Lambertian plate that accompanies the
apparatus. This calibration was repeated after reading approximately four plots or whenever a change
of light intensity was observed in the field. The NDVI was calculated using Equation (1).

                                                                    (NIR − R)
                                                      NDV I =                                                                  (1)
                                                                    (NIR + R)
where NDVI is the Normalized Difference Vegetation Index (unitless); NIR is the near infrared band
and R is the red band; NIR represents the reflected light at the near infrared band and R represents the
reflected light at the red band.
     The field evaluations with the hyperspectral sensor were carried out on 28 April 2016 and
4 March 2016 for Areas 1 and 2, respectively, four months after harvesting. This period coincides
Agronomy 2018, 8, 196                                                                                      6 of 21

with the recommended
   Agronomy                  period
            2018, 8, x FOR PEER      for foliar diagnosis in sugarcane crop [31]. The evaluations were always
                                 REVIEW                                                                    6 of 21
carried out on sunny days, between 10:00 a.m. and 2:00 p.m., with the sensor positioned 1 m above the
   carried
crop canopyout  onasunny
              and             days,
                       field of viewbetween    10:00 a.m.
                                      of 25◦ , which      and 2:00
                                                      allowed      p.m., with of
                                                              the evaluation  thea sensor
                                                                                   circularpositioned 1 m above
                                                                                            area of approximately
   the 2crop canopy and a field of view of 25°, which allowed the evaluation of a circular area of
0.25 m (Figure 4).
   approximately 0.25 m2 (Figure 4).

         Figure 4. Representation of the hyperspectral sensor in the field (a) and Lambertini plate used for
     Figure 4. Representation of the hyperspectral sensor in the field (a) and Lambertini plate used for
         calibration (b).
     calibration (b).
          The satellite images were obtained from the satellite CBERS-4 (China Brazil Earth Resources
      The satellite images were obtained from the satellite CBERS-4 (China Brazil Earth Resources
    Satellite) on the 17 March 2016 and the 4 May 2016 for Areas 1 and 2, respectively. The images
Satellite) on the 17 March 2016 and the 4 May 2016 for Areas 1 and 2, respectively. The images presented
    presented a spatial resolution of 5 m, radiometric resolution of 8 bits and wavelength of 0.50–0.840
a spatial resolution of 5 m, radiometric resolution of 8 bits and wavelength of 0.50–0.840 µm. As the
    µm. As the panchromatic band of CBERS-4 was supplied in digital numbers without atmospheric
panchromatic band of CBERS-4 was supplied in digital numbers without atmospheric calibration,
    calibration, the images were submitted to atmospheric correction according to Vermote et al. [32]. To
theperform
     images NDVI
               were submitted
                     calculations,tothe
                                     atmospheric   correctiontoaccording
                                        image was converted                  to Vermote
                                                                 surface reflectance      et al. [32].
                                                                                       according       Tomethod
                                                                                                   to the  perform
NDVI    calculations,
    described          the image
                by Carlotto  [33]. was converted to surface reflectance according to the method described
by Carlotto [33].
    2.4. Plant Parameters
2.4. Plant Parameters
          After measurements to calculate the NDVI, 50 leaves (i.e., the diagnose leaf) were randomly
    collectedmeasurements
      After    from each plot toforcalculate the NDVI,
                                    the determination    50 leaves
                                                      of the         (i.e.,nutrient
                                                             leaf-tissue    the diagnose
                                                                                    content.leaf) were leaf
                                                                                             The third   randomly
                                                                                                            from
collected
    top to bottom of the stalk with clearly visible dewlap, is the most photosynthetically activeleaf
            from  each  plot  for the determination  of the leaf-tissue   nutrient  content.  The   third  andfrom
                                                                                                                is
    used for monitoring the nutritional status of sugarcane crop [31].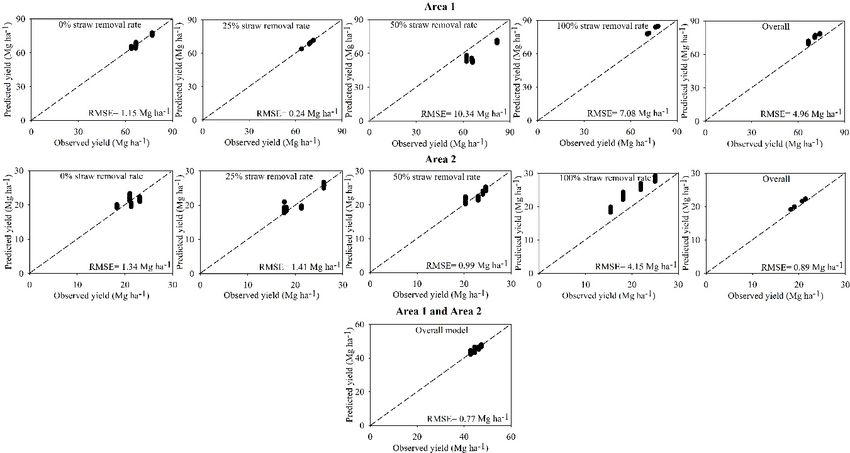
Agronomy 2018, 8, 196                                                                              7 of 21

top to bottom of the stalk with clearly visible dewlap, is the most photosynthetically active and is used
for monitoring the nutritional status of sugarcane crop [31].
     At the end of the ratoon cycle, approximately one year after previous harvesting, the sugarcane
yield was quantified. The fresh stalk mass was mechanically harvested from the five central rows
(500 m long covering an area of 525 m2 ) of each plot, weighed in the field using a wagon coupled to a
balance and the results expressed in Mg ha−1 .

2.5. Data Analysis
      The data were initially subjected to exploratory analysis (descriptive statistics), aiming to verify
the position and dispersion of the data using the Statistical Analysis System (SAS) 9.4 Software Package
for Windows 8 (SAS Inc, Cary, NC, USA).
      In order to select the explaining variables of stalk yield, a stepwise multiple regression
(Y = a + b1 x1 + b2 x2 + ... + bn xn ) was applied. This functions by the systematic addition or removal
of variables in the regression, based on a statistical test of significance for each variable (p < 0.05).
The final model includes only those variables that have a decisive influence on the dependent variable.
The models were evaluated according to the coefficient of determination, residual standard error and
the Durbin–Watson test. The Durbin–Watson test ranges from 0 to 4, where values closer to 2 indicate
optimal values [34], i.e., the absence of autocorrelation in the data. The means of variables selected
by stepwise multiple regression were compared according to Tukey’s test (p < 0.05). In addition,
the overall model that pools data from both studied areas was tested through sensitivity analysis,
where position measurements (maximum, minimum, and mean) of each selected variable were inserted
independently in the model, aiming to evaluate the resulting variations in sugarcane yield.
      Finally, a model validation process was carried out with 30% of the data that were not used to
generate the models. The relationship between the observed and predicted values were evaluated
by the root mean square error (RMSE). The Pearson correlation matrix was also used to evaluate the
relationship between observed and predicted productivity of sugarcane with variables selected with
the stepwise models.

3. Results

3.1. NDVI Values
      The NDVI obtained using the data from the hyperspectral sensor and the satellite images
presented differences with respect to the distribution and magnitude of the values between the
experimental areas (Figure 5). In Area 1, the NDVI values using the sensor and the satellite images
ranged between 0.60 to 0.80 and 0.40 to 0.60, respectively. However, in Area 2 the NDVI values
were smaller, ranging between 0.40 to 0.70 and 0.20 to 0.50 for the sensor and the satellite images,
respectively. On average, NDVI values (from both methodologies) were 34% higher in Area 1 than in
Area 2.
      In both experimental areas, only the NDVI values derived from hyperspectral sensor followed a
normal distribution (Figure 5). The largest differences were found in the NDVI values derived from the
satellite images, especially when the removal rates were 25% and 50% for Area 1 and Area 2, which did
not follow a normal data distribution. Although there are variations between NDVI derived by these
two methods, the results showed a quite similar pattern in the variations of the NDVI data due to
straw removal rates.

3.2. Sugarcane Leaf-Tissue Nutrient Concentration
     The nutrient concentration in the sugarcane leaves varied according to the straw removal rate at
both sites (Figures 6 and 7). The greatest variation was observed in the elements K (5 to 15 g/kg−1 )
and Ca (2 to 6 g/kg−1 ), whereas that the variation was less intense for the other elements. Despite that,
for the majority of cases, nutrient data did not followed a normal distribution (Figures 6 and 7).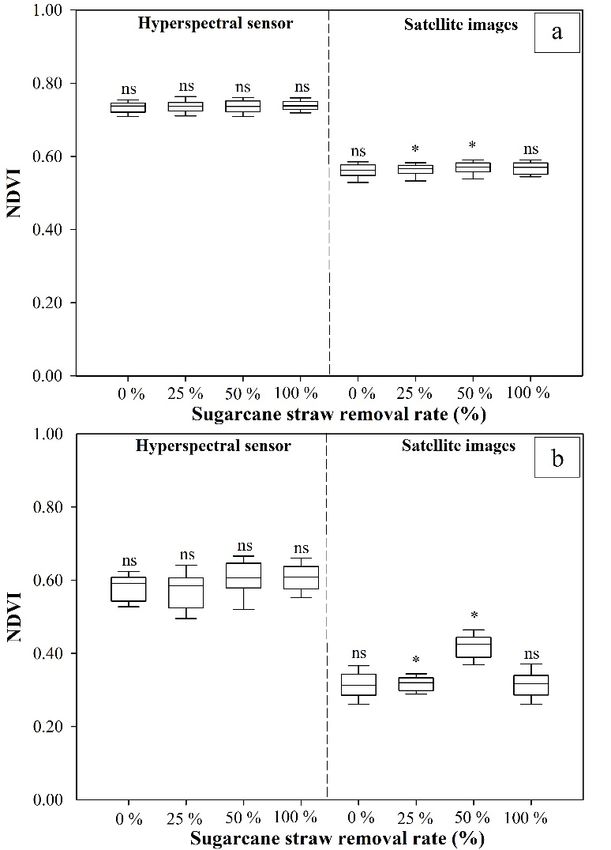
Agronomy 2018, 8, 196                                                                                                 8 of 21
 Agronomy 2018, 8, x FOR PEER REVIEW                                                                                    8 of 21

       Figure5.5.Values
     Figure       Values of of NDVI
                            NDVI  forfor Areas
                                      Areas      1 (a)
                                             1 (a) andand
                                                       2 (b)2 at
                                                              (b)the
                                                                   at different
                                                                      the different
                                                                                ratesrates   of straw
                                                                                       of straw        removal.
                                                                                                 removal.        Shapiro–
                                                                                                          Shapiro–Wilk
       Wilk   Test  for  normal   distribution,  where:   *  significant   (p <  0.05)   and  ns   not significant.
     Test for normal distribution, where: * significant (p < 0.05) and ns not significant. When significant,        When
       significant, it indicates that the hypothesis   for  normal    distribution
     it indicates that the hypothesis for normal distribution is rejected.          is rejected.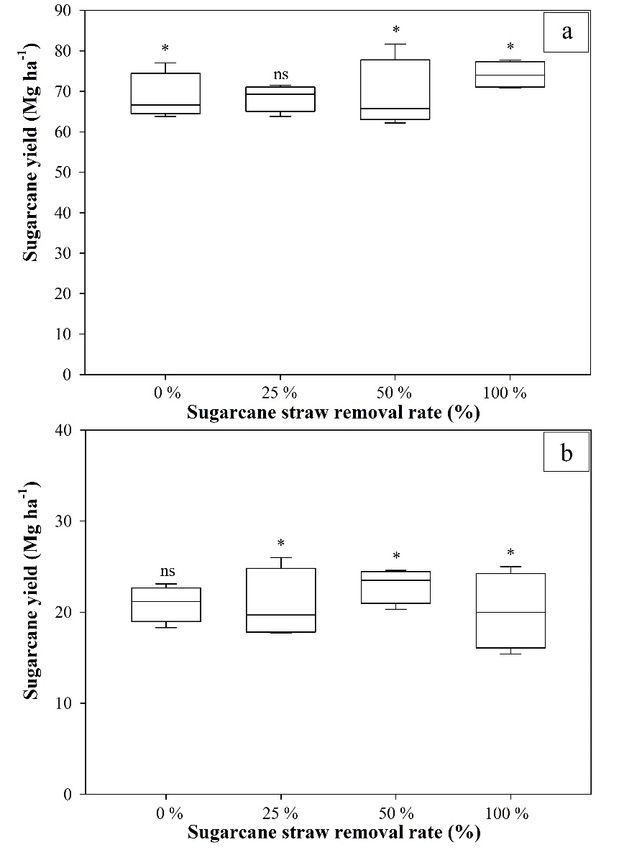
Agronomy 2018, 8, 196                                                                                                9 of 21
   Agronomy 2018, 8, x FOR PEER REVIEW                                                                             9 of 21

        Figure
     Figure     6. Leaf-tissue
             6. Leaf-tissue       concentrations
                              concentrations         of P,
                                                  of N, N,K,P,Ca,
                                                               K, Mg,
                                                                   Ca, and
                                                                       Mg, Sand   S in sugarcane
                                                                              in sugarcane growngrown
                                                                                                    under under  straw
                                                                                                          straw removal
        removal   rates of 0 (a), 25 (b), 50 (c), and 100%   (d) in Area 1. Shapiro–Wilk  Test for normal distribution,
     rates of 0 (a), 25 (b), 50 (c), and 100% (d) in Area 1. Shapiro–Wilk Test for normal distribution, where:
        where: * significant (p < 0.05) and ns not significant. When significant, it indicates that the hypothesis
     * significant  (p < 0.05) and ns not significant. When significant, it indicates that the hypothesis for
        for normal distribution is rejected.
     normal distribution is rejected.

        Figure 7. Leaf-tissue concentration of N, P, K, Ca, Mg, and S in sugarcane grown under straw removal
     Figure 7. Leaf-tissue concentration of N, P, K, Ca, Mg, and S in sugarcane grown under straw removal
        rates of 0 (a), 25 (b), 50 (c), and 100% (d) in Area 2. Shapiro–Wilk Test for normal distribution, where:
     rates of 0 (a), 25 (b), 50 (c), and 100% (d) in Area 2. Shapiro–Wilk Test for normal distribution, where:
        * significant (p < 0.05) and ns not significant. When significant, it indicates that the hypothesis for
     * significant (p < 0.05) and ns not significant. When significant, it indicates that the hypothesis for
        normal distribution is rejected.
     normal distribution is rejected.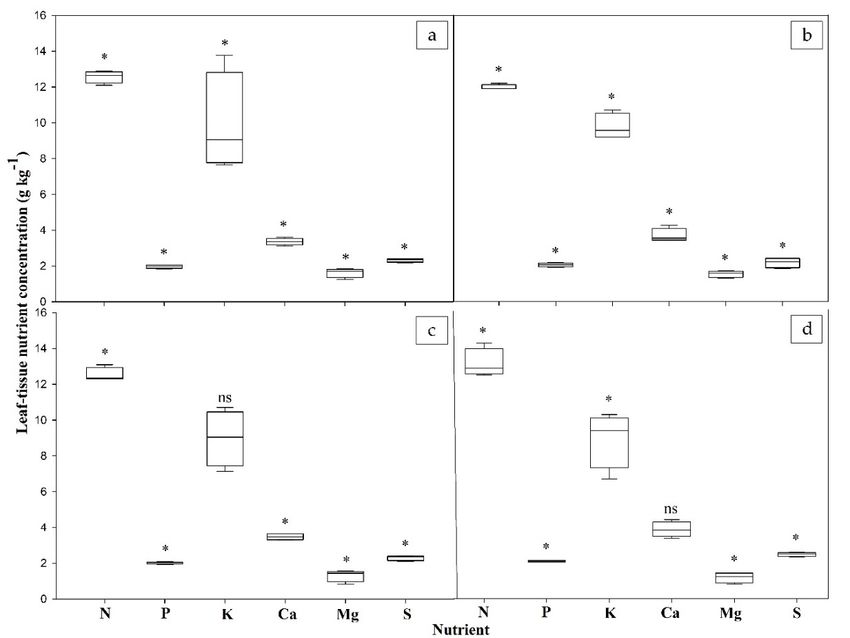
Agronomy 2018, 8, 196                                                                                            10 of 21
Agronomy 2018, 8, x FOR PEER REVIEW                                                                               10 of 21

3.3. Sugarcane Yield
 3.3. Sugarcane Yield
      Sugarcane yield varied from 60 to 85 Mg ha−−11 and from 10 to 30 Mg ha−−11 for the Areas 1 and 2,
       Sugarcane yield varied from 60 to 85 Mg ha and from 10 to 30 Mg ha for the Areas 1 and 2,
respectively. On average, sugarcane yield was three times higher in Area 1 than in Area 2 (Figure 8).
 respectively. On average, sugarcane yield was three times higher in Area 1 than in Area 2 (Figure 8).
Our findings showed that straw removal rates did not linearly affect sugarcane yield, but it depends
 Our findings showed that straw removal rates did not linearly affect sugarcane yield, but it depends
on the site-specific characteristics related to soil, climate, and variety.
 on the site-specific characteristics related to soil, climate, and variety.

                                             −1 changes induced by straw removal rates in Areas 1 (a) and 2 (b).
      Figure8.8. Sugarcane
     Figure      Sugarcaneyieldyield(Mg
                                     (Mgha ha−1)) changes induced by straw removal rates in Areas 1 (a) and 2 (b).
     Shapiro–Wilk
      Shapiro–WilkTest  Testfor
                             fornormal
                                 normaldistribution,
                                          distribution,where:
                                                        where:**significant
                                                                 significant(p(p
Agronomy 2018, 8, 196 11 of 21
yield compared to NDVI derived from hyperspectral sensor, and therefore, this parameter was included
in all the models.
Table 4. Stepwise models for estimating the components of sugarcane yield under straw removal rates
in Areas 1 and 2.
Straw Removal Rate (%) Models r2 * SRE DW
Area 1
0 y = 205.38 − 48.66 P − 0.83 K − 58.36 NDVISI 0.94 1.76 1.78
25 y = 546.65 − 58.07 P − 30.31 N + 7.18 NDVISI 0.91 1.31 1.52
50 y = 322.62 − 108.24 P − 6.33 N + 60.36 NDVISI 0.88 4.07 1.48
100 y = 193.25 − 56.54 P + 4.25 NDVISI + 0.27 N 0.85 2.10 1.65
Overall (Area 1) y = 136.70 + 42.84 NDVISI − 51.19 P + 1.61 N 0.97 2.56 1.56
Area 2
0 y = −13.20 + 1.75 N − 13.76 NDVISI 0.87 6.64 1.44
25 y = −166.31 + 25.60 P + 6.51 N + 22.76 NDVISI 0.91 8.65 1.65
50 y = 42.25 − 12.41 P + 22.23 NDVISI 0.76 4.50 1.59
100 y = 134.25 – 20.90 Ca − 20.51 P + 31.89 NDVISI 0.94 4.29 1.56
Overall (Area 2) y = −127.21 + 3.80 NDVISI − 0.26 N + 54.88 P 0.88 3.86 1.61
Overall (Area 1 and Area 2) y = −150.028 + 79.11 NDVISI − 3.65 N + 115.28 P 0.89 1.79 1.72
SRE: standard residual error (%); DW: Durbin–Watson test. N: nitrogen; P: phosphorus; K: potassium; Ca: calcium;
and NDVISI : NDVI obtained by satellite images. * correlation coefficient.
The nutrients that most influenced crop yield were P and N, being included in the model for at
least one straw removal rate in both experimental areas; while the K and Ca were only included in the
models for the removal rates of 0% and 25% for Area 1 and 100% for Area 2. Overall models for Area
1 and 2, separately and together, included the parameters such as NDVI obtained from the satellite
images, leaf-tissue concentration of P and N.
The models presented efficient performance to predict the sugarcane yield (Table 4). In Area 1,
the r2 values varied between 0.85 and 0.94 with the highest SRE encountered under the 50% removal
rate (4.07%). The r2 values varied between 0.76 and 0.94 for Area 2, with the highest SRE observed
under the 25% removal rate (8.65%). Although SRE of 8.65% was the highest value observed in the
two areas it was considered acceptable by the validation of the model. In the overall models, the r2
and SRE values for Areas 1 and 2 were 0.97% and 2.56%, and 0.88% and 3.86%, respectively, and for
the general model representing both areas the r2 and SRE values were 0.89% and 1.79%, respectively.
For the models generated individually for each straw removal rate in each of the two areas, for the
general models for each area and for the general model representing both areas, the Durbin–Watson
test values were similar, with values ranging between 1.44 and 1.78. These values were close to 2 (ideal
threshold), showing that the data do not present autocorrelation [34]. The sensitivity analysis of the
overall model for Areas 1 and 2, showed that yield ranged 11% (i.e., 39.2 to 52.5 Mg ha−1 ) when the
selected parameter changed from the minimum to maximum value. Individually, variation on NDVI,
P, and N impacts were 55.84%, 55.03%, and 53.10% in the sugarcane yield.
3.5. Effect of Sugarcane Straw Removal on Selected Yield-Explaining Variables
The comparison of the means of the selected variables by the stepwise model indicated that
sugarcane yield was not altered by straw removal management within the study period (Figure 9a).
In relation to the variables that explained the sugarcane yield, it was observed that 25% straw removal
rate induced a reduction in the NDVI, using the satellite image data (Figure 9b), and the leaf-tissue
P content (Figure 9d) in Area 1. However, 50% straw removal rate induced an increase in the NDVI,
using the satellite image data (Figure 9b) and the leaf-tissue N (Figure 9c) and P (Figure 9d) contents in
Area 2.Agronomy 2018, 8, 196 12 of 21
Agronomy 2018, 8, x FOR PEER REVIEW 12 of 21
Figure 9.
Figure 9. Comparison
Comparison of the sugarcane
sugarcane straw
straw removal
removal rates
rates with
with the
the variables
variables selected
selected by
by the
the stepwise
stepwise
model means. Sugarcane yield (a), the NDVI obtained from the satellite image data
model means. Sugarcane yield (a), the NDVI obtained from the satellite image data (b), leaf-tissue (b), leaf-tissue N
(c),(c),
N PP (d),
(d),K K(e),
(e),and
andCaCa(f)
(f)contents
contentsininAreas
Areas 11 and
and 2.
2. Means
Means followed
followed byby the same letter areare not
not
statistically different
statistically differentby bythe
theTukey
Tukeytesttest(p(p≤≤ 0.05).
3.6.
3.6. Validation
Validation of
of Models
Models
The
The models
models werewere validated
validated based
based on
on relationship
relationship between
between observed
observed andand predicted
predicted values
values
(Figure 10). In general, the results revealed increases of estimate errors (i.e.,
(Figure 10). In general, the results revealed increases of estimate errors (i.e., RMSE values)RMSE values)
withwith
the
the increase in the straw removal rate (0% to 100% straw removal rate). The highest
increase in the straw removal rate (0% to 100% straw removal rate). The highest values were observed values were
observed for of
for the rates the50rates of Mg
(10.34 50 (10.34
ha−1) and ha−1 )(4.15
Mg 100% and 100%
Mg ha(4.15
−1) forMg ha−11) and
Areas for Areas 1 and 2 respectively.
2 respectively. The overall
The overall model, including Areas 1 and 2, was efficient to predict the sugarcane
model, including Areas 1 and 2, was efficient to predict the sugarcane yield, presenting RMSE yield, presenting
of 0.77
RMSE of 0.77 Mg ha −1 .
Mg ha .−1Agronomy 2018, 8, 196 13 of 21
Agronomy 2018, 8, x FOR PEER REVIEW 13 of 21
Figure10.
Figure 10.Comparison
Comparison of ofsugarcane
sugarcane yield observed
yield observedwithwith
predicted values
predicted with Stepwise
values models.models.
with Stepwise The
diagonal dashed line is the 1:1 line, whereas RMSE is the root mean square error.
The diagonal dashed line is the 1:1 line, whereas RMSE is the root mean square error.
Observed(OY)
Observed (OY)andand predicted
predicted (PY)(PY)
yieldyield data presented
data presented satisfactory
satisfactory performance
performance when
when compared
compared to the variables selected through the stepwise models (Table 5). Leaf-tissue
to the variables selected through the stepwise models (Table 5). Leaf-tissue P concentration presented P concentration
presented negative correlation with OY and PY yield data for the Area 1 subjected to all rates of straw
negative correlation with OY and PY yield data for the Area 1 subjected to all rates of straw removal
removal (i.e., 0%, 25%, 50%, and 100%). Similar pattern was also observed to the general model for
(i.e., 0%, 25%, 50%, and 100%). Similar pattern was also observed to the general model for the same
the same area. While for Area 2, P presented negative correlation with PY and OY data only under
area. While for Area 2, P presented negative correlation with PY and OY data only under 50% of straw
50% of straw removal. In addition, N presented positive and significant correlations with OY and PY
removal. In addition, N presented positive and significant correlations with OY and PY data from
data from Area 1 under 50% and 100% of straw removal as well as for general model for this area,
Area 1 under 50% and 100% of straw removal as well as for general model for this area, coefficients
coefficients of correlation (r) ranged from 0.33 to 0.68. The correlations among NDVISI, OY, and PY
ofdata
correlation (r) ranged
were positive for allfrom
rates0.33 to 0.68.
of straw The correlations
removal among
and overall model forNDVI SI , OY,
the area and pattern
1. Same PY datawas were
positive
verifiedfor allall
for rates ofof
rates straw
straw removal
removal andin overall
the Area model for the
2, except forarea 1. Same
the rate of 25%pattern was removal;
of straw verified for
allcoefficients
rates of straw removal in the Area 2, except for the
of correlation ranged from −0.40 to 0.93 in Area 2. rate of 25% of straw removal; coefficients of
correlation ranged
It taking intofrom −0.40
account to 0.93
overall in Area
model 2.
established for both areas, leaf-tissue concentrations of P
andItN taking
were into accountcorrelated
significantly overall model established
with stalk forin
yield, but both areas,order,
different leaf-tissue concentrations
as follow: P negatively of P
and N were significantly correlated with stalk yield, but in different order, as follow:
correlated with OY (r = −0.45) and PY (r = −0.50) data, while N was positively correlated with OY (r = P negatively
correlated
0.55) and with
PY (r OY= 0.58) −0.45)
(r =data. Similarly, (r = SI−correlated
and PYNDVI 0.50) data,positively
while N with
was OYpositively
(r = 0.60,correlated with
p < 0.05) and PYOY
(r (r = 0.68,and
= 0.55) p < PY
0.05)(r data.
= 0.58) data. Similarly, NDVISI correlated positively with OY (r = 0.60, p < 0.05) and
PY (r = 0.68, p < 0.05) data.Agronomy 2018, 8, 196 14 of 21
Table 5. Correlation matrix between observed and predicted sugarcane yield values with selected variables with stepwise models.
Area 1 Area 2
0%
P K NDVISI OY PY N NDVISI OY PY
P - N -
K 0.19 - NDVISI −0.14 -
NDVISI −0.23 0.22 - OY 0.54 * 0.37 * -
OY −0.84 ** 0.60 ** 0.71 ** - PY 0.87 ** 0.60 ** 0.75 ** -
PY −0.86 ** 0.62 ** 0.74 ** 0.97 ** -
25%
P N NDVISI OY PY P N NDVISI OY PY
P - P -
N −0.85 ** - N −0.49 * -
NDVISI 0.01 0.38 - NDVISI −0.56 * 0.02 -
OY −0.62 * 0.25 0.50 * - OY 0.62 ** 0.23 −0.37 * -
PY −0.71 ** 0.23 0.45 * 0.98 ** - PY 0.68 ** 0.26 −0.40 * 0.90 ** -
50%
P N NDVISI OY PY P NDVISI OY PY
P - P -
N 0.15 - NDVISI −0.41 * -
NDVISI −0.16 0.46 * - OY −0.73 ** 0.60 ** -
OY −0.90 ** 0.33 * 0.84 ** - PY −0.88 ** 0.76 ** 0.89 ** -
PY −0.96 ** 0.35 * 0.81 ** 0.93 ** -
100%
P N NDVISI OY PY P Ca NDVISI OY PY
P - P -
N −0.62 ** - Ca −0.54 * -
NDVISI −0.39 * 0.25 - NDVISI 0.23 0.30 -
OY −0.96 ** 0.56 ** 0.73 ** - OY −0.22 0.64 ** 0.30 -
PY −0.91 ** 0.64 ** 0.61 ** 0.98 ** - PY −0.14 0.72 ** 0.29 0.97 ** -
Overall
P N NDVISI OY PY P N NDVISI OY PY
P - P -
N 0.95 ** - N 0.84 ** -
NDVISI −0.54 * −0.28 - NDVISI −0.24 0.12 -
OY −0.84 ** 0.68 ** 0.86 ** - OY −0.28 −0.26 0.61 ** -
PY −0.81 ** 0.61 ** 0.93 ** 0.96 ** - PY −0.24 −0.28 0.69 ** 0.97 ** -Agronomy 2018, 8, 196 15 of 21
Table 5. Cont.
Area 1 Area 2
Overall (Area 1 and Area 2)
P N NDVISI OY PY
P -
N 0.96 ** -
NDVISI −0.08 0.08 -
−0.45
OY 0.55 * 0.60 ** -
*
−0.50
PY 0.58 * 0.68 ** 0.90 ** -
*
*, ** Significant at p < 0.05 and p < 0.01, respectively. OY: observed yield; PY: predicted yield; N: nitrogen; P: phosphorous; K: potassium; Ca: calcium and NDVISI : NDVI obtained by
satellite images.Agronomy 2018, 8, 196 16 of 21
4. Discussion
4.1. Effect of Straw Removal on the Leaf-Tissue Nutrient Concentration and Sugarcane Yield
Sugarcane straw removal had little or even no impacts on leaf-tissue nutrient content (Figures 6
and 7). Nutrient cycling in the soil was minimally affected by the straw removal rates in the short
term [12], and therefore, plant nutrition was little affected. Among the evaluated elements, K and Ca
presented the largest variations in both experimental areas. The sugarcane straw can recycle about
80–100 kg ha−1 of K [35,36]. According to Rosolem et al. [37], more than 80% of the K is present in
a soluble form in plant tissues, which makes this element easily leached from plant tissues [9] for
later absorption by the plant root system. Unbalanced absorption of K may also change Ca content in
plant tissues, since both elements interfere in the physiological process of transporting sugars into the
plant [38].
Although K and Ca were the most variable in the plant tissues as a function of straw removal,
N and P were the most sensitive nutrients to the straw removal rates (Figure 9c,d). When compared
to other nutrients—such as P, K, Ca, Mg, and S—N presented the largest reduction in the soil with
straw removal [39]. On the other hand, straw removal led to small reductions in the level of soil
P, since the content of this element in straw is low (Table 3). However, the majority of P is highly
adsorbed in the soil particles (especially Fe and Al oxides) [40], thus, small inputs of P in organic forms
via straw decomposition can be important to increase plant-availability P in the soils [41]. In addition,
the organic acids released during straw decomposition may compete for adsorption sites and increase
the availability of phosphate ions in the soil solution [42].
The sugarcane yield varied three times between the two areas evaluated (Figure 8). This difference
may be related to the greater soil fertility of Area 1, in which soil P, K, Ca, and Mg contents and base
saturation percentage were on the average 42%, 55%, 69%, 67%, and 29%, respectively higher than
Area 2. Thus, higher soil fertility in Area 1 likely allowed that plants accumulate higher levels of these
nutrients in the leaf tissue, which is directly related to the increase of the sugarcane yield [43]. Sugarcane
presents high nutritional needs once it a crop that remains in the field for several years (~5 to 8 years),
with high nutrient removal in each annual harvesting cycle. Therefore, improper replenishment of
nutrients is one of the reasons for yield loss during the annual harvesting cycles [44,45].
The sugarcane straw removal did not affect biomass production (Figure 9a). These results are in
agreement with other studies reporting that the removal of up to 50% of the straw produced did not
impact crop yield [18,19,46]. In addition, through an extensive literature review, Carvalho et al. [9]
suggested that at least 7 Mg ha−1 of straw should remain on the soil surface to sustain suitable soil
functioning and plant yield over time. However, as the crop tends to lose the productive potential
(stalk and straw) over successive harvesting cycles [19,47], the amount of straw that should be removed
after each harvesting cycle may be different.
Over the past few years, studies have brought very relevant understanding about the impacts of
straw removal management on soil quality [12,14,36,48], SOC accumulation [49,50], greenhouse gas
emissions [51–53], plant growth and stalk yield [18,19,46,54–56]. Despite this fact, future studies are
essential to understand the long-term implications of straw removal management on soil and stalk yield.
So far, we only have prediction performed by DayCent model of sugarcane straw removal impacts
on SOC accumulation across the different soil types within the main core occupied with the crop in
Brazil (i.e., central-south region) [49,50]. However, these estimates performed by Carvalho et al. [49]
and Oliveira et al. [50] still have to be validated by long-term experiment, still inexistent in Brazil.
The same statement is true for the yield prediction models developed in this present study, which gave
us relevant insights related to the potentialities of NVDI and leaf-tissue nutrient concentration to
predict sugarcane yield in fields impacted by straw removal management.Agronomy 2018, 8, 196 17 of 21
4.2. NDVI Acquisition by Satellite Image vs Hyperspectral Sensor
The quality of the data used to calculate the NDVI is affected by interference from diverse factors,
depending on the form of data acquisition. When satellite images are used, although the data is
collected with minimum cloud cover, the interference of these few clouds at the moment of data
acquisition could alter the quality of the incident and reflected radiation [57]. Besides this, the capture
of satellite images tends to suffer a greater influence from the soil than that experienced using the
hyperspectral sensor, where readings are taken above the canopy and rows with minimal soil influence.
Thus, the NDVI values using satellite images are normally lower [58]. These interferences explain
the difference of 34% observed between the NDVI using the hyperspectral sensor those obtained
using satellite images for the sugarcane in the two experimental areas (Figure 5). Although several
studies have shown a high correlation between the NDVI obtained using hyperspectral sensor and
satellite image data [59,60], we suggest caution when choosing the spectral data acquisition platform
to calculate the NDVI.
The NDVI from the satellite images data was included in all the models generated (Table 4) and
was efficient for detecting the effects of straw removal rates on sugarcane yield in Areas 1 and 2
(Figure 9b). In spite of limitations attributed to NDVI data derived from satellite images, the results
showed that acquired data from satellite images better represented the variation in sugarcane yield [61].
This type of data acquisition has the advantage that it can be applied for larger areas in relation to
the data acquired using hyperespectral sensors, which are generally limited to smaller areas of the
crop canopy.
4.3. Sugarcane Yield Prediction Using the NVDI and Leaf-Tissue Nutrient Concentration
In all the stepwise models established to estimate sugarcane yield as a function of each straw
removal rate, the NDVI was included (Table 4). This inclusion can be explained by the fact that
most of models used to estimate sugarcane yield are based on the estimated biomass production [62].
This would explain, at least in part, the efficiency of the NDVI to detect stalk yield changes as a function
of the straw removal rates, as this index has a high correlation with crop biomass [63].
Among the nutrients included in the site-specific models (i.e., N, P, and K for Area 1; and N,
P, and Ca for Area 2), only N and P were included in the overall model for the two areas (Table 4).
Nutrients such as N and P are present in larger quantities in younger plants, being more sensitive
to changes caused by different management systems [64,65]. In addition, the relationship of these
nutrients with the NDVI in the models was expected due to the influence of these elements on the
photosynthetic process, which in turn, change the spectral responses by the plant, influencing the
NDVI [66,67]. In this approach, other studies can be performed to identify the spectral signatures of
the nutrients in the leaves so that the model can only be applied using spectral data.
The performance of the models in the validation process were also satisfactory when observed
RMSE values between the rates of 0% to 100%, ranged from 0.24 to 10.34 Mg ha−1 for the area
1 and 0.99 to 4.15 Mg ha−1 for Area 2 (Figure 10). These values agree with those reported by
Fernandes et al. [68], which found RMSE values of predicted sugarcane yields ranged from 7.20
to 11.00 Mg ha−1 . In addition, the sensitivity analysis showed that overall model for Areas 1 and
2 provides a satisfactory margin for the prediction of sugarcane yield with similar soil and climate
conditions of this study. Therefore, the overall model performance showed NDVI from satellite images
and leaf-tissue nutrient concentrations can be useful and alternative tool to improve the sugarcane
yield predictions.
5. Conclusions
The normalized difference vegetation index (NDVI) can be a useful tool for predicting sugarcane
yield in fields managed with straw removal management in Brazil. Between the methods of data
acquisition to calculate NDVI, satellite image was more efficient than hyperspectral sensor for detectingAgronomy 2018, 8, 196 18 of 21
straw removal effects on sugarcane yield. In addition, concentrations of leaf-tissue N and P were also
important parameters to develop the prediction models of sugarcane yield.
Prediction model approach based on data of NDVI and concentration of leaf-tissue nutrients
collected in early stages of crop growth can help the Brazilian sugarcane sector to predict crop
yield in fields intensively managed for bioenergy production. In addition, these models can be
used for monitoring spatio-temporal crop yield changes induced by straw removal and supporting
decision making towards a more sustainable crop residue management in Brazilian sugarcane fields.
The sugarcane yield prediction models developed in this study have to be further tested and validated
using data from long-term straw removal experiments, so far, still inexistent in Brazil.
Author Contributions: I.P.L.: field sampling, writing, review; J.M.D.: data analyses, writing, review; M.R.C.:
writing and review; P.P.S.B.: field sampling and writing; P.R.F.: financial support and writing; C.C.C.: this paper is
in his memory; C.E.P.C.: financial support, writing and review.
Funding: I.P.L. thanks The Brazilian Federal Agency for Support and Evaluation of Graduate Education (CAPES
process #88881.134605/2016-01) and CNPq (processes #141459/2015-8 and #201207/2017-6) for providing his Ph.D.
scholarships in Brazil and the United States. M.R.C. thanks the “Fundação de Estudos Agrários Luiz de Queiroz”
(project #67555) for providing his post-doctoral fellowship. Also, we want to thank the Brazilian Development
Bank–BNDES and the Raízen Energia S/A for funding our research (project #14.2.0773.1).
Acknowledgments: We are grateful to Lilian Duarte, Admilson Margato, Ralf Araújo, Sandra Nicolete,
Dagmar Vasca and Eleusa Basse for the strong assistance in the experiment conduction and samples analyses in
the laboratory.
Conflicts of Interest: The authors declare no conflict of interest.
References
1. FAO—Food and Agriculture Organization. Available online: http://faostat.fao.org/ (accessed on
25 July 2018).
2. Companhia Nacional de Abastecimento-Conab. Available online: https://www.conab.gov.br/ (accessed on
25 July 2018).
3. REN21-Highlights of the REN21 Renewables 2017 Global Status Report in Perspective. Available online:
http://www.ren21.net/wp-content/uploads/2017/06/GSR2017_Highlights_FINAL.pdf (accessed on
15 June 2018).
4. Goldemberg, J.; Mello, F.F.; Cerri, C.E.; Davies, C.A.; Cerri, C.C. Meeting the global demand for biofuels in
2021 through sustainable land use change policy. Energy Policy 2014, 69, 14–18. [CrossRef]
5. de Expansão de Energia 2024. Available online: http://www.epe.gov.br (accessed on 1 May 2018).
6. Cunha, F.M.; Badino, A.C.; Farinas, C.S. Effect of a novel method for in-house cellulase production on 2G
ethanol yields. Biocatal. Agric. Biotechnol. 2017, 9, 224–229. [CrossRef]
7. Lisboa, I.P.; Cherubin, M.R.; Cerri, C.C.; Cerri, D.G.P.; Cerri, C.E.P. Guidelines for the recovery of sugarcane
straw from the field during harvesting. Biomass Bioenergy 2017, 96, 69–74. [CrossRef]
8. Leal, M.R.L.V.; Galdos, M.V.; Scarpare, F.V.; Seabra, J.E.A.; Walter, A.; Oliveira, C.O.F. Sugarcane straw
availability, quality, recovery and energy use: A literature review. Biomass Bioenergy 2013, 53, 11–19.
[CrossRef]
9. Carvalho, J.L.N.; Nogueirol, R.C.; Menandro, L.M.S.; Bordonal, R.D.O.; Borges, C.D.; Cantarella, H.;
Franco, H.C.J. Agronomic and environmental implications of sugarcane straw removal: A major review.
Glob. Chang. Biol. Bioenergy 2017, 9, 1181–1195. [CrossRef]
10. Cherubin, M.R.; Oliveira, D.M.S.; Feigl, B.J.; Pimentel, L.G.; Lisboa, I.P.; Gmach, M.R.; Varanda, L.L.;
Moraes, M.C.; Satiro, L.S.; Popin, G.V.; et al. Crop residue harvest for bioenergy production and its
implications on soil functioning and plant growth: A review. Sci. Agric. 2018, 75, 255–272. [CrossRef]
11. Corrêa, S.T.R.; Carvalho, J.L.N.; Hernandes, T.A.D.; Barbosa, L.C.; Menandro, L.M.S.; Leal, M.R.L.V.
Assessing the effects of different amountsof sugarcane straw on temporal variability of soil moisture content
and temperature. In Proceedings of the 25th European Biomass Conference and Exhibition, Stockholm,
Sweden, 12–15 June 2017; pp. 12–15.
12. Satiro, L.S.; Cherubin, M.R.; Safanelli, J.L.; Lisboa, I.P.; Junior, P.R.R.; Cerri, C.E.E.; Cerri, C.C. Sugarcane
straw removal effects on Ultisols and Oxisols in south-central Brazil. Geod. Reg. 2017, 11, 86–95. [CrossRef]Agronomy 2018, 8, 196 19 of 21
13. Dos Anjos, J.C.R.; Júnior, A.S.A.; Bastos, E.A.; Noleto, D.H.; Melo, F.B.; De Brito, R.R. Water storage in
a Plinthaqualf cultivated with sugarcane under straw levels. Pesqui. Agropecu. Brasil. 2017, 52, 464–473.
[CrossRef]
14. Bordonal, R.O.; Menandro, L.M.S.; Barbosa, L.C.; Lal, R.; Milori, D.M.B.P.; Kolln, O.T.; Franco, H.C.J.;
Carvalho, J.L.N. Sugarcane yield and soil carbon response to straw removal in south-central Brazil. Geoderma
2018, 328, 79–90. [CrossRef]
15. Fortes, C.; Vitti, A.C.; Otto, R.; Ferreira, D.A.; Franco, H.C.J.; Trivelin, P.C.O. Contribution of nitrogen from
sugarcane harvest residues and urea for crop nutrition. Sci. Agric. 2013, 70, 313–320. [CrossRef]
16. Paredes Junior, F.P.; Portilho, I.I.R.; Mercante, F.M. Atributos microbiológicos de um latossolo sob cultivo de
cana-de-açúcar com e sem queima da palhada. Semin. Ciênc. Agrár. 2015, 36, 151–164. [CrossRef]
17. Valim, W.C.; Panachuki, E.; Pavei, D.S.; Sobrinho, T.A.; Almeida, W.S. Effect of sugarcane waste in the control
of interrill erosion. Semin. Ciênc. Agrár. 2016, 37, 1155–1164. [CrossRef]
18. Aquino, G.S.; Medina, C.C.; Costa, D.C.; Shahaba, M.; Santiago, A.D.; Cunha, A.C.B.; Kussaba, D.A.O.;
Carvalho, J.B.; Moreira, A. Does straw mulch partial-removal from soil interfere in yield and industrial
quality sugarcane? A long term study. Ind. Crops Prod. 2018, 111, 573–578. [CrossRef]
19. Lisboa, I.P.; Cherubin, M.R.; Lima, R.P.; Cerri, C.C.; Satiro, L.S.; Wienhol, B.J.; Schmer, M.R.; Jin, V.L.;
Cerri, C.E.P. Sugarcane straw removal effects on plant growth and stalk yield. Ind. Crops Prod. 2018, 111,
794–806. [CrossRef]
20. Tucker, C.J.; Holben, B.N.; Elgin, J.H.; Mcmurtrey, J.E. Relationship of spectral data to grain yield variation.
Photogramm. Eng. Remote Sens. 1980, 46, 657–666.
21. Tarnavsky, E.; Garrigues, S.; Brown, M.E. Multiscale geostatistical analysis of AVHRR, SPOT-VGT,
and MODIS global NDVI products. Remote Sens. Environ. 2008, 112, 535–549. [CrossRef]
22. Sanches, G.M.; Duft, D.G.; Kölln, O.T.; Luciano, A.C.; De Castro, S.G.; Okuno, F.M.; Franco, H.C. The potential
for RGB images obtained using unmanned aerial vehicle to assess and predict yield in sugarcane fields. Int. J.
Remote Sens. 2018, 15, 1–3. [CrossRef]
23. Peralta, N.R.; Assefa, Y.; Du, J.; Barden, C.J.; Ciampitti, I.A. Mid-season high-resolution satellite imagery for
forecasting site-specific corn yield. Remote Sens. 2016, 8, 1–16. [CrossRef]
24. Damian, J.M.; Santi, A.L.; Fornari, M.; Da Ros, C.O.; Eschner, V.L. Monitoring variability in cash-crop yield
caused by previous cultivation of a cover crop under a no-tillage system. Comput. Electron. Agric. 2017, 142,
607–621. [CrossRef]
25. Lofton, J.; Tubana, B.S.; Kanke, Y.; Teboh, J.; Viator, H.; Dalen, M. Estimating sugarcane yield potential
using an in-season determination of normalized difference vegetative index. Sensors 2012, 12, 7529–7547.
[CrossRef] [PubMed]
26. Yang, H.; Yang, X.; Heskel, M.; Sun, S.; Tang, J. Seasonal variations of leaf and canopy properties tracked by
ground-based NDVI imagery in a temperate forest. Sci. Rep. 2017, 1267, 1–10. [CrossRef] [PubMed]
27. Sardans, J.; Grau, O.; Chen, H.Y.H.; Janssens, I.A.; Ciais, P.; Piao, S.; Peñuelas, J. Changes in nutrient
concentrations of leaves and roots in response to global change factors. Glob. Chang. Biol. 2017, 23, 3849–3856.
[CrossRef]
28. USDA-United States Department of Agriculture. Available online: https://www.usda.gov/ (accessed on
18 June 2018).
29. CEPAGRI—Tempo e Clima Unicamp. Available online: https://www.cpa.unicamp.br (accessed on
2 February 2017).
30. Posto Meteorológico “Professor Jesus Marden dos Santos” ESALQ—USP. Available online: http://www.leb.
esalq.usp.br/posto/ (accessed on 2 February 2017).
31. Raij, B.; Cantarella, H.; Guaggio, J.A.; Furlani, A.M.C. Recomendações De Adubação E Calagem Para O Estado De
São Paulo, 1st ed.; Instituto Agronômico and Fundacão IAC: Campinas, Brazil, 1997; pp. 6–13.
32. Vermote, E.F.; Tanre, D.; Deulze, J.L.; Herman, M.; Morcrette, J.J. Second Simulation of the Satellite Signal in
the Solar Spectrum, 6S: An overview. IEEE Trans. Geosci. Remote 1997, 35, 675–686. [CrossRef]
33. Carlotto, M.J. Reducing the effects of space-varying, wavelength-dependent scattering in multispectral
imagery. Int. J. Remote Sens. 1999, 20, 3333–3344. [CrossRef]
34. Neter, J.; Wasserman, W.; Kutner, M.H. Applied Linear Statistical Methods, 5th ed.; Irwin Professional
Publishing: Chicago, IL, USA, 1985; pp. 50–78.Agronomy 2018, 8, 196 20 of 21
35. Franco, H.C.J.; Pimenta, M.T.B.; Carvalho, J.L.N.; Magalhães, P.S.G.; Rossell, C.E.V.; Braunbeck, O.A.;
Vitti, A.C.; Kolln, O.T.; Neto, J.R. Assessment of sugarcane trash for agronomic and energy purposes in
Brazil. Sci. Agric. 2013, 70, 305–312. [CrossRef]
36. Trivelin, P.C.O.; Franco, H.C.J.; Otto, R.; Ferreira, D.A.; Vitti, A.C.; Fortes, C.; Faroni, C.E.; Oliveira, E.C.A.;
Cantarella, H. Impact of sugarcane trash on fertilizer requirements for São Paulo, Brazil. Sci. Agric. 2013, 70,
345–352. [CrossRef]
37. Rosolem, C.A.; Calonego, J.C.; Foloni, J.S.S. Lixiviação de potássio da palha de espécies de cobertura de solo
de acordo com a quantidade de chuva aplicada. Rev. Bras. Cienc. Sol. 2003, 27, 355–362. [CrossRef]
38. Endres, L.; Cruz, S.J.S.; Vilela, R.D.; Santos, J.M.; Barbosa, G.V.S.; Silva, J.A.C. Foliar applications of calcium
reduce and delay sugarcane flowering. Bioenerg. Res. 2016, 9, 98–108. [CrossRef]
39. Vitti, G.; Luz, P.; Otto, R. Agrícola Ouro Verde, 10th ed.; Lençóis Paulista: Lencóis Paulista, Brazil, 2008;
pp. 1–19.
40. Campos, M.; Antonangelo, J.A.; Alleoni, L.R.F. Phosphorus sorption index in humid tropical soils.
Soil Tillage Res. 2016, 156, 110–118. [CrossRef]
41. Damon, P.M.; Bowden, B.; Rose, T.; Rengel, Z. Crop residue contributions to phosphorus pools in agricultural
soils: A review. Soil Biol. Biochem. 2014, 74, 127–137. [CrossRef]
42. Pavinato, P.S.; Rosolem, C.A. Disponibilidade de nutrientes no solo—Decomposição e liberação de compostos
orgânicos de resíduos vegetais. Rev. Bras. Cienc. Sol. 2008, 32, 911–920. [CrossRef]
43. Leite, J.M.; Ciampitti, I.A.; Mariano, E.; Vieira-Megda, M.X.; Trivelin, P.C. Nutrient, partitioning and
stoichiometry in unburnt sugarcane ratoon at varying yield levels. Front. Plant Sci. 2016, 7, 1–14. [CrossRef]
[PubMed]
44. Paul, G.C.; Bokhtiar, S.M.; Rehman, H.; Kabiraj, R.C.; Rahman, A.B.M.M. Efficacies of some organic fertilizers
on sustainable sugarcane production in old Himalayan piedmont plain soil of Bangladesh. Pak. Sugar J. 2005,
20, 2–5.
45. Dotaniya, M.L.; Datta, S.C.; Biswas, D.R.; Dotaniya, C.K.; Meena, B.L.; Rajendiran, S.; Regar, K.L.; Lata, M.
Use of sugarcane industrial by-products for improving sugarcane productivity and soil health. Int. J. Recycl.
Org. Waste Agric. 2016, 5, 185–194. [CrossRef]
46. Aquino, G.S.; Medina, C.C.; Costa, D.C.; Shahaba, M.; Santiago, A.D. Sugarcane straw management and its
impact on production and development of ratoons. Ind. Crops Prod. 2017, 102, 58–64. [CrossRef]
47. Singh, S.N.; Singh, A.K.; Malik, J.P.S.; Kumar, R.; Sharma, M.L. Cultural-practice packages and trash
management effects on sugarcane ratoons under sub-tropical climatic conditions of India. J. Agric. Sci. 2012,
150, 237–247. [CrossRef]
48. Castioni, G.A.; Cherubin, M.R.; Menandro, L.M.S.; Sanches, G.M.; de Oliveira Bordonal, R.; Barbosa, L.C.;
Carvalho, J.L.N. Soil physical quality response to sugarcane straw removal in Brazil: A multi-approach
assessment. Soil Tillage Res. 2018, 184, 301–309. [CrossRef]
49. Carvalho, J.L.; Hudiburg, T.W.; Franco, H.C.; DeLucia, E.H. Contribution of above-and belowground
bioenergy crop residues to soil carbon. Glob. Chang. Biol. Bioenerg. 2017, 9, 1333–1343. [CrossRef]
50. Oliveira, D.M.; Williams, S.; Cerri, C.E.; Paustian, K. Predicting soil C changes over sugarcane expansion in
Brazil using the DayCent model. Glob. Chang. Biol. Bioenerg. 2017, 9, 1436–1446. [CrossRef]
51. Pitombo, L.M.; Cantarella, H.; Packer, A.P.C.; Ramos, N.P.; do Carmo, J.B. Straw preservation reduced total
N2O emissions from a sugarcane field. Soil Use Manag. 2017, 33, 583–594. [CrossRef]
52. Vasconcelos, A.L.S.; Cherubin, M.R.; Feigl, B.J.; Cerri, C.E.; Gmach, M.R.; Siqueira-Neto, M. Greenhouse gas
emission responses to sugarcane straw removal. Biomass Bioenergy 2018, 113, 15–21. [CrossRef]
53. Tavares, R.L.M.; Spokas, K.; Hall, K.; Colosky, E.; Souza, Z.M.D.; Scala, N.L. Sugarcane residue management
impact soil greenhouse gas. Ciênc. Agrotec. 2018, 42, 195–203. [CrossRef]
54. da Silva, J. Sistemas de manejo da palhada influenciam acúmulo de biomassa e produtividade da
cana-de-açúcar (var. RB855453). Act. Sci. Agron. 2010, 32, 345–350. [CrossRef]
55. Aquino, G.S.; de Conti Medina, C.; Junior, A.D.O.M.; Pasini, A.; Brito, O.R.; Cunha, A.C.B.; Almeida, L.F.
Impact of harvesting with burning and management of straw on the industrial quality and productivity of
sugarcane. Afr. J. Agric. Res. 2016, 11, 2462–2468. [CrossRef]
56. Aquino, G.S.; de Conti Medina, C.; Silvestre, D.A.; Gomes, E.C.; Benitez, A.C.; Cunha, D.A.O.K.;
Santiago, A.D. Straw removal of sugarcane from soil and its impacts on yield and industrial quality ratoons.
Sci. Agric. 2018, 75, 526–529. [CrossRef]You can also read