Predictors of COVID-19 epidemics in countries of the World Health Organization African Region - Nature
←
→
Page content transcription
If your browser does not render page correctly, please read the page content below
Articles
                                                                                                          https://doi.org/10.1038/s41591-021-01491-7

Predictors of COVID-19 epidemics in countries of
the World Health Organization African Region
Feifei Zhang 1 ✉, Humphrey Karamagi 2, Ngoy Nsenga 2, Miriam Nanyunja2,
Miriam Karinja 3, Seth Amanfo1, Margo Chase-Topping4,5, Giles Calder-Gerver1,
Miles McGibbon 1, Alexandra Huber 1, Tara Wagner-Gamble 1, Chuan-Guo Guo 6,
Samuel Haynes4, Alistair Morrison1, Miranda Ferguson 1, Gordon A. Awandare7, Francisca Mutapi4,
Zabulon Yoti2, Joseph Cabore2, Matshidiso R. Moeti2 and Mark E. J. Woolhouse 1

Countries of the World Health Organization (WHO) African Region have experienced a wide range of coronavirus disease
2019 (COVID-19) epidemics. This study aimed to identify predictors of the timing of the first COVID-19 case and the per
capita mortality in WHO African Region countries during the first and second pandemic waves and to test for associations
with the preparedness of health systems and government pandemic responses. Using a region-wide, country-based observa-
tional study, we found that the first case was detected earlier in countries with more urban populations, higher international
connectivity and greater COVID-19 test capacity but later in island nations. Predictors of a high first wave per capita mortal-
ity rate included a more urban population, higher pre-pandemic international connectivity and a higher prevalence of HIV.
Countries rated as better prepared and having more resilient health systems were worst affected by the disease, the imposi-
tion of restrictions or both, making any benefit of more stringent countermeasures difficult to detect. Predictors for the second
wave were similar to the first. Second wave per capita mortality could be predicted from that of the first wave. The COVID-19
pandemic highlights unanticipated vulnerabilities to infectious disease in Africa that should be taken into account in future
pandemic preparedness planning.

C
       OVID-19, caused by severe acute respiratory syndrome coro-              connectivity might also have an important influence on the course
       navirus 2 (SARS-CoV-2), presents a continuing threat to                 of the pandemic in Africa9. Using the data for COVID-19 cases and
       both global health and the global economy. By early March               deaths from the WHO COVID-19 Dashboard, this study aimed to
2021, more than 119 million cases worldwide had been reported,                 identify predictors of the timing of the first case and the per capita
with more than 2.6 million deaths1. Despite the implementation of              mortality rate in the first and second COVID-19 pandemic waves
unprecedented public health interventions, including social distanc-           in the WHO African Region and to test for any effect of interven-
ing, contact tracing and large-scale lockdowns of the population2, the         tion measures on COVID-19-related deaths. We included, as pre-
burden of the disease has continued to rise but with substantial varia-        dictors, existing indices of epidemic preparedness—COVID-19
tion among countries and regions and with countries in many regions            readiness status and the more generic infectious diseases resilience
around the world experiencing multiple waves1. As of 14 March 2021,            index (Supplementary Table 1)—to test the expectation that coun-
the WHO African Region had experienced two waves of infection                  tries rated as better prepared would suffer less severe outcomes.
and had reported a total of over 2.9 million cases of infection and            The main findings and limitations of the study are summarized
more than 74,000 deaths1,3. A third wave is currently in progress.             in Table 1.
   Gaining an understanding of variation in the progression of
the pandemic in different countries will aid the response to future            Results
pandemics. Current evidence from high- and middle-income                       COVID-19 epidemics in countries of the WHO African Region.
countries suggests that demographics (for example, percentage of               On 25 February 2020, Algeria was the first country in the WHO
the population aged 65 years or older), comorbidities, healthcare              African Region to report COVID-19 cases (Fig. 1a). Thirty-one
resources and stringency of response are important risk factors for            countries reported their first cases in the 2 weeks from 12 March
COVID-19-related infections2,4–6. It was suggested that Africa would           to 26 March 2020. Lesotho was the last of the 47 countries to report
be more susceptible to SARS-CoV-2-related cases and deaths given               its first case, on 14 May 2020. There was no apparent relation-
the higher prevalence of pre-existing conditions, including tuber-             ship between the timing of the first COVID-19 case and the first
culosis, malaria, AIDS, diabetes, undernourishment and other                   death (Fig. 1a).
communicable and non-communicable comorbidities, as well as                        The 47 Member States reported a total of 29,635 COVID-19
lower accessibility to healthcare7,8. Recent work suggests that spatial        deaths in the first wave and 44,850 deaths in the second wave.

1
 Usher Institute, University of Edinburgh, Edinburgh, United Kingdom. 2WHO Regional Office for Africa, Brazzaville, Republic of Congo. 3University of
Nairobi Institute of Tropical and Infectious Diseases, Nairobi, Kenya. 4School of Biological Sciences, University of Edinburgh, Edinburgh, United Kingdom.
5
 Roslin Institute and Royal (Dick) School of Veterinary Studies, University of Edinburgh, Edinburgh, United Kingdom. 6Department of Medicine, Li Ka Shing
Faculty of Medicine, University of Hong Kong, Hong Kong, China. 7West African Centre for Cell Biology of Infectious Pathogens, University of Ghana,
Accra, Ghana. ✉e-mail: feifei.zhang@ed.ac.uk

Nature Medicine | www.nature.com/naturemedicine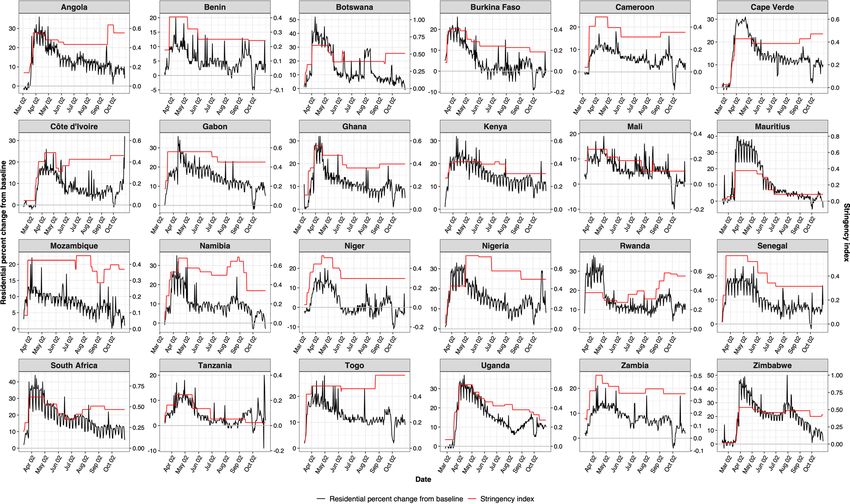
Articles                                                                                                                     NATURE MEDICInE

Table 1 | Policy summary
Category            Description
Background          The direct and indirect effects of the COVID-19 pandemic have been highly heterogeneous across Africa. It is important to establish
                    whether this variation is primarily driven by differences in intrinsic socio-ecological characteristics, responses to the pandemic or an
                    artifact of differences in reporting.
Main findings and This observational study confirmed that early onsets of national COVID-19 epidemics were partly driven by international
limitations       connectivity, whereas high urbanization, international connectivity and HIV/AIDS prevalence predicted high first wave mortality rate,
                  which, in turn, was a predictor of high second wave mortality rate. Levels of preparedness and resilience, expected to reflect a causal
                  relationship with effective pandemic management, instead had the opposite relationship. Our analysis corrected for estimated levels
                  of under-reporting of COVID-19 deaths. However, varied levels of data availability and quality of reporting still remain a concern,
                  particularly the mortality data gaps in some countries excluded from this analysis.
Policy implications The observation that the COVID-19 pandemic has had a greater effect on WHO African Region countries perceived to be less
                    vulnerable to infectious disease outbreaks challenges current definitions of ‘preparedness’ and ‘resilience’. More urbanized countries
                    with stronger travel links and with more advanced healthcare systems were more vulnerable to COVID-19 mortality, contrary to
                    expectations. This could be due to differences in access to healthcare, mismatches between investments in strong health systems
                    vis-à-vis COVID-19 response needs and/or the syndemic nature of COVID-19 providing unique challenges. The possible association
                    with the prevalence of HIV/AIDS requires further exploration, as multiple co-factors, such as poverty, other health conditions,
                    different socio-economic status and other variables, could be correlated with this—although the finding is consistent with a broader
                    pattern of a range of comorbidities having a significant effect on COVID-19 mortality rates. Although our results were found to
                    be robust to variation in testing effort, there is evidence of under-reporting and a clear need for improved surveillance and death
                    certification systems. The finding of no evidence that a more stringent policy response to the first wave reduced the size of the second
                    wave in countries that experienced it is consistent with the risk factors that we identify as being difficult or impossible to mitigate
                    against. The current and future introduction of variants of COVID-19 will either accentuate or dampen these effects depending on
                    their relative infectiousness. Future emphasis should focus on a more comprehensive perspective of preparedness, mitigation and
                    resilience.

However, Tanzania discontinued reporting of COVID-19-related                    (HR = 2.87, 95% CI 1.12–7.32) were identified as risk factors for
deaths from 8 May 2020, and Burundi, Eritrea and Seychelles were                earlier detection of the first case (Fig. 3 and Supplementary Table 2).
outliers (0.009, 0 and 0 per 100,000 population first wave mortality
rates, respectively). São Tomé and Príncipe, as well as Seychelles,             Predictors of per capita mortality during the first wave. We
had missing data on the prevalence of HIV. These five countries                 included 42 countries and 18 predictors (Supplementary Fig. 1b–s)
were, therefore, excluded from the mortality rate analyses, giving              in the generalized linear mixed models (GLMMs) for per capita
a sample size of 42. Daily new deaths in the whole WHO African                  mortality in the first wave. In the univariable analyses, the percent-
Region peaked on 5 August 2020 in the first wave and on 18 January              age of urban population, GDP per capita, human development
2021 in the second wave (Fig. 1b), lagging 16 and 7 d behind the                index, volume of international air travel, infectious disease resilience
peak of daily new cases in the first and second waves, respectively.            index, prevalence of HIV and latitude were risk factors (Fig. 4 and
The WHO African Region as a whole experienced a higher second                   Supplementary Table 3). The correlation between the time to first
wave peak than the first wave: 323 deaths (on 5 August 2020) and                case and per capita mortality was not significant (P = 0.22). In the
675 (on 18 January 2021), respectively. In the first wave, the highest          multivariable GLMM, the percentage of urban population (risk ratio
mortality per 100,000 population was reported from South Africa                 (RR) = 1.61, 95% CI 1.25–2.06), volume of international air travel
(33.3), followed by Cape Verde (17.5) and Eswatini (8.6) (Fig. 1c).             (RR = 1.31, 95% CI 1.04–1.66) and prevalence of HIV (RR = 1.40,
In the second wave, the highest mortality per 100,000 population                95% CI 1.10–1.78) were risk factors for mortality rate in the first wave
was also reported from South Africa (55.4), followed by Eswatini                (Fig. 4 and Supplementary Table 3). Percentage of urban population
(39.8) and Botswana (17.7) (Fig. 1d). Twenty countries had higher               was included in all models within +2-corrected Akaike information
or similar mortality rates in the second wave than in the first wave,           criterion (AICc) scores (Methods); volume of international air travel
whereas 23 countries had lower mortality rates in the second wave               and HIV prevalence were included in most but not all.
than in the first wave (Fig. 2).                                                    None of the predictors in the best multivariable model was
                                                                                correlated with any of the COVID-19 testing variables (correla-
Predictors of the timing of the first case. We included 47 coun-                tion coefficients < 0.6) (Extended Data Fig. 2). We then re-ran the
tries and 15 predictors (Supplementary Fig. 1a–k,p–s) in the Cox                best multivariable GLMMs with each additional testing variable
regression model for timing of the first case. Spearman’s correla-              (Supplementary Fig. 1u,w–x). No test variable was associated with
tion identified five pairs of predictors with correlation coefficients          the per capita mortality rate and reduced the AICc, and there were
greater than 0.6 (Extended Data Fig. 1). The univariable Cox regres-            no changes in the RRs estimated by the best multivariable model
sion model identified total population size, number of international            (Extended Data Fig. 3 and Supplementary Table 3).
airports, volume of international air travel, COVID-19 test capacity                There was a good consistency between the stringency index and
and COVID-19 readiness status as risk factors for earlier detection             percent change of residential mobility as indicated by the Google
of the first case and current health expenditure (percent of GDP) as            mobility data. After controlling for temporal and random effects,
protective factors (Fig. 3 and Supplementary Table 2). In the mul-              the stringency index was non-linearly associated with the resi-
tivariable model, the percentage of urban population (hazard ratio              dential mobility (P < 0.0001), with an effective degree of freedom
(HR) = 1.40, 95% confidence interval (CI) 1.01–1.95), number of                 of 8.66. The R2 of the model is 0.77, and the explained deviance is
international airports (HR = 1.48, 95% CI 1.02–2.14), volume of                 77.5%.
international air travel (HR = 1.52, 95% CI 1.10–2.11), COVID-19                    None of the predictors in the best multivariable model was corre-
test capacity (HR = 3.86, 95% CI 1.83–8.15) and number of borders               lated with the two stringency scores (correlation coefficients < 0.6)

                                                                                                             Nature Medicine | www.nature.com/naturemedicine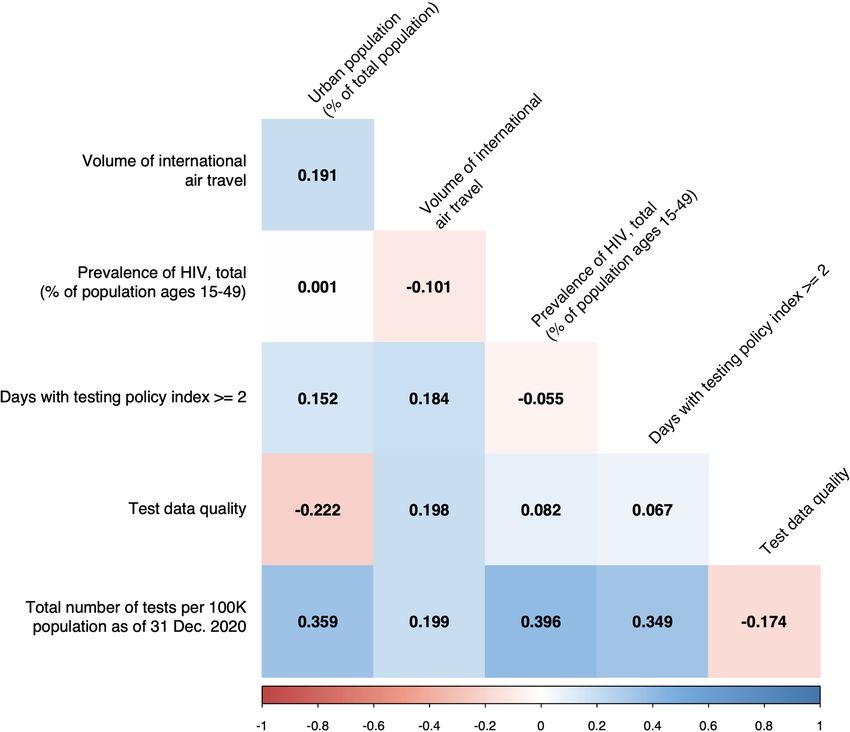
NATURE MEDICInE Articles
a Lesotho May 14
First wave ended on 31 Oct 2020
Second wave ended on 14 Mar 2021
Comoros First case May 01
São Tomé and Príncipe Apr 07
South Sudan First death
Apr 06
Malawi Apr 03
Sierra Leone Apr 01
Burundi Apr 01
Botswana Apr 01
Mali Mar 26
Guinea Bissau Mar 26
Mozambique Mar 23
Uganda Mar 21
Madagascar Mar 21
Eritrea Mar 21
Angola Mar 21
Zimbabwe Mar 20
Cabo Verde Mar 20
Niger Mar 19
Chad Mar 19
Zambia Mar 18
Mauritius Mar 18
Gambia Mar 18
Country
United Republic of Tanzania Mar 17
Liberia Mar 17
Benin Mar 17
Seychelles Mar 15
Rwanda Mar 15
Congo Mar 15
Namibia Mar 14
Mauritania Mar 14
Kenya Mar 14
Guinea Mar 14
Ghana Mar 14
Gabon Mar 14
Ethiopia Mar 14
Eswatini Mar 14
Equatorial Guinea Mar 14
Central African Republic Mar 14
Côte d’Ivoire Mar 12
Democratic Republic of the Congo Mar 11
Burkina Faso Mar 11
Togo Mar 07
Cameroon Mar 06
South Africa Mar 05
Senegal Mar 02
Nigeria Feb 28
Algeria Feb 25
Feb 25 Mar 25 Apr 25 May 25 Jun 25 Jul 25 Aug 25 Sep 25 Oct 25 Nov 25 Dec 25 Jan 25 Feb 25
Date
b c d
1,000
750
Count
500
33.28 55.44
17.47 39.8
8.56 17.75
6.34 13.27
250
4.62 8.72
2.6 6.34
1.34 2.57
0.63 0.99
0 0
0
No death reported No death reported
Feb 25 Apr 25 Jun 25 Aug 25 Oct 25 Dec 25 Feb 25 Non-WHO African country/no data Non-WHO African country/no data
Date
Fig. 1 | COVID-19 pandemic in the WHO African Region. a, Timeline of the first case and first death. b, Pandemic curve for daily new deaths. Map of per
capita mortality rates in the first wave (c) and in the second wave (d). Tanzania, Burundi, Eritrea and Seychelles were excluded (Methods) and are shown in
gray in c and d.
(Extended Data Fig. 4). Again, we then re-ran the best multivari- latitude were risk factors for per capita mortality in the second wave
able GLMMs, once with each stringency score (Supplementary (Extended Data Fig. 7 and Supplementary Table 5). Per capita mor-
Fig. 1y,z). No stringency score was associated with the per capita tality rate in the first wave was also a risk factor. Disability-adjusted
mortality rate, and none reduced the AICc (Extended Data Fig. 5 life years (DALYs) per 100,000 individuals from communicable,
and Supplementary Table 3). We explored other thresholds of neonatal, maternal and nutritional diseases was identified as a pro-
cumulative per capita mortality, and all produced consistent results. tective factor.
There were 11, 10, 10 and 11 countries in the categories of high
(area under the curve (AUC) of stringency index)/high (per capita Discussion
mortality), high/low, low/high and low/low, respectively (Fig. 5a). In this study, we identified statistical predictors of the timing of the
In the univariable multinomial logistic model, the percentage of first case and the per capita mortality rates during the first and sec-
urban population, infectious disease resilience index and human ond COVID-19 pandemic waves for countries in the WHO African
development index were risk factors for one or more categories rela- Region. The percentage of urban population, number of interna-
tive to low/low (Extended Data Fig. 6 and Supplementary Table 4). tional airports, volume of pre-pandemic international air travel,
In the multivariable multinomial logistic model, the percentage of COVID-19 test capacity and number of borders were predictors
urban population and infectious disease resilience index were risk of the earlier detection of the first case. The percentage of urban
factors for high/high, low/high and/or high/low relative to low/low population, volume of pre-pandemic international air travel and
(Fig. 5b). As above, we also added the three COVID-19 testing pre- prevalence of HIV were risk factors for per capita mortality rate
dictors into the best multivariable multinomial logistic model, and in the first pandemic wave. Stringency and timing of government
the results remained consistent (Supplementary Table 4). restrictions were not associated with the mortality rate, but coun-
tries with higher proportions of urban population and higher infec-
Predictors of per capita mortality during the second wave. We tious disease resilience scores were at increased risk of an adverse
included 42 countries and 19 predictors (Supplementary Fig. outcome, defined as either high AUC of stringency index and/or
1b–g,j–o,r,s,v–y and Fig. 1c) in the univariable GLMM for per high per capita mortality. Predictors of per capita mortality rates
capita mortality in the second wave. Consistent with the results in the two waves were broadly consistent, and per capita mortality
for the univariable analysis of the first wave, human development rate in the first wave was predictive of per capita mortality rate in
index, infectious disease resilience index, prevalence of HIV and the second wave.
Nature Medicine | www.nature.com/naturemedicine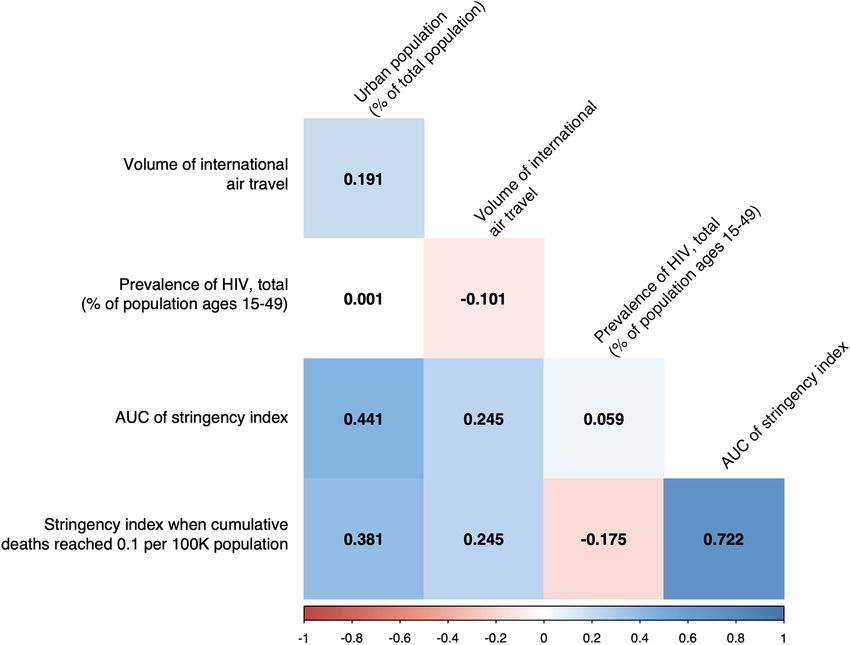
Articles NATURE MEDICInE
South Africa
Eswatini
Botswana
Comoros Lesotho
Cape Verde
Zimbabwe Namibia
10.00
São Tomé and Príncipe
Malawi
Per 100,000 population mortality rate in the second wave
Zambia Mauritania
Senegal
Algeria
Mozambique
Gabon
Rwanda Gambia
Ghana Kenya
Mali
1.00 Ethiopia Equatorial Guinea
DRC Angola
Congo
Uganda Niger Togo
Cameroon
Guinea Bissau
Burkina Faso
Nigeria
Benin South Sudan
Chad Madagascar
Côte d’Ivoire
Guinea
0.10
Sierra Leone
Liberia
Central African Republic
0.01
Mauritius
0.01 0.10 1.00 10.00
Per 100,000 population mortality rate in the first wave
Fig. 2 | Scatter plot of per capita mortality in the first and second waves. Axes on log10 scale with points falling on the axes denoting zero deaths. The
dashed line indicates identical levels of mortality rates in two waves. Tanzania, Burundi, Eritrea and Seychelles were not shown due to incomplete data/
being outliers. Note that São Tomé and Principe was not included in mortality rate analyses due to missing predictor data. DRC, Democratic Republic of
the Congo.
Category Variable Univariable P values Multivariable P values
Demographics Population, totalNATURE MEDICInE Articles
Multivariable
Category Variable Univariable P values (AICc = 624.94) P values
Demographics Population density (people per sq. km of land area) 0.077
Urban population (% of total population) 0.001Articles NATURE MEDICInE
a
South Africa
Low/high: 10 countries High/high: 11 countries
Cape Verde
10.00 Eswatini
Equatorial Guinea
Gambia
Per 100,000 population mortality rate in the first wave
Algeria
Mauritania Namibia
Gabon
Guinea Bissau
Lesotho Senegal Congo
Kenya Zimbabwe Liberia
Central African Republic
Cameroon Ethiopia
Zambia Sierra Leone
1.00 Mauritius Ghana
Angola
Malawi Botswana
Madagascar
Guinea Comoros
Mali Togo
Chad ˄ d’Ivoire
Cote Nigeria
Benin South Sudan
Mozambique
Burkina Faso Democratic Republic of the Congo
Niger
Rwanda
Uganda
0.10
0.01 Low/low: 11 countries High/low: 10 countries
50 70 100
AUC of stringency index
b
Variable High/low P values Low/high P values High/high P values
Urban population 0.020 0.028 0.006
(% of total population)
Infectious disease 0.092 0.024 0.015
resilience index
1 10 100 1 10 100 0.1 1.0 10.0 100.0
Odds ratio Odds ratio Odds ratio
Fig. 5 | Associations with stringency index. a, Scatter plot for AUC of stringency index and per capita mortality rate in the first wave. Vertical axis has log10
scale. Dashed lines indicate median values, separating countries into four categories: high/high, high/low, low/high and low/low. b, Odds ratios (ORs) and
95% CIs in multivariable multinomial logistic regression model. n = 42 countries. Error bars are shown. Statistically significant risk factors are in red. Exact
two-sided P values for the Wald test are shown for each predictor, and two-sided P values < 0.05 were considered statistically significant.
travel and prevalence of HIV, and negatively correlated with DALY between predictors and outcome. Effects due to unmeasured con-
rates from both communicable diseases and non-communicable founders might influence the results and interpretation. Statistical
diseases (Extended Data Fig. 1). This result contradicts speculation power is limited by sample size, so the final multivariable mod-
that poor countries with a low resilience would be most affected by els include only those predictors with the strongest effects; others
COVID-19 (see also ref. 11). In Africa, more urbanized countries might have effect sizes too small to be retained in the models. Given
and those considered more resilient to infectious diseases suffered the enormous number of combinations of predictors that could be
more from both the direct and indirect effects of the pandemic. considered, it is possible that the best fitting models were not identi-
Similar results for the first and second waves suggest that there fied. Data quality has also been raised as an issue9. Some, possibly
were no major shifts in the epidemiology of COVID-19 over the substantial, under-ascertainment of COVID-19 deaths is likely in
study period, implying no systematic differences in vulnerabilities Africa, as elsewhere25, and could affect our findings if the degree of
to the two waves. There was no relationship between stringency of under-ascertainment was correlated with predictors included in our
measures taken during the first wave and the severity of the second analysis. We directly addressed this issue by including in our analy-
wave. This indicates that, regardless of the stringency and effective- ses independent estimates of under-reporting of COVID-19 deaths
ness of the government response, intrinsic differences among coun- generated by the Institute for Health Metrics and Evaluation25.
tries have a substantial effect on the course of national epidemics. These estimates range up to approximately 75% of COVID-19
This study has some limitations. It is an observational study of deaths unreported (in Burkina Faso, Nigeria and the Democratic
country-level data and cannot demonstrate a direct, causal link Republic of the Congo). The WHO definition of a COVID-19
Nature Medicine | www.nature.com/naturemedicineNATURE MEDICInE Articles
death does not require a positive test result, but it is possible that 8. Walker, P. G. T. et al. The impact of COVID-19 and strategies for mitigation
ascertainment is influenced by testing capacity. However, our main and suppression in low- and middle-income countries. Science 369,
413–422 (2020).
results are robust to inclusion of indicators of testing effort in our 9. Rice, B. L. et al. Variation in SARS-CoV-2 outbreaks across sub-Saharan
statistical models, although we note that test volume data were not Africa. Nat. Med. 27, 447–453 (2021).
collected over exactly the same time period. 10. Zhu, N. et al. A novel coronavirus from patients with pneumonia in China,
The stringency variable is a composite index of government 2019. N. Engl. J. Med. 382, 727–733 (2020).
11. Haider, N. et al. The Global Health Security index and Joint External
policies, reflecting that many countries implemented measures as
Evaluation score for health preparedness are not correlated with countries’
a package. Not all policies are expected to have equal effect, and a COVID-19 detection response time and mortality outcome. Epidemiol. Infect.
wide range of combinations of measures was implemented across 148, e210 (2020).
the region. We validated the stringency index by comparison with 12. Lu, L., Lycett, S., Ashworth, J., Mutapi, F. & Woolhouse, M. What are
Google mobility data. We found a strong association, indicating that SARS-CoV-2 genomes from the WHO Africa region member states telling
us? BMJ Glob. Health 6, e004408 (2021).
the index is related to real-world behavior by at least a subset of the 13. Ngoi, J. M. et al. Genomic analysis of SARS-CoV-2 reveals local viral
population. However, the association weakened over time, as has evolution in Ghana. Exp. Biol. Med. (Maywood) 246, 960–970 (2021).
been reported elsewhere26. 14. Norwegian Institute of Public Health. Urbanization and preparedness for
Our study had several strengths. We considered countries from outbreaks with high-impact respiratory pathogens. https://apps.who.int/
a single WHO region; these should be more comparable in terms gpmb/assets/thematic_papers_2020/tp_2020_4.pdf (2020).
15. Li, M. et al. Identifying novel factors associated with COVID-19 transmission
both of data on predictors and of COVID-19 epidemiology. We and fatality using the machine learning approach. Sci. Total Environ. 764,
restricted our analysis to outcome variables judged to be most reli- 142810 (2020).
ably estimated—date of first case and mortality—while correcting 16. Hashim, M. J., Alsuwaidi, A. R. & Khan, G. Population risk factors for
for under-reporting/under-ascertainment. The evident plausibility COVID-19 mortality in 93 countries. J. Epidemiol. Glob. Health 10,
of the results of our date of first case analysis improves confidence 204–208 (2020).
17. Chaudhry, R., Dranitsaris, G., Mubashir, T., Bartoszko, J. & Riazi, S. A
that the predictor and outcome data are fitted for purpose. country level analysis measuring the impact of government actions, country
In conclusion, we identified risk factors associated with poor preparedness and socioeconomic factors on COVID-19 mortality and related
direct and indirect outcomes of the first two waves of the COVID-19 health outcomes. EClinicalMedicine 25, 100464 (2020).
pandemic in the WHO African Region countries. Our key finding 18. Asfahan, S. et al. Early trends of socio-economic and health indicators
is that countries that were assumed to be better prepared and better influencing case fatality rate of COVID-19 pandemic. Monaldi Arch. Chest
Dis. 90, https://doi.org/10.4081/monaldi.2020.1388 (2020).
equipped to respond to the pandemic were also the most vulnerable 19. Lawal, Y. Africa’s low COVID-19 mortality rate: a paradox? Int. J. Infect. Dis.
to it. These data should be taken into account in future pandemic 102, 118–122 (2021).
preparedness planning for WHO African Region countries. 20. Boulle, A. et al. Risk factors for COVID-19 death in a population cohort
study from the Western Cape Province, South Africa. Clin. Infect. Dis.
Online content https://doi.org/10.1093/cid/ciaa1198 (2020).
21. Ssentongo, P. et al. Epidemiology and outcomes of COVID-19 in
Any methods, additional references, Nature Research report- HIV-infected individuals: a systematic review and meta-analysis. Sci. Rep. 11,
ing summaries, source data, extended data, supplementary infor- 6283 (2021).
mation, acknowledgements, peer review information; details of 22. Leffler, C. T. et al. Association of country-wide coronavirus mortality with
author contributions and competing interests; and statements of demographics, testing, lockdowns, and public wearing of masks. Am. J. Trop.
Med. Hyg. 103, 2400–2411 (2020).
data and code availability are available at https://doi.org/10.1038/
23. Fountoulakis, K. N., Fountoulakis, N. K., Koupidis, S. A. & Prezerakos, P. E.
s41591-021-01491-7. Factors determining different death rates because of the COVID-19 outbreak
among countries. J. Public Health (Oxf.) 42, 681–687 (2020).
Received: 7 May 2021; Accepted: 5 August 2021; 24. Woolhouse, M. How to make predictions about future infectious disease
Published: xx xx xxxx risks. Philos. Trans. R. Soc. Lond. B Biol. Sci. 366, 2045–2054 (2011).
25. Institute for Health Metrics and Evaluation. Estimation of total mortality due
to COVID-19. http://www.healthdata.org/special-analysis/
References estimation-excess-mortality-due-covid-19-and-scalars-reported-covid-
1. World Health Organization. Weekly epidemiological update on COVID-19.
19-deaths (2021).
https://www.who.int/emergencies/diseases/novel-coronavirus-2019/
26. Nouvellet, P. et al. Reduction in mobility and COVID-19 transmission. Nat.
situation-reports (2021).
Commun. 12, 1090 (2021).
2. Hsiang, S. et al. The effect of large-scale anti-contagion policies on the
COVID-19 pandemic. Nature 584, 262–267 (2020).
3. Salyer, S. J. et al. The first and second waves of the COVID-19 pandemic in Publisher’s note Springer Nature remains neutral with regard to jurisdictional claims in
Africa: a cross-sectional study. Lancet 397, 1265–1275 (2021). published maps and institutional affiliations.
4. Zheng, Z. et al. Risk factors of critical & mortal COVID-19 cases: a Open Access This article is licensed under a Creative Commons
systematic literature review and meta-analysis. J. Infect. 81, e16–e25 (2020). Attribution 4.0 International License, which permits use, sharing, adap-
5. Ji, Y., Ma, Z., Peppelenbosch, M. P. & Pan, Q. Potential association between tation, distribution and reproduction in any medium or format, as long
COVID-19 mortality and health-care resource availability. Lancet Glob. as you give appropriate credit to the original author(s) and the source, provide a link to
Health 8, e480 (2020). the Creative Commons license, and indicate if changes were made. The images or other
6. Kandel, N., Chungong, S., Omaar, A. & Xing, J. Health security capacities in third party material in this article are included in the article’s Creative Commons license,
the context of COVID-19 outbreak: an analysis of International Health unless indicated otherwise in a credit line to the material. If material is not included in
Regulations annual report data from 182 countries. Lancet 395, the article’s Creative Commons license and your intended use is not permitted by statu-
1047–1053 (2020). tory regulation or exceeds the permitted use, you will need to obtain permission directly
7. Brauer, M., Zhao, J. T., Bennitt, F. B. & Stanaway, J. D. Global access to from the copyright holder. To view a copy of this license, visit http://creativecommons.
handwashing: implications for COVID-19 control in low-Income countries. org/licenses/by/4.0/.
Environ. Health Perspect. 128, 57005 (2020). © The Author(s) 2021
Nature Medicine | www.nature.com/naturemedicineArticles NATURE MEDICInE
Methods predictor for per capita mortality in the second wave. A test data quality index
Ethics statement. Ethics approval was not required for this study as the data used up to 31 October was generated by the TIBA Pandemic Response Unit and was
in the study were at the country level, and the study is observational. placed into four categories (no data, basic, satisfactory and good; Supplementary
Tables 1 and 6). Details of data collection are given in the TIBA COVID-19 testing
Study design and study area. We performed a region-wide, country-based report38. Estimated ratios of total COVID-19 mortality to reported COVID-19
observational study (Extended Data Fig. 8) that included all 47 Member States of mortality were obtained from the Institute for Health Metrics and Evaluation
the WHO African Region. The WHO African Region has a total population of (Supplementary Table 1)25.
1,019,922,000, with the median age varying from 15.0 years in Niger to 34.6 years Government response data were collected by the TIBA Pandemic Response
in Mauritius27. About 50% of the population in the WHO African Region lack Unit. Details of data collection are given in the TIBA COVID-19 mitigation
access to essential medicines28. Globally, 22 of the 25 countries regarded as most policies report39. All mitigation responses fall into five categories and 14
vulnerable to infectious diseases are in sub-Saharan Africa29. subcategories (Supplementary Table 7). Normalized strictness scores were
We extracted data for daily cases and deaths for each country in the region devised for each of the 14 subcategories. Based on these normalized strictness
and calculated the following three outcomes: timing of the first case and per capita scores, the stringency index representing policies on containment and closure
mortality rates in the first and second waves. Predictors relating to demographics, were calculated using a method developed by OxCGRT40, which is by averaging
socioeconomics, travel, healthcare, comorbidities, readiness and geography were the normalized strictness values of 12 subcategories of measures, excluding all
extracted from public data sources. The ratio of total COVID-19 mortality to governance and socio-economic measures and surveillance and testing from public
reported COVID-19 mortality was obtained from the Institute for Health Metrics health measures.
and Evaluation25. The COVID-19 test data quality and the government response Two variables related to the stringency index were generated: AUC of
data were collected by the Tackling Infections to Benefit Africa (TIBA) Pandemic stringency index scores from 25 February to 31 October 2020 and stringency index
Response Unit. COVID-19 testing policy data were taken from the Oxford score when cumulative mortality reached 0.1 per 100,000 population during the
COVID-19 Government Response Tracker (OxCGRT). Total numbers of tests per first wave. Alternative thresholds ranging from 0.001 to 0.2 were also explored
capita were collected by the Africa Centres for Disease Control and Prevention for validation.
(CDC)3. Statistical models were fitted to evaluate the relationships among the three Google mobility data (https://www.google.com/covid19/mobility/) available
outcomes and predictors. We also ran a secondary analysis for the outcomes per for 25 WHO African Region Member States were used to validate the data for the
capita mortality in the first wave and stringency index. stringency. Details of Google mobility data are included in the TIBA COVID-19
The start date of the analysis was set as 25 February 2020 when the first case mitigation policies report39. The residential percent change of mobility was used
was reported from the WHO African Region (in Algeria). We collated values of to validate stringency index for the following reasons: (1) the residential category
predictor variables as close to this date as possible. has a high correlation coefficient with the other five categories of mobility; (2)
the location accuracy and the understanding vary less across regions than other
Outcomes. Our first outcome—the timing of the first case—refers to the day on categories, so the comparison among countries will cause less bias; and (3) the
which the first official laboratory-confirmed COVID-19 case/cases was/were intention of many mitigation response measures is to encourage people to stay
reported to the WHO (Fig. 1a), largely based on case definitions defined by in their residence. As of 15 November 2020, 24 of 47 WHO African countries
the WHO30. had mobility data for the residential category. Time series plots of stringency
Our other outcomes are the total deaths per 100,000 population (per capita index against residential mobility are shown in Extended Data Fig. 9. We used
mortality rate) during the first and second waves, adjusted for under-reporting a generalized additive mixed model to estimate the relationships between the
where appropriate (see below). According to international guidelines for certificate stringency index and residential mobility over time. We fitted the residential
and coding of COVID-19 as cause of death31, a death due to COVID-19 is defined mobility as a spline function of stringency index s(Stringency index) and a spline
for surveillance purposes as a death resulting from a clinically compatible illness, function of day of the year s(doy), which was used to control for the temporal
in a probable or confirmed COVID-19 case, unless there is a clear alternative cause trend. The temporal relationship between residential mobility and stringency
of death that cannot be related to COVID disease (for example, trauma). There index can be different among countries, so we also introduced a spline function of
should be no period of complete recovery from COVID-19 between illness and country s(country, bs = ‘re’) as random intercepts and country and day of the year
death. A death due to COVID-19 might not be attributed to another disease (for (country, doy, bs = ‘re’) as random slopes. The model was expressed as follows.
example, cancer) and should be counted independently of pre-existing conditions
g(Yij ) = s(Stringency index) + s(doy) + s(country, bs = ′ re′ )
that are suspected of triggering a severe course of COVID-19.
The pandemic curve for daily new deaths for the whole WHO African Region +s(country, doy, bs = ′ re′ ) + εij
was plotted by using 21-d kernel smoothing using the Nadaraya–Watson estimator
(Fig. 1b). Kernel smoothing is a common non-parametric method for revealing where Yij denoted the residential mobility for the ith day in the jth country, and εij
trends in curves. The Nadaraya–Watson estimator can be seen as a weighted is the random noise. s() indicated penalized spline function. bs = ‘re’ indicated that
average using kernel as weighting functions, and a higher weight was assigned the basis function is a random effect structure (basis coefficients are penalized by a
to daily new deaths closer to the target date32. We chose the date with the first ridge penalty to control the degree of smoothness). We used the default parameter
minimum daily new deaths (31 October 2020) as the end of the first wave and settings from the R package mgcv for penalized spline function.
the date of the second minimum daily new deaths (14 March 2021) as the
end of the second wave, and we calculated per capita mortality rate in each wave Statistical methods. All 47 Member States were included in the model for the
for each country. timing of the first case, but the number of Member States included in the model
Data on COVID-19 cases and deaths for all 47 Member States in the WHO for per capita mortality in two waves depended on the completeness of the data.
African Region were taken from the WHO COVID-19 Dashboard33. The data The epidemic curves for both daily cases and deaths in each country within the
include daily new cases, cumulative cases, daily new deaths and cumulative deaths. WHO African Region were plotted to evaluate the completeness of the data. The
government of the United Republic of Tanzania stopped reporting COVID-19
Predictors. A set of predictors considered likely to affect the timing of the first cases/deaths from 8 May and, therefore, was excluded.
case and the per capita mortality rate were collected and included as explanatory For predictors, the most recent available data were used—and no earlier than
variables. The definition, reasons for including the predictor, time range, 2010. If one predictor had missing values, one column of binary indicator was
details of missing data and data sources are reported in Supplementary Table added showing which country has missing data and which has not, and both the
1. Predictors were classified in nine categories: demographics, socioeconomics, raw data and the indicator were included in the model. All predictors used had
travel, healthcare, comorbidities, readiness, geography, COVID-19 testing and data available for at least 90% of countries.
interventions. Demographic and socioeconomic variables might predict both Spearman’s rank correlation was used to test for a correlation among predictors.
vulnerability to severe disease (for example, by age) and transmission potential (for Predictors with a correlation coefficient greater than 0.6 were not included in the
example, urban versus rural populations)19,34. Healthcare, readiness and COVID-19 same multivariable model.
testing variables might predict the capability to detect and/or treat cases17,35. Travel Cox proportional hazards regression models were used to determine HRs
and the number of shared borders are likely to affect the imported cases from and 95% CIs for individual predictors of timing of the first case. A univariable
neighboring countries36. Comorbidities are related to vulnerability to dying from model was fitted first. Only predictors quantified on or before the start date were
infection16. Latitude is related to climate, which might affect transmission rates37. included in this analysis. Comorbidity data were excluded, as there is no a priori
Data on COVID-19 testing were obtained from four sources. Testing effort expectation that these would be predictors. COVID-19 test capacity, COVID-19
was extracted from a recent report of the COVID-19 pandemic in Africa up to the readiness status and the number of borders entered the model as binary variables
end of December 2020 (ref. 3). The predictor variable was total number of tests where ‘no’, ‘limited and moderate’ and ‘no border’ were set as the reference levels,
divided by per 100,000 population. Testing policy index data were collected by respectively. For COVID-19 readiness status, we combined ‘limited’ and ‘moderate’
OxCGRT, which records government policy on access to testing. The ordinal scores into one single level—‘limited and moderate’, because only two countries were at
are shown in Supplementary Table 1, and we calculated days with testing policy the ‘limited’ level (Supplementary Fig. 1q). Three countries (Cape Verde, Mauritius
index ≥2 during the first wave (25 February to 31 October 2020). Testing policy and Seychelles) with unknown COVID-19 readiness status were also included in
index at the start of the second wave on 1 November 2020 was used as a baseline the ‘limited and moderate’ level. Other variables entered the model as continuous
Nature Medicine | www.nature.com/naturemedicineNATURE MEDICInE Articles
variables, and all continuous variables were standardized before entering the model the Institute for Health Metrics and Evaluation, the Oxford COVID-19
by subtracting the mean and dividing by the standard deviation. Variables with Government Response Tracker and the Africa CDC (links are provided in
P values less than 0.2 were considered for inclusion in a multivariable model. If Supplementary Table 1). All data are available via figshare at https://doi.
multiple variables with P values less than 0.2 were highly correlated (correlation org/10.6084/m9.figshare.15022503.
coefficient greater than 0.6), only one variable was selected each time to enter the
multivariable model. The multivariable model with the lowest AICc was taken as Code availability
the best model41, but models with +2 AICc scores were also retained. All code is available via figshare at https://doi.org/10.6084/m9.figshare.15022503.
We used a GLMM with a Poisson error distribution to identify predictors
of per capita mortality rate in the first wave. We used the reported deaths
times the ratio of total COVID-19 mortality to reported COVID-19 mortality
(Supplementary Fig. 1t) as the outcome, population size as an offset and country as
References
27. World Health Organization. Global Health Observatory data repository.
a random effect. The RRs and 95% CIs were calculated. Five countries (the United
https://apps.who.int/gho/data/node.home (2020).
Republic of Tanzania having incomplete data, Burundi, Eritrea and Seychelles
28. Kirigia, J. M., Sambo, H. B., Sambo, L. G. & Barry, S. P. Economic burden of
being clear outliers and Seychelles and São Tomé and Príncipe having missing data
diabetes mellitus in the WHO African region. BMC Int. Health Hum. Rights
for HIV prevalence) were excluded (also for the multinomial logistic model below
9, 6 (2009).
for outcome with respect to per capita mortality in the first wave and stringency).
29. Moore, M., Gelfeld, B. & Okunogbe, A. Identifying future disease hot spots:
Days with testing policy index ≥2 entered the model as a binary variable (using
Infectious Disease Vulnerability Index. https://www.rand.org/pubs/research_
median as the cutoff) where ‘below median’ was set as the reference level. Three
reports/RR1605.html (2016).
countries (Guinea Bissau, Equatorial Guinea and Comoros) with missing days with
30. World Health Organization. WHO COVID-19: Case Definitions. https://apps.
testing policy index were included in the ‘below median’ level. We treated test data
who.int/iris/handle/10665/337834 (2020).
quality as binary, combining no data and basic data to the lower level (reference
31. World Health Organization. International guidelines for certificate and
level), and satisfactory data and good data to the higher level. Univariable models
classification (coding) of COVID-19 as cause of death. https://www.who.int/
and the best multivariable model were fitted using the same approach as for
classifications/icd/Guidelines_Cause_of_Death_COVID-19.pdf (2020).
the timing of the first case. We then added the two stringency scores (AUC of
32. Hazelton, M. L. Kernel Smoothing. In Wiley StatsRef: Statistics Reference
stringency index in Supplementary Fig. 1y and stringency index when cumulative
Online (eds Balakrishnan, N. et al.) https://doi.org/10.1002/9781118445112.
deaths reached 0.1 per 100,000 population in Supplementary Fig. 1z) to the best
stat06538 (2014).
multivariable model and checked for significantly improved model fit (lower
33. World Health Organization. WHO Coronavirus Disease (COVID-19)
AICc). We first estimated the correlations between the two stringency scores and
Dashboard. https://covid19.who.int/info/ (2021).
the set of selected predictors in the best multivariable model, using the Spearman
34. Hradsky, O. & Komarek, A. Demographic and public health characteristics
rank correlation test. Then, we took the best multivariable model and re-ran it
explain large part of variability in COVID-19 mortality across countries.
by adding each stringency score. Again, only stringency scores with correlation
Eur. J. Public Health 31, 12–16 (2021).
coefficients less than 0.6 with the set of selected predictors were included in the
35. Okeahalam, C., Williams, V. & Otwombe, K. Factors associated with
multivariable model. We repeated this exercise for the three testing variables—that
COVID-19 infections and mortality in Africa: a cross-sectional study using
is, adding days with testing policy index ≥2 (Supplementary Fig. 1u), test data
publicly available data. BMJ Open 10, e042750 (2020).
quality (Supplementary Fig. 1w) and tests per capita (Supplementary Fig. 1x) to
36. Chinazzi, M. et al. The effect of travel restrictions on the spread
the best multivariable model for per capita mortality in the first wave and asking
of the 2019 novel coronavirus (COVID-19) outbreak. Science 368,
whether the result was consistent after adjusting for COVID-19 testing.
395–400 (2020).
We carried out a secondary analysis using the original set of predictors of
37. Tzampoglou, P. & Loukidis, D. Investigation of the importance of climatic
COVID-19 mortality in the first wave to predict an outcome combining per
factors in COVID-19 worldwide intensity. Int. J. Environ. Res. Public Health
capita mortality in the first wave and stringency index. In this analysis, countries
17, 7730 (2020).
were placed into four groups based on the medians of total per capita mortality
38. TIBA Pandemic Response Unit. COVID-19 testing report for WHO Africa
in the first wave and of the AUC of stringency index (high stringency/high
Region. https://tiba-partnership.org/tiba/sites/sbsweb2.bio.ed.ac.uk.tiba/files/
mortality, high stringency/low mortality, low stringency/high mortality and low
pdf/TIBA-PRU%20Testing%20Data%2022.10.2020.pdf (2020).
stringency/low mortality). Multinomial logistic regression was used to estimate
39. TIBA Pandemic Response Unit. COVID-19 mitigation policies by
the relationship between these outcomes and the set of predictors, and the ORs
governments and changes in behaviour across WHO Africa Region. https://
and 95% CIs were calculated. Univariable models and the best multivariable
tiba-partnership.org/tiba/sites/sbsweb2.bio.ed.ac.uk.tiba/files/pdf/
model were fitted using the same approach as for the first wave mortality rate. Low
COVID-19%20mitigation%20policies%20by%20governments%20and%20
stringency/low mortality was set as the reference level. COVID-19 readiness status
changes%20in%20behaviour%20across%20WHO%20Africa%20Region.pdf
and number of borders were excluded from the model because no country in the
(2020).
low/low level had adequate COVID-19 readiness status, and there was no island
40. Hale, T., Webster, S., Petherick, A., Phillips, T. & Kira, B. Oxford COVID-19
nation in the high/high level.
Government Response Tracker. https://www.bsg.ox.ac.uk/research/
For the second wave mortality rate analysis, we fitted only the univariable
research-projects/coronavirus-government-response-tracker (2020).
model using the same approach as for first wave mortality rate. We dropped
41. Emiliano, P. C., Vivanco, M. J. F. & de Menezes, F. S. Information criteria:
predictors related to travel and readiness, given that these pre-pandemic predictors
how do they behave in different models? Comput. Stat. Data Anal. 69,
cannot represent the baseline level at the start of the second wave. We added per
141–153 (2014).
capita mortality in the first wave (Fig. 1c) and testing policy index on 1 November
42. Arsalan, M., Mubin, O., Alnajjar, F. & Alsinglawi, B. COVID-19 global risk:
2020 (Supplementary Fig. 1v) as two new predictors. Testing policy index on 1
expectation vs. reality. Int. J. Environ. Res. Public Health 17, 5592 (2020).
November 2020 entered the model as a binary predictor where ‘below 2’ was set as
43. Takahashi, T. et al. Sex differences in immune responses that underlie
the reference level. AUC of stringency in the first wave (Supplementary Fig. 1y),
COVID-19 disease outcomes. Nature 588, 315–320 (2020).
test data quality in the first wave (Supplementary Fig. 1w) and tests per capita as
44. Peckham, H. et al. Male sex identified by global COVID-19 meta-analysis as
of 31 December 2020 (Supplementary Fig. 1x) were considered as predictors of
a risk factor for death and ITU admission. Nat. Commun. 11, 6317 (2020).
second wave mortality rate, respectively.
45. Pana, T. A. et al. Country-level determinants of the severity of the first global
R version 3.6.3 (R Foundation for Statistical Computing) was used in all
wave of the COVID-19 pandemic: an ecological study. BMJ Open 11,
statistical analyses. R packages used for model fitting included survival, lme4, nnet
e042034 (2021).
and mgcv. A two-sided P value < 0.05 was regarded as statistically significant.
46. Mena, G. E. et al. Socioeconomic status determines COVID-19 incidence and
The raw African shapefile used in the study was obtained from Data and Maps for
related mortality in Santiago, Chile. Science 372, eabg5298 (2021).
ArcGIS (formerly Esri Data & Maps, https://www.arcgis.com/home/group.htm
47. Azarpazhooh, M. R. et al. COVID-19 pandemic and burden of
l?id=24838c2d95e14dd18c25e9bad55a7f82#overview) (see the permission for
non-communicable diseases: an ecological study on data of 185 countries.
use in Supplementary Table 8). Further information on predictors42–53 is given as
J. Stroke Cerebrovasc. Dis. 29, 105089 (2020).
Supplementary Information.
48. Khan, J. R., Awan, N., Islam, M. M. & Muurlink, O. Healthcare capacity,
health expenditure, and civil society as predictors of COVID-19 case
Reporting Summary. Further information on research design is available in the
fatalities: a global analysis. Front. Public Health 8, 347 (2020).
Nature Research Reporting Summary linked to this article.
49. Vadlamannati, K. C., Cooray, A. & de Soysa, I. Health-system equity,
egalitarian democracy and COVID-19 outcomes: an empirical analysis.
Data availability Scand. J. Public Health 49, 104–113 (2021).
Data on COVID-19 cases and deaths were from the WHO COVID-19 Dashboard 50. Tian, W. et al. Predictors of mortality in hospitalized COVID-19 patients: a
(https://covid19.who.int/info/). Data sources for predictors included the World systematic review and meta-analysis. J. Med. Virol. 92, 1875–1883 (2020).
Bank, the United Nations, the Rand Corporation, Our World in Data, the WHO 51. Tamuzi, J. L. et al. Implications of COVID-19 in high burden countries for
Region Office for Africa, Data and Maps for ArcGIS (formerly Esri Data & Maps), HIV/TB: a systematic review of evidence. BMC Infect. Dis. 20, 744 (2020).
Nature Medicine | www.nature.com/naturemedicineArticles NATURE MEDICInE
52. Sanyaolu, A. et al. Comorbidity and its impact on patients with COVID-19. S.H., A.M. and M.F. prepared the data. F.Z. and C.-G.G. were involved in data analysis.
SN Compr. Clin. Med. https://doi.org/10.1007/s42399-020-00363-4 (2020). H.K., N.N., M.N., S.A., G.A.A., F.M., Z.Y., J.C. and M.R.M. verified the results. F.Z. and
53. Rahman, M. et al. A global analysis on the effect of temperature, M.E.J.W. drafted the manuscript. All authors contributed to the interpretation of results
socio-economic and environmental factors on the spread and mortality rate and had final responsibility for the decision to submit for publication.
of the COVID-19 pandemic. Environ. Dev. Sustain. https://doi.org/10.1007/
s10668-020-01028-x (2020).
Competing interests
The authors declare no competing interests.
Acknowledgements
Funding support is acknowledged from the Darwin Trust of Edinburgh, received by
F.Z., and the National Institute for Health Research (NIHR) Global Health Research Additional information
Programme (16/136/33) using UK aid from the UK Government, received by M.E.J.W., Extended data is available for this paper at https://doi.org/10.1038/s41591-021-01491-7.
F.M. and G.A.A. The views expressed in this publication are those of the authors and
Supplementary information The online version contains supplementary material
are not necessarily those of the NIHR or the Department of Health and Social Care.
available at https://doi.org/10.1038/s41591-021-01491-7.
The TIBA Pandemic Response Unit is part of the Tackling Infections to Benefit Africa
partnership. We are grateful to H. Brown from the Roslin Institute, Edinburgh for Correspondence and requests for materials should be addressed to Feifei Zhang.
statistical advice. Peer review information Nature Medicine thanks Yap Boum, Charles Mgone and the
other, anonymous, reviewer(s) for their contribution to the peer review of this work.
Author contributions Jennifer Sargent was the primary editor on this article and managed its editorial process
M.R.M., M.E.J.W., Z.Y. and F.Z. conceived the study. M.E.J.W., F.Z. and M.C.-T. and peer review in collaboration with the rest of the editorial team.
contributed to the methodological design. F.Z., M.K., G.C.-G., M.M., A.H., T.W.-G., Reprints and permissions information is available at www.nature.com/reprints.
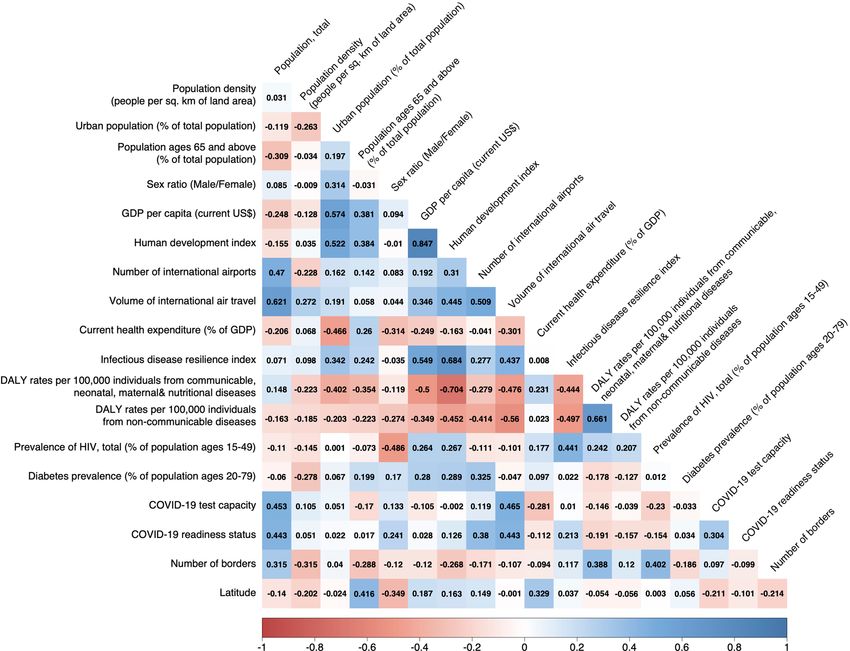
Nature Medicine | www.nature.com/naturemedicineNATURE MEDICInE Articles Extended Data Fig. 1 | Correlation matrix for predictors in the first wave. Positive correlations are displayed in blue and negative correlations in red colour. n = 47 countries. Spearman’s rank correlation test was used. Colour intensity is proportional to the correlation coefficients. Nature Medicine | www.nature.com/naturemedicine
Articles                                                                                                                       NATURE MEDICInE

Extended Data Fig. 2 | Correlation matrix for significant predictors in multivariable model for per capita mortality in the first wave and three test
variables. Positive correlations are displayed in blue and negative correlations in red colour. n = 42 countries. Spearman’s rank correlation test was used.
Colour intensity is proportional to the correlation coefficients.

                                                                                                              Nature Medicine | www.nature.com/naturemedicine
NATURE MEDICInE Articles Extended Data Fig. 3 | Risk ratios and 95% confidence intervals of three test variables for per capita mortality in the first wave in multivariable Poisson generalized linear mixed model. n = 42 countries. Error bars are shown. Statistically significant risk factors are in red. Exact two-sided P values for the Wald test are shown for each predictor, and two-sided P values < 0.05 were considered statistically significant. Nature Medicine | www.nature.com/naturemedicine
You can also read