PRELIMINARY 2020 CAPACITY PLAN - DENVER PUBLIC SCHOOLS PLANNING DEPARTMENT JANUARY 2016 - BOARDDOCS
←
→
Page content transcription
If your browser does not render page correctly, please read the page content below
Preliminary 2020 Capacity Plan

Denver Public Schools
Planning Department

January 2016
Table of Contents

   Purpose / Approach                                                       Slide 3

   Executive Summary                                                   Slides 4 – 6

   Forecasting Methodology                                            Slides 7 – 33

   Capacity Calculations & Current Utilization                       Slides 34 – 37

   Aligning Supply of Seats vs. Forecasted Enrollment Demand         Slides 38 – 89

      FNE Sub-Regions Supply / Demand Forecasts                      Slides 42 – 47

      NNE Sub-Regions Supply / Demand Forecasts                      Slides 48 – 63

      NW Sub-Regions Supply / Demand Forecasts                       Slides 64 – 69

      SE Sub-Regions Supply / Demand Forecasts                       Slides 70 – 79

      SW Sub-Regions Supply / Demand Forecasts                       Slides 80 – 89

   Aligning Supply of ECE-4 Seats vs. Supply of Kindergarten Seats   Slides 90 – 96

   Summary of Capacity Issues                                        Slides 97 – 99

                                                 2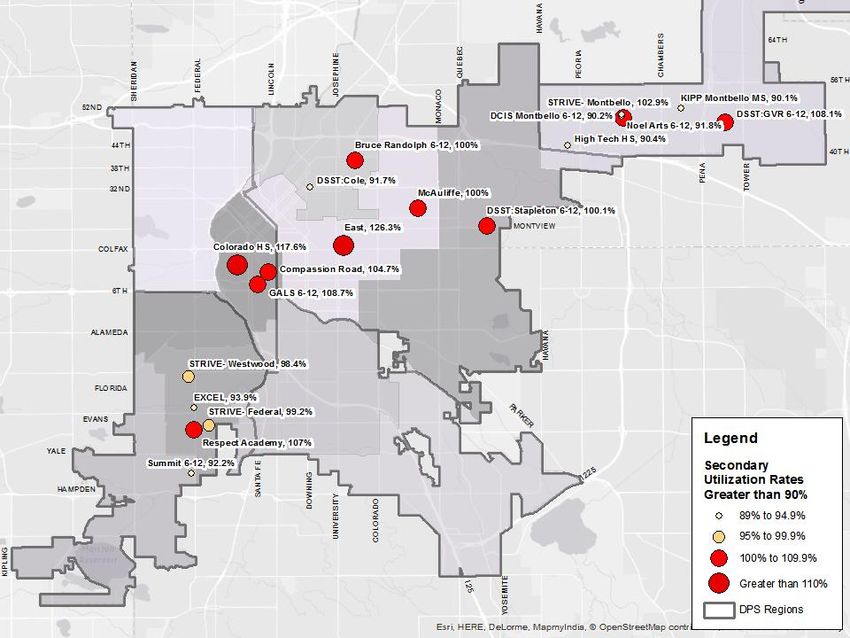
Purpose of this Document
Purpose
The overarching goal of Denver Plan 2020 is to ensure that DPS offers Great Schools in Every Neighborhood.
With resource constraints and continued growth in the city, it is critical that DPS prioritize bond construction dollars to
expand access to high quality school seats in priority regions of the city.
This preliminary 2020 capacity plan will support the 2016 Bond planning process by identifying areas of forecasted
capacity shortages and prioritizing potential investments to meet demand needs.
Signal to interested groups where need exists for new schools based on demographic growth
Approach
This document will detail the 2020 capacity plan in several areas:
Methodology for forecasting future enrollment
Current state of enrollment factors
Methodology for calculating school capacity
Sub-regional view of 2020 forecasted enrollment
Sub-regional supply vs. demand analysis
Options to increase capacity at school / sub-regional level
Prioritized list of recommended capacity solutions to meet 2020 forecasted enrollment
3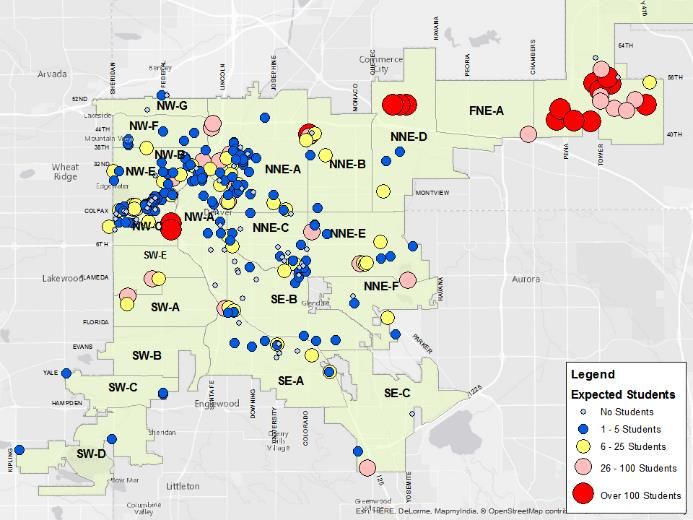
Summary of Capacity Needs & Prioritization

                    4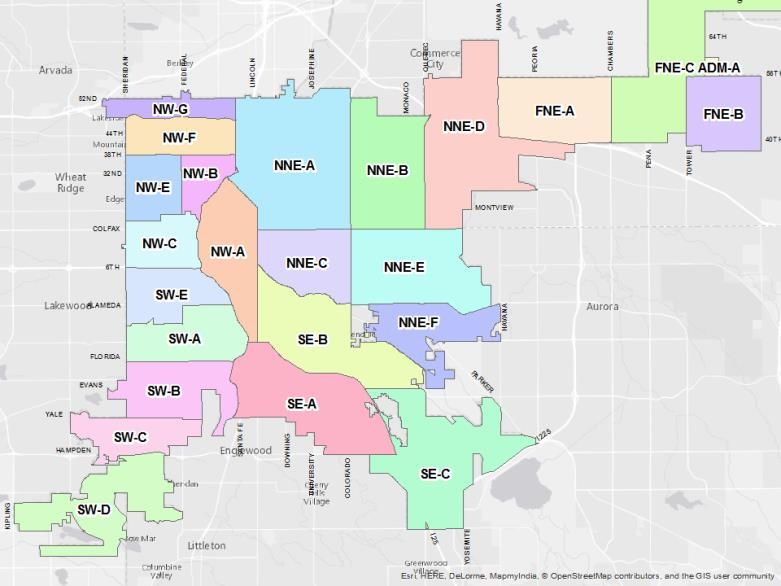
Summary of Needs/Prioritization of Projects

                                                                 Year     Seats
    Project (in the order of priority from the sub-committee)                     Priority
                                                                Needed   Needed

Elementary school seats in Gateway / Green Valley Ranch          2017     500        1

Middle school seats in Gateway / Green Valley Ranch              2017     450        1

High school seats in Gateway / Green Valley Ranch                2017     500        1

Elementary school seats in Stapleton North of I-70               2017     500        1

Elementary school seats in Stapleton North of I-70               2018     500        1

High school seats in Stapleton at the Sandoval Campus            2018     500        1

Elementary school seats in Montbello                             2018     500        2

Elementary school seats near Mayfair Park / Hale                 2018     150        2

Elementary school seats near Washington Park West                2019     100        2

ECE Center in the Far Southeast                                 ASAP      150        3

ECE Center at Place Bridge Academy                              ASAP      200        3

ECE Center at Fairview                                          ASAP      200        3

Addition at Pascual LeDoux ECE Center                           ASAP       50        3

                                  TOTAL                                  ~8,000

                                                          5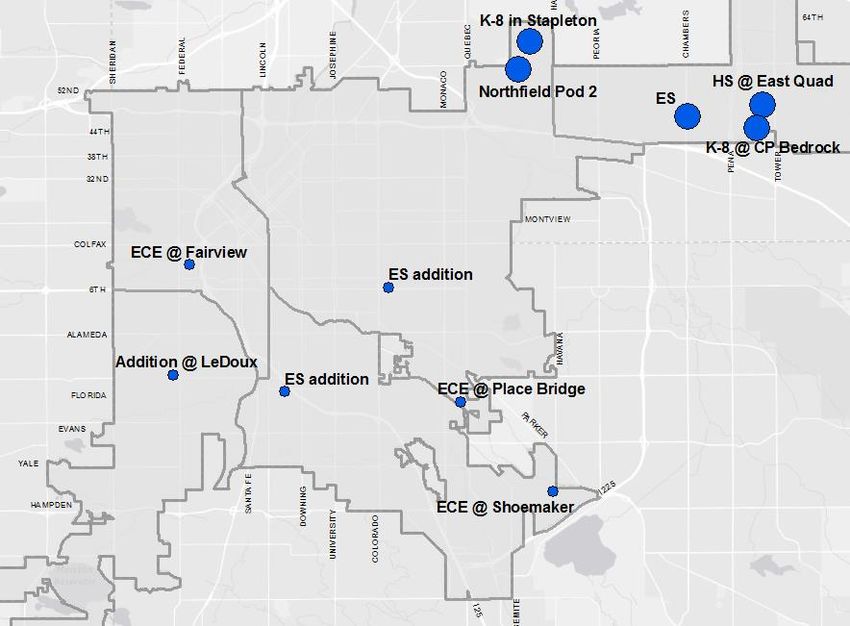
Map of High Priority Capacity Projects

                                         Estimate of > $15 Million

                                         Estimate of < $15 Million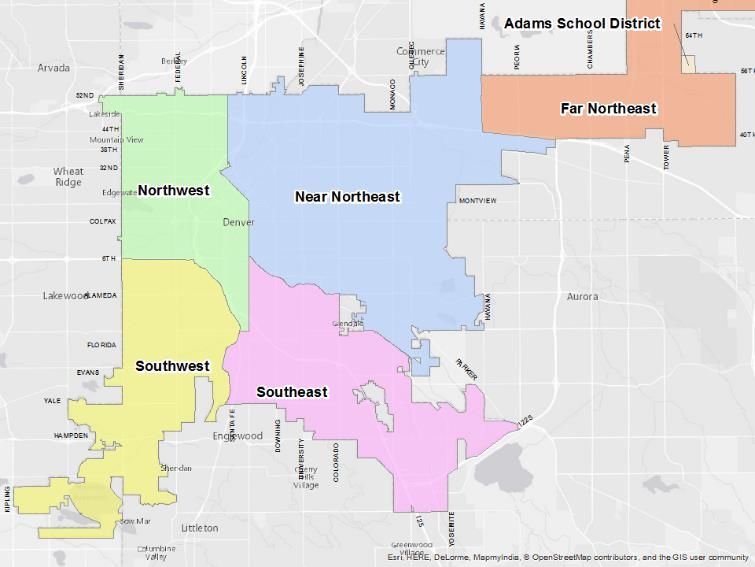
Forecasting Methodology

           7
Process for Residing Student Population Forecasting

                                                             Process

     Starting point:                                                              Adjust up/down for
                              Adjust up/down for        Adjust up/down for
 Historical enrollment                                                            cohort comparison         Final 2020 Forecast
                              enrollment trends         residential factors
   trends/averages                                                                       rates

Timing                   DPS Planning issues forecasts each spring looking out 5 years.

                         Forecasts are created by grade level by census block group. There are three grade levels that are
Forecast Level           forecasted: elementary, middle, and high school. There are 481 census block groups that are
                         forecasted for each of the grade levels.

                         The primary data points that are used for the forecast are updated each spring to incorporate the latest
Feedback Loop
                         findings.

                         This approach looks at the students residing in an area attending any DPS school, not the local
Impact of Choice
                         boundary/zone school. Choice behavior occurs outside of this forecast.

                                                                 8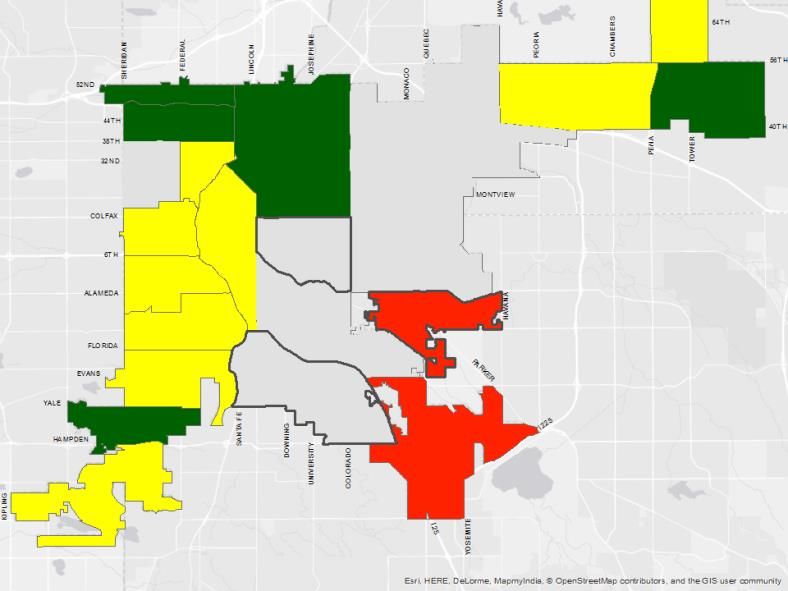
Defining the Student Population in DPS Forecasts
Residents Choice-Out to Other DPS Choice-In from Other Attendees
Schools Neighborhoods
Focus of DPS forecasts
DPS Planning forecasts the number of students who reside in a given census block group in a given year and will attend
any DPS school. This forecast is agnostic of the choice behavior of this students, meaning that whether a student decides
to attend their boundary school or choice-out to a school across town, they are counted for in the forecast.
One primary reason for not incorporating choice into a 5-year forecast is the possibility that programs or boundaries may
change between now and 5 years out. For conservatism, this approach also allows for the assumption that all students
will attend their boundary/zone school.
The forecasted population must attend a DPS school. It does not include students who may live in the area but attend
private school, another district, or are home schooled. It also does not include students living outside of Denver who may
want to choice-in to DPS.
9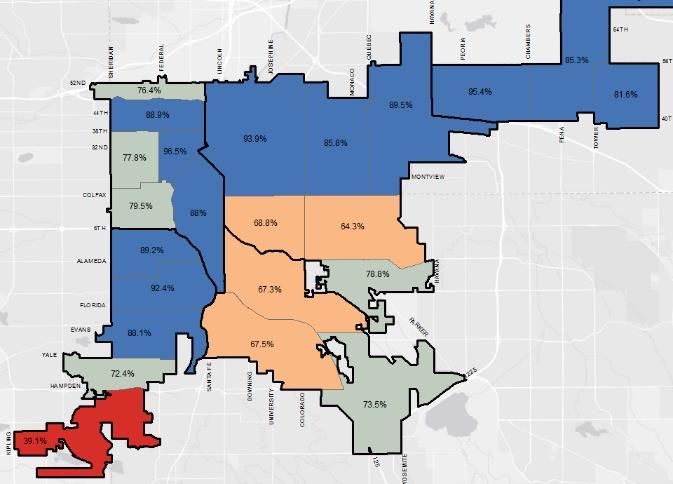
Overview of DPS Planning Regions
Regional Structure Methodology
Primarily set based on high school
feeder patterns
Also divided by major geographic
features (highways, rivers, etc.)
10Overview of DPS Planning Sub-Regions
Sub-Regional Structure Methodology
Each region is divided into several sub-
regions that tie to a set of school
boundaries or neighborhoods
This report will forecast 2020 elementary
enrollment and capacity needs at the sub-
region level
11Defining the Forecast Areas: Census Block Groups
SW062
SW055
SW067
SW063 SW054
Godsman Elementary
DPS forecasts to the Census Block Group, which are created by the U.S. Census Bureau. There are 481
block groups in the City and County of Denver. The average area for a block group in Denver is 0.32
square miles.
Rationale for Forecasting at the Census Block Group level:
Better aligns data points with US Census Bureau and private GIS / demographic data providers
More accurate due to 481 block groups as opposed to less than 100 elementary school boundaries
More flexible due to the ability to assign a block group to different elementary schools, middle schools,
and high schools
This report will forecast 2020 middle and high school enrollment and capacity by blockgroup assigned to
DPS middle and high school boundaries.
12Summary of the Approach to Forecasting
Inputs: Major Data Points
Historical October Birth Rates Capture Rates Residential Yield Rates
Count Enrollment Development
Assumptions
Cohort Comparison Future Growth Housing Impact
Resulting Forecast by Level
Block Group Boundary / Regional
13Data Sources for Major Data Points used in Forecasting
Major Data Points
Historical October Birth Rates Residential Capture Rates Yield Rates
Count Enrollment Development
Name and age of Date of birth by Permitting data for Percentage of Number of DPS
student by address latitude and every residential and student-age students per housing
by year since 2000. longitude of commercial population (5-17 unit by type:
residence for every construction project years old) residing in affordable,
Audited by the child born in the in development or Denver versus the apartment, attached,
Colorado state of Colorado by approved by the City percentage that detached
Department of birth certificate of Denver Planning attend DPS
Education Office
Source and Summary Description
14Major Data Point: DPS K-12 Students Residing in Denver
Source: Colorado Department of Education
26% Increase since 2000
79,942
73,972 76,274 78,746
67,487 69,523 71,871
63,669 63,929 65,844 66,015 65,606 64,840 64,843 64,716 65,122
2000
2001
2002
2003
2004
2005
2006
2007
2008
2009
2010
2011
2012
2013
2014
2015
Key Observations
Enrollment, regardless of place of residence, has increased 29% since 2000.
After eight years of relatively minimal growth, since 2008, DPS has added nearly 16,000 more Denver
residents as students.
15Major Data Point: Denver Birth Rates
Source: Colorado Department of Health & Human Services
Births per Year Based on Kindergarten Class
10,455
10,255
10,156 10,120
9,974
9,642
9,535
9,362
9,222 9,202
2016-17
2010-11
2011-12
2012-13
2013-14
2014-15
2015-16
2017-18
2018-19
2019-20
Kindergarten Class
Key Observations
How to read the chart: Births are shown as a five year cohort. The “2015-16” count were children born between
October 1, 2009 and September 30, 2010. This number includes any child born to a parent residing in Denver at the
time of birth, but not babies that were born to parents residing outside of the city.
Numerous national research organizations have published studies on the decline in births due to the recession.
Specifically, the Proceedings of the National Academy of Sciences, found that the recession caused births to drop by at
least half million people annually. Colorado state birth rates have declined 8.2% versus before the recession.
16Major Data Point: Capture Rates
Source: 2000 and 2010 US Census; October Count Enrollment
Capture Rate: Percentage of student-age population residing by block group that attends DPS versus other options, such as
private school, neighboring districts, or home schooling. For example, if 100 people age 5-17 reside in a given census block
group and 75 attend DPS, the capture rate is 75%. DPS relies on the census to have an accurate number of school-age
students residing in the City of Denver.
2010 K-12 Capture Rates
High rates of private school or
Capture Rate neighboring district. Potential
< 46% exists to recapture, though will
be difficult.
Capture Rate Growth potential by recapturing
46%-70% from other options.
Capture Rate Approaching the ceiling, but
71% - 80% growth opportunities remain.
Capture rates approaching or
Capture Rate
at the ceiling. Minimal further
> 81%
growth from increasing capture.
17Major Data Point: Capture Rates
Source: 2000 and 2010 US Census; October Count Enrollment
Capture rate improvements between 2000 and 2010 were greatest among middle and high schools,
which have traditionally been lower than elementary school rates
District-Wide Capture Rates Key Regional Improvements
90%
86% 2000 Southeast Region
2010 90% 2000
85% 83%
82% 85% 2010
81%
80% 80%
77%
76% 74%
75%
75% 70% 70%
72%
70%
70% 65% 61% 60%
59% 59% 58%
60%
65% 63%
55%
60% All Elementary Middle High
All Elementary Middle High
Near Northeast Northwest
90% 90%
Key Observations 85% 85%
79%
Please note that the above figures reference capture 80% 80%
rates in 2010. Based on new American Community 75% 75% 71%
Survey data, the overall DPS capture rate has 70% 70%
66%
increased another 2%. 65% 65%
60%
60% 60%
55% 55%
High School High School
- 18 -Major Data Point: Yield Rates
Approach to Translating Residential Development in Student Yield
Process
City of Denver Units are separated into DPS identifies comparable DPS applies the yield per
provides permitting single family detached, for- units. For single family unit to the number of units
information. purchase condo, for rental detached units, DPS looks by type to determine the
apartments, and affordable at neighboring homes. For total number of forecasted
housing. apartments / condos, DPS students that will result
looks at similarly priced from the development.
and sized units from
across the city.
19Major Data Point: Yield Rates
How is a student yield calculated?
Only Pre-K – 12 students attending a DPS school count towards the yield
Count in
Age # Kids
Yield?
No kids
3 year old 1 1 -
Pregnant
3rd Grader 2 1 -
Kinder 3 2 -
No kids
Pre-K 0 0
No kids 2 year old Kinder 1 1
Pregnant
1st Grader 1 1
1 year old 3rd Grader 2nd Grader 1 1
1st Grader
3rd Grader 2 2
5th Grader 6th Grader &
2nd Grader 4th Grader 1* 0
4th Grader in
3 year old Private School 5th Grader 1 1
Pregnant
6th Grader 1* 0
* Private school does not count in
DPS yield
6 DPS students
= .60 Yield
10 homes
20Major Data Point: Residential Development
Source: City of Denver Planning Office
There continues to be
high levels of
development in the city,
with Stapleton and the
FNE in particular.
Based on historic
findings, many of the
NW projects will yield
incrementally fewer
students due to
replacing existing
families and many new
residents being young
professionals or empty
nesters.
Note that “scrapes” or
“pop-tops” are not
captured in the data on
this chart due to lower
levels of data visibility.
21Major Data Point: Residential Development
Source: City of Denver Planning Office
There are two different types of residential development occurring in Denver’s housing market.
Type Location Impact on Student Enrollment
Urban Infill Stapleton, Lowry, Green High. Development is not replacing existing housing and is targeted at
Valley Ranch, Gateway younger families. Estimated 9,900 units remaining across the 4 areas.
Scrapes / Northwest Denver, City Lower. Projects sometimes replace an existing family due to housing
Pop-Tops Park North, Platt Park, price increases, which has been seen in NW Denver. SE Denver has
Baker, SW Denver, Five seen rising enrollment levels due to projects occurring on houses
Points formerly owned by empty nesters, coinciding in neighborhoods with
strong DPS schools.
22Major Data Point: Change in Home Prices
Source: City of Denver Assessor’s Office 2010 and 2015
5 Year Price Per Square Foot Change
This map shows the 5
year price per square
footage difference for
all home types. The
neighborhoods in red
are gentrifying.
Legend
Less than $25 per Square Foot
Between $25 and $100
per Square Foot
More than $100 per Square Foot
23Residential Re-Development Impact on Student Yields
One of the major impacts from gentrification is the change in housing stock. In many Denver neighborhoods, there are
numerous city blocks that have converted from single-family detached units to attached units, also known as townhomes or
condominiums.
2005 2014
Residential Units = 22 Residential Units = 48
Students Attending DPS = 13 Students Attending DPS = 4
Student Yield = 0.59 Student Yield = 0.08
24Major Data Point: Residential Development Impact on Student Yields
Source: City of Denver Planning Office; Official October Count Enrollment
Student Yields: Single Family Detached
1.00
0.90 0.83
0.80
0.80 0.74
0.70
0.64 0.78 0.80
0.70
0.58 0.69
0.60 0.53 0.54
0.50
0.50 0.41 0.42 0.43 0.43
0.40
0.36 0.36
0.40
0.30
0.28
0.20 0.25
0.10
0.00
2009 2010 2011 2012 2013 2014 2015
Stapleton Green Valley Ranch Denver
In planning seats, DPS projects Stapleton and Green Valley Ranch single-family yields 20-40% higher than Highlands
Ranch and other family-targeted neighborhoods, which is an aggressive assumption.
For Denver County the student yield for all single family detached residential units is 0.43. Yield data for Stapleton
and Green Valley Ranch has been nearly double that rate.
While DPS-wide 84% of school-age population attends DPS, roughly 87% of Stapleton-area elementary children
attended DPS schools. This contrasts with other affluent communities such as Cory Merrill, where the capture rate
across grades is as low as 63%.Major Data Point: Impact of Housing Prices on Student Yield Rates
Source: City of Denver; Geo-coded October Count
Housing prices in Denver have experienced among the highest % increases in the country over the past few years.
Between July 2014 and July 2015, Colorado’s home prices increased 10.4%, the second highest in the country. For
several neighborhoods in particular that have experienced large housing price increases, DPS Planning adjusts yield
assumptions to guide enrollment forecasts.
Yield (#
Sales Price Units in Price Yield (# New Units
Students per
Group Group Unit Type Students per Planned or in
unit)
unit) Construction
Less than
0.50 4,260
$200,000 Affordable 0.33 1,020
$200,000 to
0.21 7,442 Apartments 0.07 17,051
$349,999
$350,000 to Condominiums 0.07 11,389
0.15 4,857
$499,999
$500,000 to Townhomes 0.16 3,357
0.23 2,281
$649,999
Single Family
$650,000 to 0.43 5,376
0.27 942 Detached
$799,999
Greater than
0.28 1,178
$800,000
As home prices move up the student yield drops by
half. The bounce back in the $500,000 and above is
due to Stapleton, which has a large share of homes
sold at these price points and have the highest yields in
the metro area.
26Summary of Impacts on Enrollment Forecast
Inputs: Major Data Points
Historical October Birth Rates Residential Capture Rates Yield Rates
Count Enrollment Development
High enrollment Declining birth rates Different types of Increased Increasing home
growth at all levels across the city point gentrification of older performance of DPS, prices are leading to
but recent decline in to elementary neighborhoods has including secondary lower yield rates.
kindergarten point enrollment declines historically led to schools has led to This is being partially
towards flat starting in 2014 with declining rates of increasing rates of off-set by empty
enrollment levels in possible MS declines students. City student-age nester families
many neighborhoods by 2020. permitting shows population attending moving out of the
through 2020 more conversions DPS. area being replaced
are planned. by younger families.
Overall
School performance is attracting more families to attend DPS, particularly due to secondary school
strengthening. However, residential cost increases, shrinking birth rates, and conversion of housing to
units with lower student yields is likely to result in minimal growth over the forecast horizon.
Suggests enrollment decreases Suggests minimal
27 increases Suggests enrollment increasesAssumptions Used to Forecast Enrollment
Data Points
Cohort Comparison Future Growth Housing Impact
Is performance of one (Pulled in from the (Pulled in from the
grade level improving vis- previous section) previous section)
à-vis another? For
instance, were families Is elementary Is the housing stock
previously leaving DPS enrollment changing? Is
because of lower increasing, leading to housing more
performance, but now are larger future designed for younger
staying? cohorts? families than older
ones due to smaller
square footage?
Insights Guiding Assumptions
28Assumptions: Age of City & County of Denver Population City Wide
Source: 2015 Data from Colorado State Demographer’s Office
As data from the State of Colorado Demographer’s Office shows, there are declines in the number of children residing in
Denver as they age. Increases do not happen until students hit 18+ due to college and other post-K-12 opportunities.
29Assumptions: Housing Impact & Economic Growth
Source: Denver Business Journal, Denver Post, Money Magazine, Mortgage
Professional America, 9News
302020 District-Wide Forecast: Overview of Growth Factors
Factor Growth Comments
High Residential Construction The are still 9,000+ residential units planned for
Neighborhoods (Stapleton, Stapleton, Lowry, and GVR/Gateway. 5,000 of
Green Valley Ranch, Lowry) which are single-family detached.
There are 20,000 residential units planned for
Denver, outside the three aforementioned
Other Residential Development
developments. However, only 300 are single-family
detached. See slide 21 for map
Over the last five years the total number of births
Birth Rates
dropped from 10,455 to 9,642 per year.
Capture rates have reached a ceiling in elementary
school. Still small gains projected for Middle and
Capture Rates
High schools. See slide 17 for the 2010 Capture
Rate Map.
Gentrification is the biggest downward pressure on
Gentrification future enrollment growth. Discussed in more detail
starting on slide 22.
Likely to drive further Minimal enrollment May reduce
enrollment growth growth expected enrollment levels
31Resulting Forecast: Guide to Forecast Calculation Process and Worksheet
Starting point:
Adjust up/down for Adjust up/down for Adjust up/down for
Historical MS
elementary residential factors cohort comparison Final 2020 Forecast
enrollment trends /
enrollment trends (previous section) rate of ES : MS
averages
# of MS Students Residing Average Reside
MS : ES 2014 ES 2020 MS 2020 MS
Census Block
2000 2010 2011 2012 2013 2014 5-Year 3-Year Ratio Growth Forecast :ES Ratio
080310154003 16 10 14 16 17 17 15 17 31% 21 19 38%
080310005011 17 17 15 10 9 13 13 11 10% 5 18 20%
080310005024 42 31 41 38 44 38 38 40 97% 4 34 97%
080310154001 7 19 18 16 13 12 16 14 35% 14 15 31%
080310003021 11 5 10 10 13 10 10 11 22% -4 11 23%
080310003024 7 11 6 6 8 9 8 8 35% -3 8 30%
US Census Block October Count enrollment for reside 3 and 5-year averages 2014 Growth for 2020 Ratio of
Group Code and attend any DPS school of reside counts ES MS students to
ES
Ratio of MS students to ES
Resulting 2020
Forecast for MS reside
attending any DPS school
32Resulting Forecast: Mapping Census Block Forecasts to School / Regional
Levels
DPS DPS Planning ES Boundary MS Boundary HS Boundary
Census Block Planning Sub-Region
Region
080310154003 NW NW-G Centennial Skinner North HS
080310005011 NW NW-E Brown Skinner North HS
080310005024 NW NW-E Brown Skinner North HS
080310154001 NW NW-G Centennial Skinner North HS
080310003021 NW NW-E Edison Skinner North HS
080310003024 NW NW-E Edison Skinner North HS
Each of the 480 census block groups within the City and
County of Denver are geocoded to one or more elementary
schools, middle schools, and high schools.
DPS Planning is able to combine the blocks based on the
education level that is being forecasted
33Capacity Calculations & Current Utilization
34Capacity Calculation Methodology
Counted all Teaching Stations (TS) within each school. A Teaching Station is any space 585 square feet
or larger in which instruction can occur (with some exceptions).
Number of Teaching Stations X 25 students = Capacity
Capacity calculation of a facility identifies the optimum number of students that the building should hold.
Capacity figure does not take into account the exact program being offered in the facility, so it has to be
considered an estimate.
DPS has schools that operate above capacity and others that struggle to operate at 80% of capacity due
to differences in program model, staffing, class size, etc. all impact the way a school fits in the building.
- 35 -DPS Elementary & K-8 Schools with Utilization Rates Above 90%
36DPS Secondary Schools with Utilization Rates Above 90%
37Aligning Supply of Seats vs. Forecasted
Enrollment Demand
38Comparison of Forecasted Enrollment Demand vs. Supply of Seats
For each sub-region at the elementary level, 2020
forecasted demand is compared to 2020 planned
capacity to determine any excess or shortage of seats.
For each sub-region combined to middle and high school
boundaries, 2020 forecasted demand is compared to
2020 planned capacity to determine any excess or
shortage of seats.
Boundary and zone schools are included in capacity,
while city-wide options like DSA or GALS are excluded
because they serve a broad geographic area.
Enrollment Demand Supply of Seats
+ = +
2015
2015 Growth 2020 Current Planned
Actuals Factors Forecast Capacity Capacity
39Since the 2012 bond, DPS has added 1,000 more students than seats
E-12 Enrollment Key Observations
91,429
The 2012 Bond program invested close to $200
90,150 million in added capacity, totaling roughly 6,000
seats.
87,398 Over the same time frame, DPS enrollment has
increased by 7,000 additional ECE-12 students.
84,424 DPS has increased capacity in a cost-effective
manner. This includes reopening schools that
were formerly closed, sharing campuses to
maximize the capacity utilization in some areas,
and investing in smaller expansions of existing
sites as opposed to entirely new facilities.
2012 2013 2014 2015
DPS has also invested mill levy funding in
community partners to expand pre-school
offerings, particularly in areas where there is
minimal DPS capacity to expand classes.
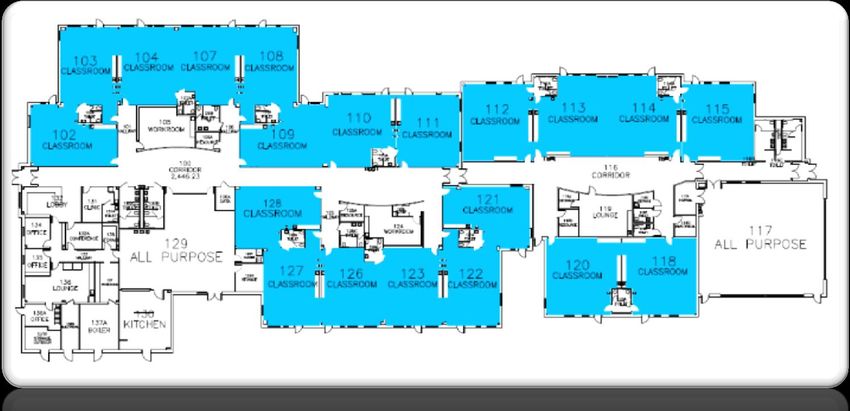
- 40 -Wide use of shared campuses has provided options close to where need is,
and significantly increased utilization of existing facilities at a low cost.
- 41 -Sub-Regions Supply / Demand Forecasts
Far Northeast
Near Northeast
Northwest
Southeast
Southwest
422020 FNE-A Elementary School Forecast
Forecast & Capacity Comparison
7,000 FNE-A
6,030 5,791
6,000 5,785
5,000
4,000
3,000
2,000
1,000
239
0
2015 2020 2015 Remaining
Students Forecast Capacity Need
Observations
Currently Montbello has the largest class sizes in the district, with some grades above 28 students per room.
Additionally, there are more students overflowed between FNE elementary schools than anywhere else in DPS.
There is additional development scheduled to be completed in the eastern portion of FNE-A, by 2020 and DPS Planning
is forecasting an additional 245 students will be generated from this new housing.
A new elementary school will be needed in the sub-region, targeting the eastern portion of this sub-region, closer to
Pena Boulevard.
Forecast: Capacity needed
432020 FNE-B Elementary School Forecast
Forecast & Capacity Comparison
4,500 FNE-B
4,034 3,654
4,000
3,500
3,127
3,000
2,500
2,000
1,500
1,000
500 380
0
2015 2020 2015 Remaining
Students Forecast Capacity Need
Observations
Along with Montbello, Green Valley / Gateway has the largest elementary class sizes in DPS.
Residential development in the sub-region is forecasted to yield 907 more elementary students by 2020.
A new elementary school will be needed in the area because schools are already at or near capacity and will not be
able to accommodate the forecasted number of students.
Forecast: Capacity needed
442020 FNE Middle School Forecast
Forecast & Capacity Comparison
5000
4500 4,389 3,927
3,967
4000
3500
3000
2500
2000
1500
1000
462
500
0
2015 2020 2015 Remaining
Students Forecast Capacity Need
Observations
Currently FNE MS are operated at 99% capacity, creating large class sizes and a lack of scheduling flexibility to utilize
shared spaces and have optimal grade sizes.
Similar to elementary, residential growth in the Gateway and Green Valley Ranch neighborhoods along with the
matriculation of larger elementary schools to middle school will increase forecasted enrollment by 422 students by 2020.
Although the Evie Denis campus and East Quad campus have been able to support recent growth, a middle school will
be needed east of Peña Boulevard to support future residential growth.
Forecast: Capacity needed
45Far Northeast High School Context Setting: Number of FNE students choosing
FNE schools or staying in district is increasing
9th Grade Enrollment in FNE High Schools
1,120
1,061
1,049
943
2012 2013 2014 2015
Improved options in Far Northeast Denver has led to a higher % of students attending DPS and in particular, a high
school in the Far Northeast. A a result, 9th grade FNE enrollment has increased 19% since 2012.
The HS capture rate in 2010 was 78%, which DPS Planning believes to have increased and will continue to increase due
to improved options in the region.
Three additional programs opened in 2015 or 2016: KIPP FNE HS, STRIVE Prep – RISE HS, and Legacy Options, will
further increase capture rates and lead to further enrollment increases in the region.
462020 FNE High School Forecast
Forecast & Capacity Comparison
6000
5,399 4,806
5000 4,686
4000
3000
2000
1000 593
0
2015 2020 2015 Remaining
Students Forecast Capacity Need
Observations
FNE high schools are operating at a high capacity utilization rate as a result of increased % of students attending a
regional school as opposed to leaving the district or choicing-in to other regions of DPS.
As the larger elementary and middle school cohorts matriculate, the high school population is forecasted to increase by
713 students.
A new high school will be needed on the Green Valley Ranch side of the enrollment zone in 2017 to support growth.
Forecast: Capacity needed
47Sub-Regions Supply / Demand Forecasts
Far Northeast
Near Northeast
Northwest
Southeast
Southwest
482020 Elementary School Forecast: Enrollment likely to remain flat
Forecast & Capacity Comparison
5,000 4,710 NNE-A
4,000 3,856 3,937
3,000
2,000
1,000
-773
0
2015 2020 2015 Remaining
-1,000 Students Forecast Capacity Need
-2,000
Observations
Minimal forecasted growth due to the gentrification of several neighborhoods in NNE-A.
Thousands of housing units are being constructed in the River North area and will continue along Brighton Boulevard as
part of the future National Western redevelopment. Based on similar units built over the past few years, these will
generate a relatively low number of students.
Barrett Elementary will close at the end of the 2015-16 school year due to low enrollment. There will continue to be
excess capacity forecasted in this area through 2020.
Forecast: Capacity not needed
492020 Elementary School Forecast: Enrollment will remain steady
Forecast & Capacity Comparison
3,000 NNE-B
2,578
2,500
2,196 2,179
2,000
1,500
1,000
500
-399
0
2015 2020 2015 Remaining
-500 Students Forecast Capacity Need
-1,000
Observations
Housing price increases have led to declining enrollment in many parts of Park Hill for elementary grades.
As a result of assumed further housing price increases, enrollment is forecasted to remain flat in the area through 2020.
Currently there is excess capacity in the area, and the opening of ROOTS Elementary in 2015 furthers the amount of
excess capacity.
Forecast: Capacity not needed
502020 Elementary School Forecast: Enrollment will remain flat
Forecast & Capacity Comparison
1,200 1,093 NNE-C
1,000 977 951
800
600
400
200
-142
0
2015 2020 2015 Remaining
-200 Students Forecast Capacity Need
-400
Observations
Due to higher-end residential development that yields fewer students, DPS expects student population in the Capitol
Hill/Cherry Creek neighborhoods to decrease.
With the recent renovations at Bromwell, there will not be a need for additional capacity by 2020.
Forecast: Capacity not needed
512020 Elementary School Forecast: High growth expected north of I-70 as rest of
Stapleton development is completed
Forecast & Capacity Comparison
4,000 3,752 2,891 NNE-D
3,500
3,138
3,000
2,500
2,000
1,500
1,000 861
500
0
2015 2020 2015 Remaining
Students Forecast Capacity Need
Observations
Stapleton has been DPS’s fastest growing neighborhood over the past 10 years. As mentioned previously in this report,
the number of students that are yielded from a home in Stapleton exceed that of any other neighborhood in the district.
Going forward, there are 4,700 additional housing units to be constructed in Stapleton by 2022, yielding an additional
2,300 students. Most of that development will occur north of I-70.
Inspire Elementary will open in 2016 and be seeded at the Sandoval campus. An additional elementary school will be
needed north of I-70 in 2018 (see details on ensuing slides).
Forecast: Capacity needed
52Context Setting: Historic and Forecasted Stapleton Elementary Enrollment and
Capacity
4500
4000
3500
3000 1,326
903 1,155
282 403 615
2500 107
8
2000
1500
2,452 2,479 2,437 2,384 2,342 2,299
1000 2,221 2,236
1,937
1,665
1,160 1,345
500
0
2009 2010 2011 2012 2013 2014 2015 2016 2017 2018 2019 2020
South of I-70 North of I-70 Capacity
Due to the construction of nearly 500 homes per year in the neighborhood, DPS has opened a new elementary
school every two years to meet enrollment needs.
In 2016, Inspire Elementary will open. DPS Planning forecasts an additional elementary school will also need to be
opened in 2018 to meet continued needs. An 8 th elementary school is likely needed in 2021 or 2022, though the
timing of that capacity need is likely to be outside the range of the forecast used in this report.
532020 Elementary School Forecast: Moderate growth expected near Buckley
Annex
Forecast & Capacity Comparison
3,000
2,465
NNE-E
2,527
2,500
2,164
2,000
1,500
1,000
500
62
0
2015 2020 2015 Remaining
Students Forecast Capacity Need
Observations
The forecasted elementary growth of 363 elementary students in NNE-E is due primarily to the development of Buckley
Annex and the former CU Denver Health Center at 9th and Colorado.
Utilization rates for elementary schools in this sub-region will remain high through 2020 due to low choice-out rates from
high-performing schools.
100-125 seats in this neighborhood will relieve classroom constraints.
Forecast: Capacity needed
542020 Elementary School Forecast: Enrollment will remain flat
Forecast & Capacity Comparison
1,800
1,622 1,588 1,387 NNE-F
1,600
1,400
1,200
1,000
800
600
400
201
200
0
2015 2020 2015 Remaining
Students Forecast Capacity Need
Observations
DPS expects the student population in the NNE-F sub-region to remain flat through 2020.
An elementary newcomer center opened at Isabella Bird Community School in 2015-16 in an effort to reduce
overcrowding at Place Bridge Academy’s newcomer center.
See slide 90 for recommendations on a new ECE center in this neighborhood.
Forecast: Capacity needed
552020 Middle School Forecast: High growth north of I-70 in Stapleton will drive
growth in the Greater Park Hill Stapleton Enrollment Zone
Forecast & Capacity Comparison
2500
2,294 2,035
2000 1,816
1500
1000
500
259
0
2015 2020 2015 Remaining
Students Forecast Capacity Need
Observations
As matriculation of larger elementary cohorts to middle school occurs along with future growth from residential
development continuing north of I-70, the forecasted population is expected to increase by 478 students.
In order to accommodate the future growth, a new middle school may be needed or an expansion of an existing facility
in the zone may be needed to meet growth.
Note that in October 2015, 130 MS students from the zone attended nearby options Odyssey or DSA.
Forecast: Capacity needed
562020 Middle School Forecast: Population will remain flat
Forecast & Capacity Comparison
1200
1,036
1000
800
600
400 330 308
200
0
-200 2015 2020 2015 Remaining
Students Forecast Capacity Need
-400
-600
-800 -728
-1000
Observations
Higher housing costs in Capitol Hill, Congress Park, and Cherry Creek neighborhoods have caused student population
residing in the area to fall in recent years. DPS Planning does not expect the student population to recover.
Forecast: Capacity not needed
572020 Middle School Forecast: Growth will remain flat
Forecast & Capacity Comparison
2000
1,609
1500
1,292 1,300
1000
500
-309
0
2015 2020 2015 Remaining
Students Forecast Capacity Need
-500
Observations
The middle school population in the Near Northeast Middle School Enrollment Zone will remain flat.
With the introduction of McAuliffe II at Manual, there will not be a need for additional middle school capacity in the area.
Forecast: Capacity not needed
582020 Middle School Forecast: Moderate growth expected from the Lowry
neighborhood
Forecast & Capacity Comparison
1800 1,654 1,533
1600 1,541
1400
1200
1000
800
600
400
200 121
0
2015 2020 2015 Remaining
Students Forecast Capacity Need
Observations
As the elementary population matriculates and new residential development is completed in the Lowry neighborhood,
the middle school population is forecasted to increase by 113 students.
Capacity at the middle school grades will remain tight, but does not include regional options like DLS or DSA.
43% of students that live in the Hill, Denver Green, and Place boundaries choice-out to other middle schools. There is a
26% choice-in rate from outside of these boundaries to the three schools, which results in a net choice-out rate of 17%
or 260 students.
Forecast: Monitor Capacity
592020 High School Forecast: Modest growth
Forecast & Capacity Comparison
2500
2,269
2000 1,957
1,864
1500
1000
500
0 -312
2015 2020 2015 Remaining
Students Forecast Capacity Need
-500
Observations
The high school population is forecasted to increase by a modest 93 students, or 5%, in the East High School
boundary.
Currently East has nearly 1,200 seats available for choice-in. Any further growth in the boundary will allow for East to
maintain their program size without any further capacity risks.
Forecast: Capacity not needed
602020 High School Forecast: Growth will remain flat through 2020
Forecast & Capacity Comparison
2000 1,860
1500 1,326 1,321
1000
500
-539
0
2015 2020 2015 Remaining
Students Forecast Capacity Need
-500
-1000
Observations
The Manual High School boundary population in 2020 is expected to remain steady with no new capacity needed.
A new middle school will be introduced in the area at Manual HS to create a high-performing feeder to Manual.
Forecast: Capacity not needed
612020 High School Forecast: High growth in Stapleton-area
Forecast & Capacity Comparison
1400
1,204 1,053
1200
1000
800
681
600
400
200 151
0
2015 2020 2015 Remaining
Students Forecast Capacity Need
Observations
Forecasted population in the Northfield High School boundary is expected to increase by 523 students as Stapleton
area students matriculate to older grades and more residential development is completed.
An additional 500 seats will be needed at the Sandoval campus to support the build-out of Northfield HS and to meet
growing boundary enrollment needs from the Stapleton development.
As highlighted earlier, roughly 50% of seats at Northfield are serving FNE students. Since there is a 2020 forecasted
deficit of 593 seats in FNE by 2020, this Sandoval expansion will further allow Northfield to serve FNE students.
Forecast: Capacity needed
622020 High School Forecast: Moderate growth
Forecast & Capacity Comparison
2500
2,082
2000 1,871
1,718
1500
1000
500
-211
0
2015 2020 2015 Remaining
Students Forecast Capacity Need
-500
Observations
The George Washington High School boundary is forecasted to increase by 153 students, or 9%, due to residential
development and the matriculation of the student population in the Lowry neighborhood.
There is adequate capacity at GW to support this growth.
Forecast: Capacity not needed
63Sub-Regions Supply / Demand Forecasts
Far Northeast
Near Northeast
Northwest
Southeast
Southwest
642020 Elementary School Forecast: Enrollment will remain steady
Forecast & Capacity Comparison
1,400 NW-A
1,200
1,200
1,000
758 765
800
600
400
200
0
2015 2020 2015 Remaining
-200
Students Forecast Capacity Need
-400
-435
-600
Observations
Although there are almost 5,000 residential units planned in the area, a majority of the projects are high-end
condominium and apartment buildings. When looking at similar units in the area, these projects have led to low student
yields. It is anticipated that the 5,000 new units will yield roughly 100 additional students.
Existing capacity at area schools is adequate enough that if student yields were much higher, there would be available
space for all incremental students.
Forecast: Capacity not needed
652020 Elementary School Forecast: As gentrification continues, student
population growth will remain flat
Forecast & Capacity Comparison
10,000 NW-B
To G
8,000 7,525
6,000 5,249 5,225
4,000
2,000
0
2015 2020 2015 Remaining
-2,000 Students Forecast Capacity Need
-2,300
-4,000
Observations
The gentrification of the Highlands neighborhood that has spread throughout the Northwest region has driven out low-
income families for higher-income families moving into higher-end units. In 2015, NW elementary enrollment declined
by 4.4%, or 209 students.
Further declines are possible due to continued development, housing price increases, and declining birth rates.
Redevelopment in the Sun Valley neighborhood will be offset by declining enrollment in other neighborhoods of NW-C.
Forecast: Capacity not needed
662020 Middle School Forecast: Changes in housing stock will cause growth to
remain flat
Forecast & Capacity Comparison
1600
1,389
1400
1200 1,100
1,057
1000
800
600
400
200
-289
0
2015 2020 2015 Remaining
-200
Students Forecast Capacity Need
-400
Observations
In the Northwest Middle School Enrollment Zone, the population is forecasted to show minimal growth after declining by
1.3% from 2014 to 2015.
Similar to elementary schools in the area, housing prices and housing stock changes in the area may flatten potential
growth. If enrollment does exceed the forecast, there is forecasted 26% excess capacity in the area in 2020.
Forecast: Capacity not needed
672020 Middle School Forecast: Population declines due to changing housing
stock
Forecast & Capacity Comparison
1200
1,030
1000
891
822
800
600
400
200
-208
0
2015 2020 2015 Remaining
-200 Students Forecast Capacity Need
-400
Observations
Forecasted enrollment at the middle school level is expected to remain flat due to changes in housing stock along with
housing price increases.
If enrollment levels were to exceed forecasted levels, there is still 30%+ excess capacity at the Lake Campus to support
the increased enrollment.
Forecast: Capacity not needed
682020 High School Forecast: Enrollment will remain steady through 2020
Forecast & Capacity Comparison
3000
2,506
2500
1,994 1,958
2000
1500
1000
500
0
2015 2020 2015 Remaining
-500 Students Forecast Capacity Need
-548
-1000
Observations
Population in the North High School boundary is forecasted to remain relatively steady through 2020.
North HS, Strive, and CEC will have enough capacity to support the area even if actual enrollment exceeds the
forecast.
Forecast: Capacity not needed
69Sub-Regions Supply / Demand Forecasts
Far Northeast
Near Northeast
Northwest
Southeast
Southwest
702020 Elementary School Forecast: Enrollment will remain steady
Forecast & Capacity Comparison
2,000 1,875 SE-A
1,589 1,585
1,500
1,000
500
-290
0
2015 2020 2015 Remaining
Students Forecast Capacity Need
-500
Observations
SE-A has recently experienced growth from the redevelopment of older, smaller homes into larger homes as well as
very strong performance from area schools. Several schools in the area have large class sizes made up entirely of
boundary students.
Looking forward, growth rates are expected to slow due to birth rate declines and high capture rates.
Capacity should be closely monitored. If housing stock changes continue or birth rate impacts are not felt due to
housing turnover to younger families, then capacity may need to be added.
Forecast: Monitor Capacity
712020 Elementary School Forecast: Enrollment will remain steady
Forecast & Capacity Comparison
2,500 2,321 SE-B
2,000 1,912 1,903
1,500
1,000
500
-418
0
2015 2020 2015 Remaining
-500 Students Forecast Capacity Need
-1,000
Observations
The percentage of student-age population attending DPS is likely at a ceiling given private options available.
Enrollment growth is forecasted to remain steady in the sub-region with available capacity to support any increases that
may exceed forecasted levels.
Forecast: Capacity not needed
722020 Elementary School Forecast: Growth will remain flat
Forecast & Capacity Comparison
3,000 SE-C
2,613 2,680 2,507
2,500
2,000
1,500
1,000
500
173
0
2015 2020 2015 Remaining
Students Forecast Capacity Need
Observations
Joe Shoemaker school opened in 2015 to address over-crowding at Holm and Samuels.
This sub-region has among the highest mobility rates in the city, which causes enrollment challenges in the area due to
the TNLI models and large class sizes at area schools.
One option to address over-capacity would be to build additional ECE capacity at the Shoemaker campus to serve area
students and relieve facility pressure on Holm and Samuels. See slide 89 for more details on ECE shortages in the
area.
Forecast: Capacity needed
732020 Middle School Forecast: Enrollment will remain steady
Forecast & Capacity Comparison
700
583 600
600 562
500
400
300
200
100
-17
0
2015 2020 2015 Remaining
-100 Students Forecast Capacity Need
Observations
Minimal forecasted growth, but capacity will be monitored through the availability of non-boundary seat offers in the
SchoolChoice process. New development at the former Gates rubber site may result in additional students.
Choice-out rates are expected to remain high for students living in the western portion of the Grant boundary due to the
proximity to new high performing options in the West and Southwest Enrollment Zones.
The current choice-out rate for 6th graders living in the Grant boundary is 59% and the choice-in rate for 6th graders to
Grant Beacon is 37%, which results in a net choice-out rate of 22%.
Forecast: Monitor Capacity
742020 Middle School Forecast: Growth will remain flat through 2020
Forecast & Capacity Comparison
1400
1,225
1200
1,005
1000 947
800
600
400
200
-220
0
2015 2020 2015 Remaining
-200 Students Forecast Capacity Need
-400
Observations
Growth in the Hamilton boundary will be primarily fueled by an aging student population and a slight increase in capture
rates.
In addition to Hamilton, Highline Academy SE K-8 has additional middle school capacity that serves this area, though
there are very few options beyond these for far SE residents.
Hamilton MS is projected to enroll 993 students in 2016, which would be the largest MS in the district and would create
very tight capacity for the school. Monitor further growth to ensure choices as well as adequate capacity.
Forecast: Monitor Capacity
752020 Middle School Forecast: Population will remain steady
Forecast & Capacity Comparison
1200
1,100
1000
800 717 773
600
400
200
-327
0
2015 2020 2015 Remaining
-200 Students Forecast Capacity Need
-400
Observations
The middle school population is forecasted to increase by 56 students due to changes in housing stock in the University
Hills neighborhood and increased capture rates with improved performance at Merrill.
With three middle school programs in the area along with regional options, no extra capacity will be needed by 2020.
Forecast: Capacity not needed
762020 High School Forecast: Population will remain steady
Forecast & Capacity Comparison
2000
1,755
1500
1000 818 818
500
0
2015 2020 2015 Remaining
-500 Students Forecast Capacity Need
-1000
-937
-1500
Observations
South High School has the smallest boundary enrollment of any DPS high school. The popularity of South has led to
high choice-in rates from other areas in the city.
Boundary population is expected to remain relatively flat through 2020 and any growth that exceeds the forecast would
easily be served at area options.
Forecast: Capacity not needed
772020 High School Forecast: Modest population growth
Forecast & Capacity Comparison
2000
1,684
1500 1,411
1,288
1000
500
-273
0
2015 2020 2015 Remaining
Students Forecast Capacity Need
-500
Observations
Boundary population in the Thomas Jefferson High School boundary is forecasted to grow by 10% by 2020.
The primary drivers of enrollment are the matriculation of larger elementary and middle school grades along with
increased capture rates of residents attending TJ.
There is adequate capacity at TJ to handle the forecasted growth, though there are no other DPS options in this part of
the city for residents.
Forecast: Capacity not needed
78Off-Track Segments: SE off-track students lack Pathway options in their region
2015 SE Students by Segment
Number of
Segment
Students
9th – Slightly off track 174
9th – Far off track 58
9th / 10th – Far off track 19
11th / 12th – Slightly off track 170
11th / 12th – Far off track 65
Total Off-Track 486
* Please see Appendix for segment
explanation
Observations
Due to limited school options in the SE, most students attend either GW, TJ, or South HS, all schools with more than
1,000 students. In those schools, 486 students residing in SE Denver are off-track for graduation and may be better
served in an alternative pathway school.
There are currently no programs in the SE to serve off-track students, with students being forced to travel near
downtown to access a pathway program
A pathways program is needed to serve area residents, and capacity would be needed to house the program.
Forecast: Capacity needed
79Sub-Regions Supply / Demand Forecasts
Far Northeast
Near Northeast
Northwest
Southeast
Southwest
802020 Elementary School Forecast: Flat enrollment, but tight capacity
Forecast & Capacity Comparison
7,000
6,387 6,393 6,456
6,000
5,000
4,000
3,000
2,000
1,000
-63
0 SW-A
2015 2020 2015 Remaining
-1,000 Students Forecast Capacity Need and E
Observations
As housing prices increase in the area, there is evidence that enrollment may decline as families are relocating out of
the area, supported by a 2015 decline of 205 students versus 2014. This combined with lower birth rates, is driving a
forecast of flat enrollment through 2020.
One development to monitor is the redevelopment of the Westwood neighborhood that has the potential to cause
fluctuations in enrollment as families are temporarily relocated.
Monitor enrollment levels in the area since current capacity is among the tightest in the city.
Forecast: Monitor Capacity
812020 Elementary School Forecast: Enrollment will remain steady
Forecast & Capacity Comparison
6,000 SW- B
5,011 and C
5,000 4,538 4,524
4,000
3,000
2,000
1,000
-487
0
2015 2020 2015 Remaining
-1,000 Students Forecast Capacity Need
Observations
Enrollment has declined in these neighborhoods due to affordability of housing.
From the 2014-15 school year to the 2015-16 school year, the number of elementary age students residing in the area
decreased by 81 students.
Going forward, enrollment is forecasted to remain relatively flat. If enrollment exceeded the forecast, there is close to
500 seats of excess capacity in the area.
Forecast: Capacity not needed
822020 Elementary School Forecast: Enrollment will remain steady
Forecast & Capacity Comparison
1,200 SW-D
1,000 948
800 717 715
600
400
200
-233
0
2015 2020 2015 Remaining
-200 Students Forecast Capacity Need
-400
Observations
Student population in the far southwest is forecasted to remain relatively flat through 2020.
In 2015, Kaiser boundary enrollment declined 7.8% and Grant Ranch declined 6.8%, driven primarily by birth rate
declines and housing changes.
If enrollment increased beyond the forecast, there is adequate capacity to serve the area.
Forecast: Capacity not needed
832020 Middle School Forecast: Enrollment will remain steady
Forecast & Capacity Comparison
4000
3,615
3500 3,232 3,182
3000
2500
2000
1500
1000
500
-433
0
2015 2020 2015 Remaining
-500
Students Forecast Capacity Need
-1000
Observations
The West Middle School Zone has experienced continued enrollment growth as a result of stronger programs in the
area, which will continue in 2016 with the opening of Kepner Beacon and Strive Prep Kepner, along with the
reassignment of DSST College View into the zone.
Housing price increases will be a netting factor against the capture rate increases in the area.
While capacity is tight as a %, it is expected to be adequate for any enrollment gains by 2020.
Forecast: Capacity not needed
842020 Middle School Forecast: Enrollment will remain steady
Forecast & Capacity Comparison
2500
2000 1,877
1500 1,282
1,241
1000
500
-595
0
2015 2020 2015 Remaining
-500 Students Forecast Capacity Need
-1000
Observations
Due to the 2016 school openings of Bear Valley International School and DSST Henry, capture rates are expected to
improve as residents attend DPS instead of neighboring districts.
Any enrollment growth through 2020 will be served at available capacity in the area.
Forecast: Capacity not needed
852020 Middle School Forecast: Enrollment will remain flat
Forecast & Capacity Comparison
300
258
250
200
150 127 142
100
50
0
2015 2020 2015 Remaining
-50 Students Forecast Capacity Need
-100
-116
-150
Observations
Middle school age student population is forecasted to remain flat and additional capacity will not be needed with a
current excess of seats at Grant Ranch K-8.
Forecast: Capacity not needed
862020 High School Forecast: Enrollment will remain steady
Forecast & Capacity Comparison
2500
2,182
2000 1,889 1,886
1500
1000
500
0 -296
2015 2020 2015 Remaining
Students Forecast Capacity Need
-500
Observations
There is minimal forecasted growth in the West High School Enrollment Zone through 2020.
Capture rate increases will be offset by redevelopment of the existing housing stock in these neighborhoods.
Forecast: Capacity not needed
872020 High School Forecast: Growth will remain flat
Forecast & Capacity Comparison
3500
3000 2,872
2500 2,188 2,132
2000
1500
1000
500
-740
0
2015 2020 2015 Remaining
-500 Students Forecast Capacity Need
-1000
Observations
There is minimal forecasted growth in the Lincoln High School boundary through 2020.
Any additional enrollment gains are able to be served at area schools.
Forecast: Capacity not needed
882020 High School Forecast: Enrollment growth will remain flat
Forecast & Capacity Comparison
3000
2500 2,380
2000
1,467 1,498
1500
1000
500
0
2015 2020 2015 Remaining
-500 Students Forecast Capacity Need
-1000
-882
-1500
Observations
In the Kennedy boundary, enrollment levels are expected to remain flat through 2020.
Enrollment gains in the area are able to be served at area schools.
Forecast: Capacity not needed
89Aligning Supply of ECE-4 Seats vs. Supply
of Kindergarten Seats
90ECE Capacity Methodology
There are four primary types of pre-school that serve four-year-olds in Denver
Pre-School at a
Pre-School at DPS Pre-School at Private
Community Partner In-home Care
Providers
Tuition set/waived based
Tuition set/waived based Often tuition-free
on income Primarily charge tuition
on income
By sub-region, compare the ratio of 4 year olds without
Total ECE-4 students served in a access to tuition-based programs served versus 5 year
community site or at a DPS location olds served.
Incorporate FRL rates to assess the ability that families
versus are able to attend tuition-based providers.
Areas with high FRL K-5 rates and low ECE-4 to
Total kindergarten students kindergarten ratios need additional ECE capacity.
Areas with low FRL K-5 rates or with high ECE-4 to
kindergarten ratios do not need additional ECE capacity.
91Ratio of ECE-4 Students to Kindergarten Students
92Far Southeast ECE Capacity Needs
ECE-4 Kindergarten
Total students served in a community site or at a DPS location: 177
Total kindergarten students: 308
Outcome: Only 57% of kindergartners in this area were likely able to attend a pre-school
program. With an overall K-5 FRL rate of 68%, many families are unlikely to be able to attend a
tuition-based program.
Potential Additional Seats: 90 – 120 seats
93Place Bridge/McMeen/Ellis ECE Capacity Needs
ECE-4 Kindergarten
Total students served in a community site or at a DPS location: 185
Total kindergarten students: 384
Outcome: Only 48% of kindergartners in this area were likely able to attend a pre-school
program. With an overall FRL rate of 76%, many families are unlikely to be able to attend a
tuition-based program.
Potential Additional Seats: 150 – 200 seats
94Fairview Area ECE Capacity Needs
ECE-4 Kindergarten
Total students served in a community site or at a DPS location: 169
Total kindergarten students: 312
Outcome: Only 54% of kindergartners in this area were likely able to attend a pre-school
program. With an overall FRL rate of 93%, many families are unlikely to be able to attend a
tuition-based program.
Potential Additional Seats: 100 – 120 seats
95Pascual LeDoux Area ECE Capacity Needs
ECE-4 Kindergarten
Total students served in a community site or at a DPS location: 354
Total kindergarten students: 678
Outcome: Only 52% of kindergartners in this area were likely able to attend a pre-school
program. With an overall FRL rate of 95%, many families are unlikely to be able to attend a
tuition-based program.
Potential Additional Seats: 50 – 100 seats, due to potential for other schools to use additional
classrooms to serve ECE at more locations
96You can also read