Preliminary Energy Savings Analysis: ANSI/ASHRAE/IES Standard 90.1-2019 - April 2021 - | Building Energy ...
←
→
Page content transcription
If your browser does not render page correctly, please read the page content below
Preliminary Energy Savings
Analysis: ANSI/ASHRAE/IES
Standard 90.1-2019

April 2021
(This page intentionally left blank)
Acknowledgments
                         This Report was Prepared for:
                           U.S. Department of Energy
               Office of Energy Efficiency and Renewable Energy
                          Building Technologies Office
                           Energy.gov/eere/buildings

                                    By
                                Jian Zhang
                             Michael Rosenberg
                              Jeromy Lerond
                                Yulong Xie
                              Chitra Nambia
                                 Yan Chen
                                 Reid Hart
                              Mark Halverson
                             Douglas Maddox
                               Supriya Goel

                   Pacific Northwest National Laboratory

ii   Preface
Acronyms
AEO Annual Energy Outlook
ANSI American National Standards Institute
ASHRAE American Society of Heating, Refrigerating, and Air-Conditioning Engineers
Btu British thermal unit(s)
CBECS Commercial Building Energy Consumption Survey
COP coefficient of performance
CRAC computer room air conditioner
DCV demand controlled ventilation
DDC direct digital control
DOAS dedicated outdoor air system
DOE U.S. Department of Energy
ECB Energy Cost Budget
ECI energy cost intensity
ECPA Energy Conservation and Production Act
ERR enthalpy recovery ratio
EIA Energy Information Administration
EPA U.S. Environmental Protection Agency
ERV energy recovery ventilator
EUI energy use intensity
2
ft square foot(feet)
GWP Global Warming Potential
HRV heat recovery ventilator
HVAC heating, ventilating, and air conditioning
IAM integrated assessment model
IECC International Energy Conservation Code
IEER integrated energy efficiency ratio
IES Illuminating Engineering Society
IESNA Illuminating Engineering Society of North America
2
kft thousand square feet
kWh thousand Watt-hour
LPD lighting power density
PBA principal building activity
PCI Performance Cost Index
PRM Performance Rating Method
PNNL Pacific Northwest National Laboratory
SAT supply air temperature
Acronyms iiiSCOP seasonal coefficient of performance SC-CO2 social cost of carbon SHGC solar heat gain coefficient SSPC Standing Standard Project Committee SWH service water heating U.S.C United State Code VAV variable air volume VRF variable-refrigerant-flow VT visible transmittance yr year(s) iv Preface
Executive Summary
Title III of the Energy Conservation and Production Act, as amended (ECPA), establishes requirements
for DOE to review consensus-based building energy conservation standards. (42 U.S.C. 6831 et seq.)
Section 304(b), as amended, of ECPA provides that whenever the ANSI/ASHRAE/IESNA 1 Standard
90.1-1989 (Standard 90.1-1989 or 1989 edition), or any successor to that code, is revised, the Secretary of
Energy (Secretary) must make a determination, not later than 12 months after such a revision, whether the
revised code would improve energy efficiency in commercial buildings, and must publish a notice of such
determination in the Federal Register. (42 U.S.C. 6833(b)(2)(A))

Standard 90.1 is developed under ANSI-approved consensus procedures 2, and is under continuous
maintenance by a Standing Standard Project Committee (commonly referenced as SSPC 90.1). ASHRAE
has an established program for regular publication of addenda, or revisions, including procedures for
timely, documented, consensus action on requested changes to the Standard. 3 Standard 90.1-2019 was
published in October 2019, triggering the statutorily required DOE review process.

To meet the statutory requirement, DOE conducted an analysis to quantify the expected energy savings
associated with Standard 90.1-2019. This report documents the methodology used to conduct the analysis.

Based on the analysis, DOE has preliminarily determined that the 2019 edition of the
ANSI/ASHRAE/IES Standard 90.1 would improve overall energy efficiency in buildings subject to the
code (compared to the 2016 edition of Standard 90.1).

Methodology

The methodology applied in this analysis is consistent with that utilized for previous DOE building
energy codes analyses and determinations, is designed to evaluate the impact of the updated Standard on
new construction across the U.S., and is based on a combination of qualitative and quantitative
assessments:

    • Qualitative: The first phase of analysis was a comparative review of the textual requirements of the
      Standard, examining specific changes (known as “addenda”) made between Standard 90.1-2019 and
      the previous 2016 edition. ASHRAE publishes changes to Standard 90.1 as individual addenda to the
      preceding Standard and then bundles them together to form the next published edition. Addenda with
      direct impact on energy use were identified and their anticipated impact on energy use was
      determined.
    • Quantitative: The second phase of analysis examined the impact of addenda having a direct impact
      on energy use. The quantitative phase uses whole-building energy simulation and relies upon the
      established DOE methodology for energy analysis, which is based on 16 representative building types
      across all U.S. climate zones, as defined by Standard 90.1. Energy use intensities (EUIs) by fuel type
      and by end-use were developed for each building type and weighted by the relative square footage of
      construction to estimate the difference between the aggregated national energy use under Standard
      90.1-2016, which serves as the baseline, and Standard 90.1-2019.

1
  ANSI – American National Standards Institute; ASHRAE – American Society of Heating, Refrigerating, and Air-Conditioning
Engineers; IES – Illuminating Engineering Society; IES – Illuminating Engineering Society (previously identified as the
Illuminating Engineering Society of North America, IESNA)
2
  See https://www.ansi.org/about_ansi/overview/
3 More information on the development of ANSI/ASHRAE/IES Standard 90.1 is available at
http://sspc901.ashraepcs.org/index.php

                                                                                                  Executive Summary    v
Results
In creating Standard 90.1-2019, ASHRAE published 88 addenda in total, of which:
• 29 are expected to decrease energy use (i.e., increased energy savings);
• none are expected to increase energy use (i.e., decreased energy savings), and;
• 59 are expected to have no direct impact on energy savings (such as administrative or clarifications or
changes to alternative compliance paths). 1
New commercial buildings meeting the requirements of Standard 90.1-2019 that were analyzed in the
quantitative analysis exhibit national savings (compared to Standard 90.1-2016) of approximately the
following:
• 4.7 percent site energy savings;
• 4.3 percent source energy savings;
• 4.3 percent energy cost savings, and;
• 4.2 percent carbon emissions.
The quantitative analysis relies upon prototype buildings reflecting a mix of typical U.S. building types
and construction practices. In creating its prototypes, DOE leverages recent U.S. construction data that is
mapped to the commercial building types defined by the Energy Information Administration (EIA) and
adapted for use by Standard 90.1. In combination with resulting building type weighting factors, the
prototypes represent approximately 75 percent of the total square footage of new commercial construction
(Lei et al. 2020).
Site and source EUIs, energy cost indices (ECIs), carbon emissions, and SC-CO2, which vary by building
type, are shown in Table ES.1 and Table ES.2 for Standard 90.1-2016 and Standard 90.1-2019,
respectively. Percentage savings aggregated at the national level are shown in Figure ES.1 and Table
ES.3, and analogous tables aggregated by climate zone are included in Section 4.2.
1
Addenda characterized as having no direct impact on energy savings are detailed in Appendix A:
vi Executive SummaryPercentage Savings by Building Type
0.0% 2.0% 4.0% 6.0% 8.0% 10.0% 12.0% 14.0%
Small Office
Medium Office
Large Office
Stand-Alone Retail
Strip Mall
Primary School
Secondary School
Outpatient Health Care
Hospital
Small Hotel
Large Hotel
Non-Refrigerated Warehouse
Quick Service Restaurant
Full Service Restaurant
Mid-Rise Apartment
High-Rise Apartment
Weighted National Average
Site EUI Source EUI ECI Carbon Emissions and SC-CO2
Figure ES.1. Percentage Savings by Building Type from 90.1-2016 to 90.1-2019
Executive Summary viiTable ES.1. Estimated Energy Use Intensity by Building Type – Standard 90.1-2016
Whole Building Energy Metrics
Floor Carbon
Area Site EUI Source EUI Emission
Building Weight (kBtu/ft2- (kBtu/ft2- ECI (tons/kft2- SC-CO2
Type Prototype Building (%) yr) yr) ($/ft -yr)
2
yr) ($/kft2-yr)
Office Small Office 3.8% 27.1 77.6 $0.82 5.5 $275
Medium Office 5.0% 30.8 84.2 $0.88 5.9 $296
Large Office 3.9% 55.4 156.9 $1.65 11.1 $555
Retail Stand-Alone Retail 10.9% 48.4 114.4 $1.15 7.8 $389
Strip Mall 3.7% 52.8 133.8 $1.37 9.2 $462
Education Primary School 4.8% 43.4 107.4 $1.09 7.4 $369
Secondary School 10.9% 37.2 94.0 $0.96 6.5 $325
Healthcare Outpatient Health Care 3.4% 107.6 276.3 $2.84 19.1 $958
Hospital 4.5% 120.0 276.8 $2.77 18.7 $936
Lodging Small Hotel 1.6% 54.8 118.0 $1.16 7.8 $392
Large Hotel 4.2% 83.1 177.1 $1.73 11.7 $586
Warehouse Non-Refrigerated 2.2
18.6% 15.7 33.2 $0.32 $110
Warehouse
Food Quick Service 53.7
0.3% 493.4 863.7 $7.87 $2,689
Service Restaurant
Full Service Restaurant 1.0% 336.5 649.8 $6.14 41.7 $2,090
Apartment Mid-Rise Apartment 13.7% 37.8 104.4 $1.09 7.3 $367
High-Rise Apartment 9.6% 41.3 92.0 $0.91 6.2 $308
National 100% 48.6 116.0 $1.17 7.9 $395
viii Executive SummaryTable ES.2. Estimated Energy Use Intensity by Building Type – Standard 90.1-2019
Whole Building Energy Metrics
Floor Area Carbon
Building Weight Site EUI Source EUI ECI Emission SC-CO2
Type Prototype (%) (kBtu/ft2-yr) (kBtu/ft2-yr) ($/ft2-yr) (tons/kft2-yr) ($/kft2-yr)
Small Office 3.8% 25.6 73.2 $0.77 5.2 $259
Office Medium Office 5.0% 29.7 80.2 $0.83 5.6 $281
Large Office 3.9% 53.2 151.0 $1.59 10.7 $534
Stand-Alone Retail 10.9% 46.1 106.3 $1.06 7.2 $359
Retail
Strip Mall 3.7% 51.0 127.6 $1.30 8.8 $440
Primary School 4.8% 40.9 101.1 $1.03 6.9 $348
Education
Secondary School 10.9% 35.6 89.9 $0.92 6.2 $311
Outpatient Health Care 3.4% 104.5 267.7 $2.75 18.5 $927
Healthcare
Hospital 4.5% 105.4 261.2 $2.66 17.9 $898
Small Hotel 1.6% 52.2 110.3 $1.07 7.3 $364
Lodging
Large Hotel 4.2% 75.8 162.2 $1.59 10.7 $538
Non-Refrigerated 2.1
Warehouse 18.6% 15.5 32.5 $0.32 $107
Warehouse
Quick Service 53.5
0.3% 492.5 860.9 $7.84 $2,679
Food Service Restaurant
Full Service Restaurant 1.0% 335.5 646.6 $6.11 41.5 $2,079
Apartment Mid-Rise Apartment 13.7% 36.5 101.5 $1.06 7.1 $358
High-Rise Apartment 9.6% 40.5 90.1 $0.89 6.0 $302
National 100% 46.3 111.0 $1.12 7.6 $379
Executive Summary ixTable ES.3. Estimated Percent Energy Savings between 2016 and 2019 Editions of Standard 90.1
– by Building Type
Floor Savings (%)
Area Carbon
Building Weight Emissions
Type Prototype Building (%) Site EUI Source EUI ECI & SC-CO2
Small Office 3.8% 5.5% 5.7% 6.1% 5.7%
Office Medium Office 5.0% 3.6% 4.8% 5.7% 5.0%
Large Office 3.9% 4.0% 3.8% 3.6% 3.8%
Stand-Alone Retail 10.9% 4.8% 7.1% 7.8% 7.7%
Retail
Strip Mall 3.7% 3.4% 4.6% 5.1% 5.0%
Primary School 4.8% 5.8% 5.9% 5.5% 5.9%
Education
Secondary School 10.9% 4.3% 4.4% 4.2% 4.3%
Outpatient Health Care 3.4% 2.9% 3.1% 3.2% 3.2%
Healthcare
Hospital* 4.5% 12.2% 5.6% 4.0% 4.0%
Small Hotel 1.6% 4.7% 6.5% 7.8% 7.0%
Lodging
Large Hotel 4.2% 8.8% 8.4% 8.1% 8.3%
Non-Refrigerated
Warehouse 18.6% 1.3% 2.1% 2.5% 2.4%
Warehouse
Quick Service
Food 0.3% 0.2% 0.3% 0.4% 0.4%
Restaurant
Service
Full Service Restaurant 1.0% 0.3% 0.5% 0.5% 0.6%
Mid-Rise Apartment 13.7% 3.4% 2.8% 2.8% 2.6%
Apartment
High-Rise Apartment 9.6% 1.9% 2.1% 2.2% 2.2%
National 100% 4.7% 4.3% 4.3% 4.2%
*See Section 4.2 for discussion of Hospital site EUI savings
x Executive SummaryPRELIMINARY ENERGY SAVINGS ANALYSIS
ANSI/ASHRAE/IES STANDARD 90.1-2019
Table of Contents
Acknowledgments .........................................................................................................................................................ii
Acronyms .................................................................................................................................................................... iii
Executive Summary ....................................................................................................................................................... v
1. Introduction .......................................................................................................................................................... 1
1.1 Compliance with Standard 90.1 .................................................................................................................. 2
2. Summary of Addenda Included in Standard 90.1-2019 ....................................................................................... 3
3. Methodology ........................................................................................................................................................ 4
3.1 Overview ..................................................................................................................................................... 4
3.2 Qualitative Analysis .................................................................................................................................... 4
3.3 Quantitative Analysis .................................................................................................................................. 5
3.3.1 Building Types and Model Prototypes ............................................................................................ 6
3.3.2 Climate Zones ................................................................................................................................. 7
3.3.3 Development of Weighting Factors................................................................................................. 8
3.3.4 Treatment of Federal Minimum Equipment Standards ................................................................... 8
3.4 Comments on Methodology ...................................................................................................................... 11
4. Results ................................................................................................................................................................ 12
4.1 Qualitative Analysis Results ..................................................................................................................... 12
4.2 Quantitative Analysis Results ................................................................................................................... 16
5. References .......................................................................................................................................................... 25
Appendix A: Addenda Not Quantified in Energy Savings Analysis ......................................................................... A.1
Appendix B: Modeling of Individual Addenda ......................................................................................................... B.1
Table of Contents xiList of Figures
Figure 1. United States Climate Zone Map ................................................................................................................... 8
Figure 2. Categorization of Addenda........................................................................................................................... 12
Figure 3. Categorization of Quantified Addenda ......................................................................................................... 16
Figure 4. Percentage Savings by Building Type from 90.1-2016 to 90.1-2019 .......................................................... 23
Figure 5. Percentage Savings by Climate Zone from 90.1-2016 to 90.1-2019 ............................................................ 24
List of Tables
Table 2.1. Number of Addenda affecting Various Sections in Standard 90.1-2019 ...................................................... 3
Table 3.1. Commercial Prototype Building Models ...................................................................................................... 7
Table 3.2. Relative Construction Volume Weights for 16 Prototype Buildings by Climate Zone (percent) ............... 10
Table 4.1. Addenda Determined to Directly Save Energy by the Qualitative Analysis of Standard 90.1-2019 .......... 13
Table 4.2. Carbon Emission Factors by Fuel Type ...................................................................................................... 17
Table 4.3. Estimated Energy Use Intensity by Building Type – Standard 90.1-2016 ................................................. 19
Table 4.4. Estimated Energy Use Intensity by Building Type – Standard 90.1-2019 ................................................. 20
Table 4.5. Estimated Energy Use Intensity by Climate Zone – Standard 90.1-2016 ................................................... 21
Table 4.6. Estimated Energy Use Intensity by Climate Zone – Standard 90.1-2019 ................................................... 22
Table 4.7. Estimated Percent Energy Savings between 2016 and 2019 Editions of Standard 90.1 – by
Building Type ............................................................................................................................................ 23
Table 4.8. Estimated Percent Energy Savings between 2016 and 2019 Editions of Standard 90.1 – by
Climate Zone ............................................................................................................................................. 24
Table B.1. Weighting Factors of Different Windows Categorized in 90.1-2016 and 90.1-2019............................... B.2
Table B.2. The Modeled ERVs in the Mid-Rise and High-Rise Apartments for 90.1-2016 and 90.1-2019 ............. B.5
Table B.3 Heat Recovery Effectiveness for Standard 90.1-2016 and 90.1-2019 Based on Required Design
EER for Mid-Rise and High-Rise Apartment Prototypes ........................................................................ B.6
xii Table of Contents1. Introduction
ANSI/ASHRAE/IES 1 Standard 90.1 is recognized by the U.S. Congress as the national model energy
code for commercial buildings under the Energy Conservation and Production Act (ECPA), as amended.
(42 U.S.C 6833) With each new edition of Standard 90.1, Section 304(b) of ECPA directs the Secretary
of Energy (Secretary) to make a determination as to whether the update would improve energy efficiency
in commercial buildings. Standard 90.1 is developed under ANSI-approved consensus procedures 2 and is
under continuous maintenance by a Standing Standard Project Committee (commonly referenced as
SSPC 90.1). ASHRAE has an established program for regular publication of addenda, or revisions,
including procedures for timely, documented, consensus action on requested changes to the Standard. 3
Standard 90.1-2019 (ASHRAE 2019), the most recent edition, was published in October 2019, triggering
the statutorily required U.S. Department of Energy (DOE) review and determination process. A notice of
the determination must be published in the Federal Register not later than 12 months after such revision.
(42 U.S.C. 6833 (b)(2)(A)) Within two years of publication of the determination, each State is required to
certify that it has reviewed and updated the provisions of its commercial building code regarding energy
efficiency with respect to the revised or successor code and to include in its certification, a demonstration
that the provisions of its commercial building code, regarding energy efficiency, meet or exceed the
revised Standard. (42 U.S.C. 6833(b)(2)(B)(i))
On February 27, 2018, DOE issued an affirmative determination of energy savings for Standard 90.1-
2016 (DOE 2017), which concluded that it would achieve greater overall energy efficiency in commercial
buildings required to meet the Standard than the previous edition, Standard 90.1-2013 (83 FR 8463).
Through this determination, Standard 90.1-2016 became the national model energy code for commercial
buildings. Consequently, and consistent with previous determinations, it also then represents the baseline
to which future changes are compared, including the current review of Standard 90.1-2019. In performing
its determination, DOE recognizes that not all states adopt the national model energy code directly, and
many states adopt and update their codes at different rates. Instead of adopting Standard 90.1 directly,
many states adopt the International Energy Conservation Code (IECC), which includes the option to
comply with Standard 90.1 by reference (ICC 2018). Separately, the DOE Building Energy Codes
Program also provides technical assistance supporting states implementing building energy codes,
including analysis to quantify state code impacts, tracking the status of state code adoption, and
developing a suite of tools to assist states and industry stakeholders in demonstrating compliance with
their codes (DOE 2020).
To fulfill its statutory directive, DOE analyzed Standard 90.1-2019 to understand its overall impact on
energy efficiency in commercial buildings required to meet the Standard. Section 2 of this report
summarizes specific changes (known as ‘addenda’) made between Standard 90.1-2019 and the previous
2016 edition; Section 3 documents the qualitative and quantitative analysis methodology; Section 4
presents the analysis results. In addition, Appendix A discusses addenda not included in the quantitative
analysis. Appendix A also details the modeling strategies for individual addenda included in the
quantitative analysis.
1
ANSI – American National Standards Institute; ASHRAE – American Society of Heating, Refrigerating, and Air-Conditioning
Engineers; IES – Illuminating Engineering Society; IES – Illuminating Engineering Society (previously identified as the
Illuminating Engineering Society of North America, IESNA)
2
See ANSI Essential Requirements (updated January 2020) at
https://share.ansi.org/Shared%20Documents/Standards%20Activities/American%20National%20Standards/Procedures,%20Guid
es,%20and%20Forms/2020_ANSI_Essential_Requirements.pdf
3
More information on the development of ANSI/ASHRAE/IES Standard 90.1 is available at
http://sspc901.ashraepcs.org/index.php
Introduction 11.1 Compliance with Standard 90.1
Standard 90.1-2019 includes several paths for compliance in order to provide flexibility to users of the
Standard. The prescriptive path, which is widely considered the most traditional, establishes criteria for
energy-related characteristics of individual building components, such as minimum insulation levels,
maximum lighting power, and controls for heating, ventilating, and air conditioning (HVAC) systems.
Some of those requirements are considered “mandatory,” meaning that they must be met even when one
of the other optional paths is utilized (e.g., performance path). The other optional paths are further
described below.
In addition to the prescriptive path, Standard 90.1 includes two optional whole building performance
paths. The first, known as the Energy Cost Budget (ECB) method, provides flexibility in allowing a
designer to “trade-off” compliance. This effectively allows a designer to not meet a given prescriptive
requirement if the impact on energy cost is offset by exceeding other prescriptive requirements, as
demonstrated through established energy modeling protocols. A building is deemed in compliance when
the annual energy cost of the proposed design is no greater than the annual energy cost of the reference
building design (baseline). In addition, Standard 90.1-2019 includes a second performance approach, the
Performance Rating Method (PRM), often referred to by its location in the Standard, Appendix G. PRM
is similar to ECB except that it uses a stable baseline that does not increase in stringency with each new
edition of the Standard, target building performance factors which must be achieved on a whole-building
basis to demonstrate compliance, and it allows credit for design features not credited in ECB. The
qualitative assessment in this analysis includes addenda impacting all three paths, and the quantitative
analyzes the prescriptive path only. More details are provided in Section 3.
2 Introduction2. Summary of Addenda Included in Standard
90.1-2019
ASHRAE publishes changes to Standard 90.1 as individual addenda to the preceding Standard and then
bundles them together to form the next published edition. In creating the 2019 edition, ASHRAE
published 88 addenda in total (listed in Appendix I of Standard 90.1-2019). Table 2.1 shows the number
of addenda included in Standard 90.1-2019 grouped into the primary sections of the Standard they impact.
When an addendum impacts multiple sections, it is counted only once in this table towards the section
that receives the most substantial impacts.
Table 2.1. Number of Addenda affecting Various Sections in Standard 90.1-2019
Number of
Section of 90.1-2019 Addenda
5. Building Envelope 9
6. Heating, Ventilating, and Air Conditioning 32
7. Service Water Heating 1
8. Power 0
9. Lighting 10
10. Other Equipment 1
Performance Compliance (including Sections
23
4.2.1.1, 11 and Appendices C and G)
Others 12
Total 88
More broadly, DOE characterized the individual addenda into three categories to help guide the analysis:
1. are clarifications, administrative, or update references to other documents;
2. modify the prescriptive and mandatory design and construction requirements for the building
envelope, HVAC, service water heating (SWH), power, lighting, and other equipment sections
of the Standard; or
3. modify the performance path options for compliance (e.g., the ECB, building envelope trade-off
option, and PRM sections of Standard 90.1).
While DOE reviews all addenda from a given code cycle, performing a qualitative review to characterize
the expect impacts of each, category #2 above—changes which affect the mandatory and prescriptive
provisions of the code—represents the subset of addenda which ultimately become the primary focal
point of the energy savings analysis. This is discussed further in the following section.
Summary of Addenda 33. Methodology
The methodology applied in this analysis is consistent with that utilized for previous DOE building
energy codes analyses and determinations, evaluates the expected impact of the updated Standard on new
construction, and is based on a combination of qualitative and quantitative assessments.
3.1 Overview
The qualitative phase of the analysis made initial assessments as to whether an individual addendum
decreased energy use, increased energy use, or did not affect energy use in a direct manner. The
quantitative phase then used whole-building energy modeling and simulation to quantify the impact of the
collection of addenda on overall energy use. The following steps provide a general overview of the
process:
Qualitative Analysis:
1. Determine whether each addendum is applicable to the prescriptive or mandatory requirements
of Standard 90.1-2019.
2. Determine whether each addendum that is applicable to the prescriptive path directly impacts
energy use.
3. Of the addenda that directly impact energy use, determine whether they increase or decrease
energy use.
Quantitative Analysis:
4. Of the addenda that directly impact energy use, determine those that can be reasonably
quantified through energy modeling and simulation analysis.
5. Calculate whole-building results and quantify the national impact based on energy use of the
addenda in step 4.
Additional detail on each phase of the analysis is provided in Sections 3.2 and 3.3.
3.2 Qualitative Analysis
Expanding upon the steps presented in the previous section, the first and second steps of the qualitative
analysis are used to filter out addenda that were deemed to not directly impact energy use (within the
context of this analysis). Addenda were excluded if they met either of the following criteria:
1. The addenda are not applicable to the prescriptive and mandatory requirements of the Standard,
meaning they only applied to the performance paths in Standard 90.1: Section 11 (Energy Cost
Budget Method), Appendix C (Methodology for Building Envelope Trade-off Option), and Appendix
G (Performance Rating Method). The performance paths represent optional alternatives to the
prescriptive path, and generally intended to align with the prescriptive path. As the stringency of the
prescriptive path is increased, the performance path rules and targets are typically updated to mirror
those changes. Therefore, the use of the prescriptive and mandatory requirements effectively
represents changes to the entire Standard. Additionally, the purpose of the optional performance paths
is to provide design flexibility, which occurs by allowing an almost limitless number of trade-off
combinations that comply with the Standard. Analytically, it is not practical or possible to model all
these combinations in a manner which can be aggregated to align with the purpose of a national
energy savings determination.
4 Methodology2. The addenda affect the prescriptive path but had no impact on energy use, an undetermined impact
within the scope of the analysis, or cannot be reasonably quantified through established and accepted
methods of energy modeling and simulation analysis. Addenda with no impact include administrative
changes or clarifications, changes to rating methods or categorization of equipment (as opposed to
required efficiency levels), changes to optional alternatives, exceptions, updates of references to other
documents, and text changes that are intended to improve the general usability of Standard 90.1.
Addenda with undetermined impact include those related to commissioning and functional testing
requirements, and to those whose impact on energy is dependent on site-specific conditions (such as
shading from trees or its neighboring buildings). Changes with impacts, which do not become
effective within three years from the publication of Standard 90.1-2019 (i.e., until a cutoff date of
December 31, 2022), are also considered as having no impact (within the context of this analysis).
The addenda that were considered to not have a direct impact on energy use, as described above, are
compiled in Appendix A. The remaining addenda were carried to the next step in the qualitative analysis,
which was to make a determination of the anticipated impact on energy use (i.e., whether the addendum
will decrease or increase energy use). Section 4.1 presents the results of the qualitative analysis.
3.3 Quantitative Analysis
The quantitative analysis builds on established methods to assess the energy performance of new editions
of Standard 90.1. As described in the previous section, whole-building energy models were used to
quantify the impact of addenda on energy use. Individual building models were created to represent each
unique combination of the mandatory and prescriptive requirements for Standard 90.1-2016 for each of
16 prototype building types in each of 16 climate zones. Each of these ‘compliant’ models was then
duplicated, with the second version amended only to incorporate the new requirements of 90.1-2019.
Additional details of the implementation into the prototype building models for each of the 17 addenda
are provided in Appendix B:.
The models were simulated using EnergyPlus Version 9.0 (DOE 2018). Those addenda that were not
captured through the quantitative analysis were filtered out and are labeled as such in Table 4.1 in Section
4.1. Addenda were not included in the quantitative analysis when they met one of the following criteria:
1. The addenda impact features are not representative of typical building designs. As explained in
Section 3.3.1, the purpose of the prototype models is to represent common design features found
in each building type in the United States. Therefore, there are less common features that are not
incorporated in the prototypes, such as series energy recovery, swimming pools, exterior lighting
(except for uncovered parking, building entrances and exits, and façade lighting that is typically
linked with the building), parking garages, and so on. Addenda affecting these features of
buildings were not captured via the prototypes in order to preserve representation of the typical
building stock.
2. The addenda adopt known standard practices. The systems and their configuration in the
prototype models are based on standard practice that has been widely adopted in the United
States. When an addendum is to fix a loophole for an uncommon design practice, the uncommon
design is not modeled in the prototypes and thus, has no affect within the quantitative analysis.
3. The addenda relate to verification or commissioning. Addenda related to verification,
commissioning, and fault-detection generate savings only when there is imperfect operation.
Because the models and simulation assume ideal operation, including these addenda would have
no impact.
4. The addenda incorporate federal minimum equipment standards. These addenda mirror update to
Methodology 5federal equipment standards and will improve efficiency even in the absence of their replication
in Standard 90.1-2019, and therefore, they were left out of the quantitative analysis. Additional
discussion is provided in Section 3.3.4.
3.3.1 Building Types and Model Prototypes
The 16 prototype buildings (DOE and PNNL 2020) used in the quantitative analysis largely correspond to
a classification scheme established in the 2003 DOE/Energy Information Administration (EIA)
Commercial Building Energy Consumption Survey (CBECS) (EIA 2003). CBECS separates the
commercial sector into 29 categories and 51 subcategories using the two variables “principal building
activity” (PBA) and “detailed principal building activity” (PBAplus, for more specific activities). DOE
relied heavily on these classifications in determining the buildings to be represented by the set of
prototype building models. By mapping CBECS observations to each prototype building, DOE also used
the CBECS building characteristics data to develop prototypes that could best represent the building
stock.
The exception to this is multi-family housing buildings that are not included in CBECS but are covered
by Standard 90.1 if more than three stories tall. Consequently, DOE developed mid-rise and high-rise
multi-family prototype buildings to add to the 14 prototype buildings identified through the review of
CBECS (Thornton et al. 2011).
Table 3.1 lists the broad building category, the prototype building, floor area of the prototype building,
and its construction weight relative to the other building types. DOE developed three sizes and form
factors characteristic of small, medium, and large office buildings to reflect the wide variation in office
building design. Similarly, retail, education, healthcare, lodging, food service, and apartments have two
representative prototypes each.
The 16 prototype buildings are representative of the characteristics of new construction in the United
States. It is not feasible to simulate all building types and possible permutations of building design.
Further, data are simply not available to correctly weight each possible permutation in each U.S. climate
zone as a fraction of the national building construction mix. Hence, the quantitative analysis focuses on
the use of prototype buildings that reflect a representative mix of typical construction practices. Together
with the construction weighting factors (described in Section 3.3.3), the 16 prototypes represent
approximately 75% of the total square footage of new commercial construction, including multi-family
buildings more than three stories tall, consistent with the scope of Standard 90.1 (Lei et al. 2020).
6 MethodologyTable 3.1. Commercial Prototype Building Models
Floor Area Floor Area
Building Type Prototype Building (ft2) (%)
Small Office 5,502 3.8%
Office Medium Office 53,628 5.0%
Large Office 498,588 3.9%
Stand-Alone Retail 24,692 10.9%
Retail
Strip Mall 22,500 3.7%
Primary School 73,959 4.8%
Education
Secondary School 210,887 10.9%
Outpatient Health Care 40,946 3.4%
Healthcare
Hospital 241,501 4.5%
Small Hotel 43,202 1.6%
Lodging
Large Hotel 122,120 4.2%
Warehouse Non-Refrigerated Warehouse 52,045 18.6%
Quick Service Restaurant 2,501 0.3%
Food Service
Full Service Restaurant 5,502 1.0%
Mid-Rise Apartment 33,741 13.7%
Apartment
High-Rise Apartment 84,360 9.6%
Total 100%
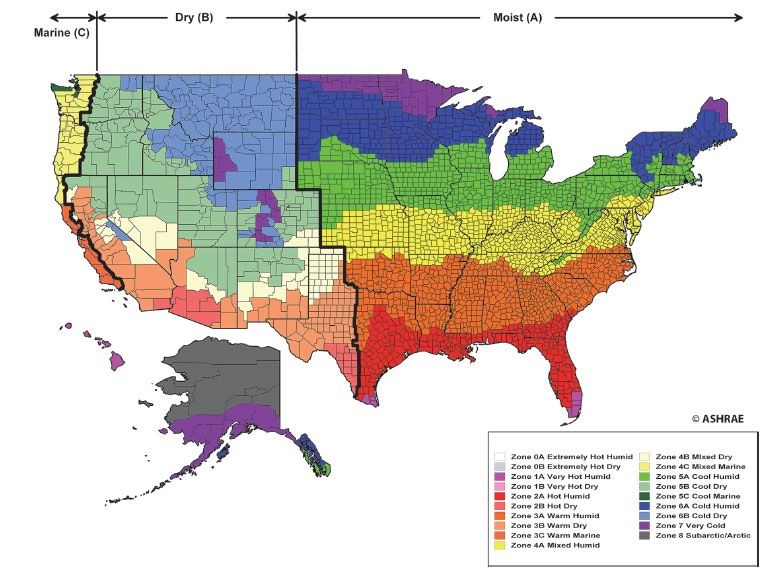
3.3.2 Climate Zones
Building models were analyzed in standardized climate zones described in ASHRAE Standard 169-2013
(ASHRAE 2013). Standard 169-2013 includes nine thermal zones and three moisture regimes. The U.S.
climate zones and moisture regimes are shown in Figure 1.
For this analysis, a specific climate location (city) was selected as a representative of each of the 16
climate/moisture zones found in the United States. These are also consistent with representative cities
approved by the SSPC 90.1 for setting the criteria for 90.1-2019.
The 16 cities used in the current analysis are as follows:
• 1A: Honolulu, Hawaii (very hot, humid) • 4C: Seattle, Washington (mixed, marine)
• 2A: Tampa, Florida (hot, humid) • 5A: Buffalo, NY (cool, humid)
• 2B: Tucson, Arizona (hot, dry) • 5B: Denver, Colorado (cool, dry)
• 3A: Atlanta, Georgia (warm, humid) • 5C: Port Angeles, Washington (cool, marine)
• 3B: El Paso, Texas (warm, dry) • 6A: Rochester, Minnesota (cold, humid)
• 3C: San Diego, California (warm, marine) • 6B: Great Falls, Montana (cold, dry)
• 4A: New York, New York (mixed, humid) • 7: International Falls, Minnesota (very cold)
• 4B: Albuquerque, New Mexico (mixed, dry) • 8: Fairbanks, Alaska (subarctic/arctic)
Methodology 7Figure 1. United States Climate Zone Map
3.3.3 Development of Weighting Factors
Weighting factors that allow aggregation of the energy impact from an individual building and climate
zone level to the national level were developed from construction data purchased from McGraw Hill.
Details of the development are further discussed in a PNNL report (Lei et al. 2020). New construction
weights were determined for each building type in each climate zone based on the county-climate zone
mapping from ASHRAE Standard 169-2013. Table 3.2 lists the resulting weighting factors by climate
and by prototype building used in the analysis. These data are used to develop the relative fractions of
new construction floor space represented by prototype building and within the 16 climate zones.
Using the energy use intensity (EUI) statistics from each building simulation and the corresponding
relative fractions of new construction floor space, DOE developed floor-space-weighted national EUI
statistics by energy type for each building type and standard edition. DOE then summed these energy
type-specific EUI estimates to obtain the national site energy EUI by building type and standard edition.
DOE also applied national data for average energy prices, average source energy conversion rates to the
energy type-specific EUI data, average carbon emission factors, and social cost of carbon (SC-CO2) to
obtain estimates of national source energy EUI, national energy cost intensity (ECI), national carbon
emissions, and national SC-CO2, again by building type and by standard edition.
3.3.4 Treatment of Federal Minimum Equipment Standards
Standard 90.1 contains requirements for specific types of equipment that are regulated by federal
efficiency standards for manufacturing and import. Addenda that adopted federal efficiency standards
8 Methodologywere excluded from the analysis to ensure that savings from energy codes and efficiency standards were
not double counted. In the quantitative analysis, this was accomplished by assuming current minimum
federal equipment efficiencies (i.e., as published in Standard 90.1-2019 with an effective date no later
than December 31, 2022) in both the 2016 and 2019 prototype building models (with offsetting effects),
which is consistent with historical DOE determination analyses. Note that the excluded addenda relate to
minimum equipment efficiency levels set through the federal appliance and equipment standards
rulemaking process, and not revised efficiency levels standards originating in ASHRAE Standard 90.1-
2019. If the efficiency improvement is due to a change initiated in Standard 90.1, even those which may
subsequently trigger an update in federal regulations, then those addenda are included in the
determination savings.
Methodology 9Table 3.2. Relative Construction Volume Weights for 16 Prototype Buildings by Climate Zone (percent)
Weights by
Building Type 1A 2A 2B 3A 3B 3C 4A 4B 4C 5A 5B 5C 6A 6B 7 8 Bldg Type
Large Office 0.11 0.54 0.07 0.54 0.26 0.23 1.13 0.00 0.24 0.48 0.15 0.00 0.09 0.00 0.01 0.00 3.86
Medium Office 0.14 0.78 0.19 0.73 0.45 0.16 0.95 0.03 0.17 0.88 0.31 0.00 0.17 0.03 0.02 0.00 5.01
Small Office 0.11 0.77 0.15 0.70 0.27 0.05 0.58 0.03 0.09 0.67 0.21 0.00 0.13 0.02 0.02 0.00 3.80
Stand-Alone Retail 0.29 1.79 0.31 1.78 0.85 0.12 1.92 0.08 0.26 2.37 0.54 0.01 0.49 0.06 0.06 0.01 10.94
Strip Mall 0.16 0.63 0.14 0.70 0.42 0.09 0.66 0.02 0.09 0.61 0.12 0.00 0.06 0.01 0.01 0.00 3.71
Primary School 0.13 0.98 0.12 0.94 0.36 0.04 0.88 0.03 0.12 0.77 0.23 0.00 0.16 0.05 0.02 0.00 4.83
Secondary School 0.26 1.86 0.19 2.16 0.77 0.14 1.98 0.07 0.27 2.18 0.51 0.01 0.37 0.09 0.06 0.01 10.92
Hospital 0.09 0.75 0.11 0.63 0.32 0.10 0.92 0.03 0.13 0.95 0.23 0.01 0.20 0.03 0.03 0.00 4.52
Outpatient Health Care 0.05 0.54 0.09 0.53 0.17 0.04 0.62 0.02 0.10 0.80 0.20 0.00 0.18 0.03 0.03 0.00 3.42
Full Service Restaurant 0.03 0.18 0.03 0.17 0.08 0.01 0.16 0.01 0.02 0.19 0.04 0.00 0.03 0.00 0.00 0.00 0.97
Quick Service Restaurant 0.01 0.07 0.01 0.06 0.02 0.00 0.06 0.00 0.00 0.07 0.02 0.00 0.01 0.00 0.00 0.00 0.33
Large Hotel 0.18 0.71 0.10 0.56 0.55 0.09 0.82 0.02 0.13 0.65 0.19 0.00 0.14 0.04 0.02 0.00 4.22
Small Hotel 0.03 0.30 0.02 0.27 0.11 0.02 0.30 0.01 0.03 0.27 0.10 0.00 0.08 0.03 0.02 0.00 1.59
Non-Refrigerated Warehouse 0.53 3.53 0.63 2.77 2.23 0.18 3.69 0.05 0.54 3.14 0.82 0.00 0.37 0.03 0.04 0.00 18.56
High-Rise Apartment 1.44 1.19 0.08 0.57 0.63 0.29 3.26 0.00 0.49 1.36 0.19 0.00 0.11 0.01 0.00 0.00 9.64
Mid-Rise Apartment 0.36 2.24 0.27 1.78 1.18 0.49 3.02 0.03 0.71 2.22 0.73 0.01 0.57 0.05 0.04 0.00 13.69
Weights by Zone 3.94 16.85 2.52 14.89 8.67 2.06 20.94 0.43 3.39 17.60 4.59 0.05 3.17 0.49 0.38 0.03 100.00
10 Methodology3.4 Comments on Methodology
The goal of this analysis was to determine if the 2019 edition of Standard 90.1 is more energy-efficient
relative to the 2016 edition. The approach selected to make this determination has certain limitations.
These limitations are outlined below.
State Code Adoption: As discussed in the Introduction (Section 1), states adopt and update their energy
codes in a variety of different manners. Some states adopt updated model codes as published while others
draft state-level amendments to modify the model code. States also adopt codes at varying rates, with
some states updating relatively quickly after a new edition is available, while others may remain on older
editions for a longer duration. While these variables are not included in the DOE determination analysis,
they ultimately affect the impacts of the model codes as applied across adopting states and localities.
Prototype Representation: Not all the addenda impacting energy use can be captured by the quantitative
analysis due to the fixed nature of the prototypes, as explained in Section 3.3.1. Thus, the impact resulting
from the quantitative analysis can be considered conservative. At the same time, the impact could be
considered generous because the addenda that were included impacted all buildings of a given type (i.e.,
the weighting factors carried the impact to all buildings of a given type in a climate zone even though
some of those buildings may not fit the descriptions of the prototype buildings). For example, the analysis
assumes all large office buildings have water-cooled chillers—a property of the Large Office prototype.
In reality, some have air-cooled, some have packaged equipment, some have variable refrigerant volume
systems, etc. If the water-cooled chiller efficiency improved more than the other systems, the analysis
overestimates savings. Whereas, if the efficiency improved less than the other systems, the analysis will
have underestimated savings.
Combination of Qualitative & Quantitative Analysis: In any high-level analysis there is a need to
balance precision, accuracy and practicality. The approach selected here addresses that by performing
both a qualitative and quantitative analysis. The quantitative analysis taken together with the qualitative
analysis provides a more robust and defensible determination. If the qualitative analysis determines that a
large majority of addenda are expected to decrease energy use, and the quantitative analysis also shows a
reduction in energy use from addenda impacting representative building designs, then taken together, the
determination can be said to be more robust and reliable.
Methodology 114. Results
4.1 Qualitative Analysis Results
The qualitative analysis concluded that 29 of the 88 addenda had a direct impact on energy use as defined
in Section 3.2 — all 29 of the addenda listed decrease energy use in commercial buildings. The 59
remaining changes were determined to have no direct impact on energy use. A graphical summary of the
qualitative analysis results is shown in Figure 2.
Decrease Energy
Use, 29
No Direct Impact
on Energy Use, 59
Figure 2. Categorization of Addenda
The 29 addenda with a direct impact are shown in Table 4.1, while the remainder are shown in Appendix
A:. Six columns of information are listed for each addendum in Table 4.1:
1. Addendum: the letter addendum designation assigned by ASHRAE.
2. Code Section(s): a list of the section numbers in Standard 90.1-2016 that are affected by the
addendum.
3. Description of Change: a brief description of the change made by the addendum.
4. Impact on Energy Use: the anticipated impact of the addendum on energy use.
5. Included in Quantitative Analysis: whether the addendum can be included in the forthcoming
Quantitative Analysis (see Section 4.2).
6. Discussion: how the impact on energy use was determined (and why the addendum was excluded
from the quantitative analysis, if applicable).
Addenda characterized as having no direct impact on energy savings are detailed in Appendix.
12 ResultsTable 4.1. Addenda Determined to Directly Save Energy by the Qualitative Analysis of Standard 90.1-2019
Addendum Code Sections Description of Change Impact on Included in Discussion
Energy Use Quantitative
Analysis
Excluded from quantitative analysis because
Modifies exceptions to exhaust air energy recovery Decreases
dn 6.5.6 No series energy recovery is not modeled in the
requirements. Energy Use
prototypes.
Reduces fan energy by allowing systems
Changes term "ventilation air" to "outdoor air" in
intended to operate continuously not to install
6.4.3.4.2, multiple locations. Adds an exception to allow systems
Decreases motorized outdoor air damper (less pressure
a 6.4.3.4.3, intended to operate continuously not to install motorized Yes
Energy Use drop), and reduce cooling energy for systems
6.5.1.1.4 outdoor air damper. Changes return air dampers to
with air economizers because of lower leakage
require low leakage ratings.
through return air dampers.
Provides definition of "occupied-standby mode" and adds Requires thermostat setback and minimum
Decreases
g 3.2, 6.4.3.9 new ventilation air requirements for zones served in Yes variable air volume (VAV) damper reset to zero
Energy Use
occupied-standby mode. during occupied standby model.
Clarifies that exhaust air ERVs should be sized to meet
Decreases Reduces HVAC energy by requiring adequately
h 6.5.6.1 both heating and cooling design conditions unless one Yes
Energy Use sized ERVs.
mode is not exempted by existing exceptions.
Reduces HVAC energy by preventing a bad
design practice of using ERV rather than DCV in
Revises exception to demand control ventilation (DCV) climate zones where ERVs are not required and
Decreases
j 6.4.3.8 requirements to clarify that the exception only applies to No DCV would save more energy. Excluded from
Energy Use
systems with ERV required to meet Section 6.5.6.1. quantitative analysis because typical designs, as
represented by the established prototypes, do not
use this design practice.
Revises definition of "networked guest room control Reduces timeout period from 30 to 20 minutes to
3.2, 6.4.3.3.5, Decreases
k system" and aligns HVAC and lighting time-out periods Yes activate occupancy-based temperature and
9.4.1.3 Energy Use
for guest rooms. ventilation setback controls for guestrooms.
Reduces lighting energy. Excluded from
Expands the exterior lighting power density (LPD)
Decreases quantitative analysis because the exterior areas
t 9.4.2 application table to cover additional exterior spaces that No
Energy Use added to the table are not modeled in the
are not in the exterior LPD table.
prototypes.
Requires in-patient hospitals with large chillers
Adds heat recovery for space conditioning requirement Decreases
v 6.5.6.3 Yes to recover rejected heat for use in heating water
targeted specifically at in-patient hospitals Energy Use
systems.
Restructures commissioning and functional testing Excluded from quantitative analysis because the
Too many to requirements in all sections of Standard 90.1 to require analysis is based on proper operation of controls
Decreases
ai list. See verification or testing for smaller and simpler buildings No in the prototypes and would not show savings for
Energy Use
Addendum ai and commissioning for larger and more complex improvements from verification, testing, or
buildings. commissioning.
Results 13Addendum Code Sections Description of Change Impact on Included in Discussion
Energy Use Quantitative
Analysis
Reduces HVAC energy. Excluded from
Adds indoor pool dehumidifier energy recovery Decreases
am 6.5.6.4 No quantitative analysis because swimming pools
requirement. Energy Use
are not modeled in the prototypes.
Reduces pump energy through improved
3.2, Decreases efficiency. Excluded from quantitative analysis
an Implements federal clean water pump requirements. No
10.4.6 Energy Use because impacted pumps are federally-regulated.
(See Section 3.3.4)
Reduces fan energy through improved fan
3.2, efficiency. Excluded from quantitative analysis
Replaces Fan Energy Grade metric with Fan Energy Decreases
ao 6.5.3.1.3, No because fan power in the prototypes is set based
Index metric Energy Use
12 on the total fan power limit in the Standard,
which has not been changed.
Decreases Revises supply air temperature reset
ap 6.5.3.5 Revises supply air temperature reset controls Yes
Energy Use requirements.
Replaces VAV box minimum setpoint of 20% of
Eliminates the requirement that zones with direct digital
Decreases the design supply air rate with a setpoint
au 6.5.2.1, control (DDC) have air flow rates that are no more than Yes
Energy Use determined using Simplified Procedure in
20% of the zone design peak flow rate.
ASHRAE Standard 62.1.
3.2,
Tables 5.5-0 Revises prescriptive fenestration U and SHGC Decreases Improves thermal performance of most
aw Yes
through 5.5-8, requirements and makes them material neutral. Energy Use fenestration components.
12
Provides separate requirements for nontransient dwelling Decreases Requires more dwelling units to have exhaust air
ay 6.5.6.1 Yes
unit exhaust air energy recovery. Energy Use energy recovery.
Changes interior LPD requirements for many space Decreases
bb Table 9.6.1 Yes Reduces lighting energy with lower LPD.
types. Energy Use
Adds new chiller table for heat pump and heat recovery Decreases Establishes new efficiency requirement for
bd Table 6.8.1-18 Yes
chillers. Energy Use equipment including heat recovery chillers.
Table 6.8.1- Revises computer room air conditioner (CRAC)
Decreases
be 11, requirements to clarify these are for floor mounted units Yes Requires higher efficiency CRAC units.
Energy Use
Table 6.8.1-19 and adds a new table for ceiling mounted units.
Reduces heating energy through improved
3.2, Tables Adds definition of Standby Power Mode Consumption. Decreases furnace efficiency. Excluded from quantitative
bo No
6.8.1.5 and F4 Increases furnace efficiency requirements. Energy Use analysis because the impacted furnaces are
federally-regulated. (See Section 3.3.4)
Adds a new table F-5 to specify DOE covered residential
water boiler efficiency requirements and notes that Excluded from quantitative analysis because the
Tables 6.8.1.6 Decreases
bp requirements in Table 6.8.1-6 apply only to products No impacted boilers are federally-regulated. (See
and F5 Energy Use
used outside the US. Adds standby mode and improved Section 3.3.4)
efficiency as of 1/15/2021.
14 ResultsAddendum Code Sections Description of Change Impact on Included in Discussion
Energy Use Quantitative
Analysis
Adds dry cooler efficiency requirements and slightly
Decreases
bq Table 6.8.1.7 increases efficiency requirements for evaporative Yes Requires higher efficiency dry coolers.
Energy Use
condensers.
Combines commercial refrigerator and freezer table with Excluded from quantitative analysis because the
Table 6.8.1.13 Decreases
br refrigerated casework table into a single table. Increases No impacted refrigerators and freezers are federally-
& 12 Energy Use
efficiency requirements. regulated. (See Section 3.3.4)
Decreases
cg Table 9.5.1 Revises LPDs using the Building Area Method. Yes Reduces lighting energy with lower LPD.
Energy Use
Replaces VAV box minimum setpoint of 20% of
Makes a similar change to VAV box minimums as
Decreases the design supply air rate with a setpoint
cm 6.5.2.1 Addendum au to 90.1-2016, but in exception 1 to Section Yes
Energy Use determined using the Simplified Procedure in
6.5.2.1 where the same 20% requirement still existed.
Standard 62.1. Similar to Addendum au.
6.4.1.1,
6.4.5,
Cleans up outdated language regarding walk-in cooler
Table 6.8.1- Excluded from quantitative analysis because the
and walk-in freezer requirements, and makes the Decreases
cn 20, No impacted walk-in coolers and freezers are
requirements consistent with current and future federal Energy Use
Table 6.8.1- federally-regulated. (See Section 3.3.4)
regulations.
21,
Table 6.8.1-22
Adds new normative references and updates existing Updates to include Addendum f to 62.1-2016,
ones with new effective dates, including several addenda Decreases which enables Simplified Ventilation Procedure
co 12 Yes
to ASHRAE Standard 62.1-2016, which enable Energy Use to be used for VAV box minimum setpoint
Simplified Ventilation Procedure. controls and system ventilation control.
Reduces lighting energy. Excluded from
Updates the lighting control requirements for parking Decreases
cv 9.4.1.2 No quantitative analysis because the parking garages
garages in Section 9.4.1.2. Energy Use
are not modeled in the prototypes.
Changes the daylight responsive requirements from
9.4.1.1, continuous dimming or stepped control to continuous Decreases Reduces lighting energy because of more
cw Yes
Table 9.6.3 dimming required for all spaces and adds a definition of Energy Use stringent daylighting control requirements.
continuous dimming.
Results 154.2 Quantitative Analysis Results
The quantitative analysis only includes those addenda that have a direct impact on energy use as
described in Section 3.2 and Section 3.3. A graphical summary of the addenda included in the quantitative
analysis is shown in Figure 3. The category labeled “Unquantified Energy Impact” includes those
addenda that were determined to have a direct impact on energy use but are not be included in the
quantitative analysis. Appendix B: describes the implementation of addenda into the prototype models.
Direct Impact and Not
Quantified, 12
Chapter 5 Envelope, 1
Quantified Chapter 6 HVAC, 13
Energy
No Direct Impact, 17
Impact on
Energy Use, 59
Chapter 9 Lighting, 3
Figure 3. Categorization of Quantified Addenda
Table 4.3 through Table 4.6 show the quantitative analysis results by building type and climate zone for
Standard 90.1-2016 and 90.1-2019, respectively. The results were aggregated on a national basis for each
Standard, based on the weighting factors discussed in Section 3.3.3. In these tables, site energy refers to
the energy consumed at the building site, and source energy (or primary energy) refers to the energy
required to generate and deliver energy to the site. To calculate source energy, conversion factors were
applied to the electricity and natural gas consumption. The development of these conversion factors is
explained below.
The electric energy source conversion factor of 9,957 Btu/kWh was calculated from EIA’s Annual
Energy Outlook (AEO) 2020 (EIA 2020) Table 2 1 as follows:
• Delivered commercial electricity, 2019: 4.65 quads
• Commercial electricity related losses, 2019: 8.92 quads
• Total commercial electric energy use, 2019: 13.58 quads
• Commercial electric source ratio, U.S. 2019: 2.92
• Source electric energy factor (3413 Btu/kWh site) 9,957 Btu/kWh 2
1
Available at https://www.eia.gov/outlooks/aeo/
2
The final conversion value is calculated using the full seven digit values available in Table 2 of AEO 2020. Other values shown
in the text are rounded.
16 ResultsYou can also read


