Transport Sector Contribution to Ambient Air Pollution - ipeec

Page created by Joe Fuller
 
CONTINUE READING
Transport Sector Contribution to Ambient Air Pollution - ipeec
Labs of Heat Transfer & Applied Thermodynamics
         Aristotle University Thessaloniki

Leonidas Ntziachristos                           Transport Sector Contribution to
   Prof. Mech. Eng.                                   Ambient Air Pollution

       ARISTOTLE UNIVERSITY THESSALONIKI
             SCHOOL OF ENGINEERING
        DEPT. OF MECHANICAL ENGINEERING                     2019 Transport Task Group Meeting, Tokyo, 30.10.2019
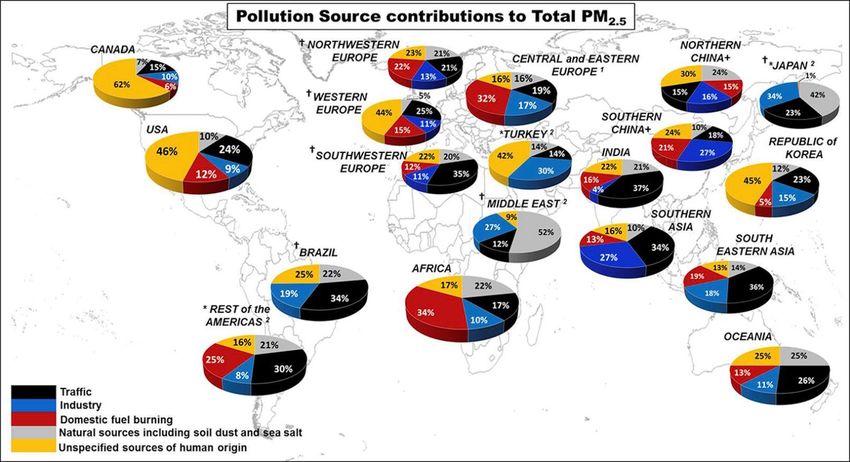
Transport Sector Contribution to Ambient Air Pollution - ipeec
Outline

1.   Transport and Air Pollution within the EU context
2.   Vehicle exhaust emission control technology effects
3.   New fuels
4.   Exhaust vs Non-exhaust emissions
5.   Vessel emissions
6.   Concluding messages

                                                           2
Transport Sector Contribution to Ambient Air Pollution - ipeec
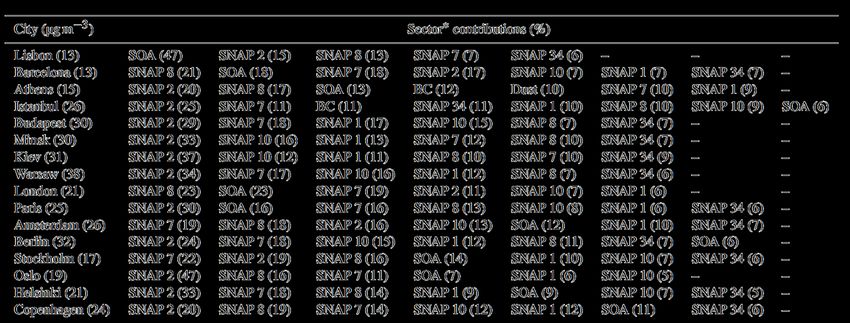
TRANSPORT AND AIR POLLUTION WITHIN THE EU CONTEXT

                                                    3
Transport Sector Contribution to Ambient Air Pollution - ipeec
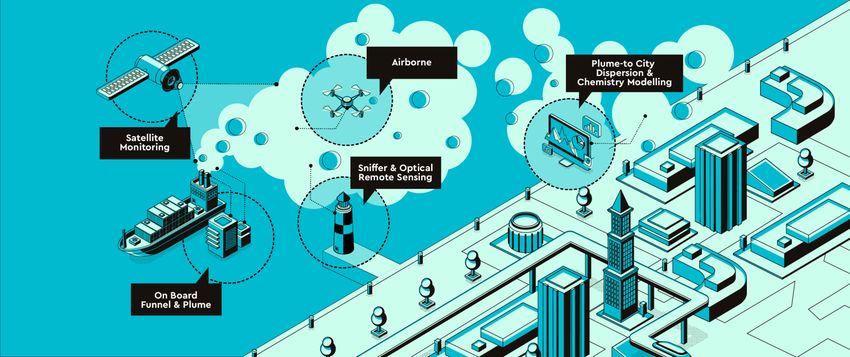
PM2.5 and NO2 Air Quality in the EU - 2017
PM2.5 – Annual limit values                               NO2 – Annual limit values

                                      10-20 μg/m3                                     20-30 μg/m3
                                      20-25 μg/m3                                     30-40 μg/m3
                                       >25 μg/m3                                       >40 μg/m3

WHO Guideline:                                              WHO Guideline:
10 µg/m3 (annual mean)                                      40 µg/m3 (annual mean)
25 µg/m3 (24-h mean)                                        200 µg/m3 (1-h mean)

                                                    Source: EEA, 2019                               4
Transport Sector Contribution to Ambient Air Pollution - ipeec
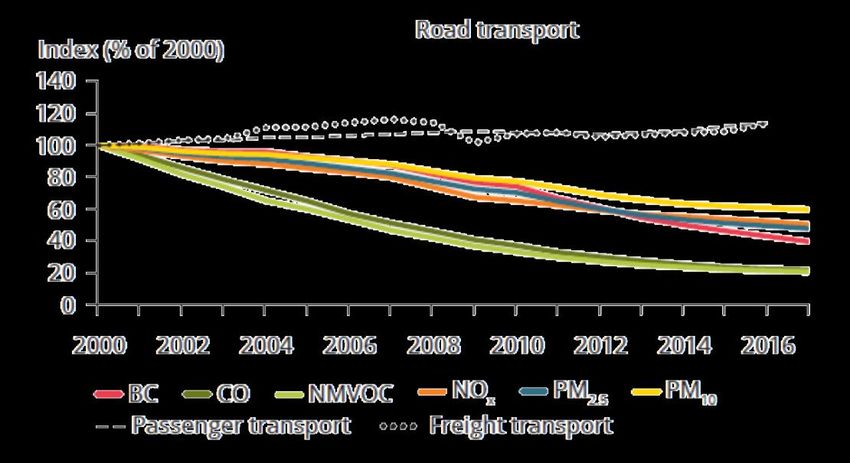
O3 Air Quality in the EU - 2017

WHO Guideline:
100 µg/m3 (8-h mean)

                                   Source: EEA, 2019     5
Transport Sector Contribution to Ambient Air Pollution - ipeec
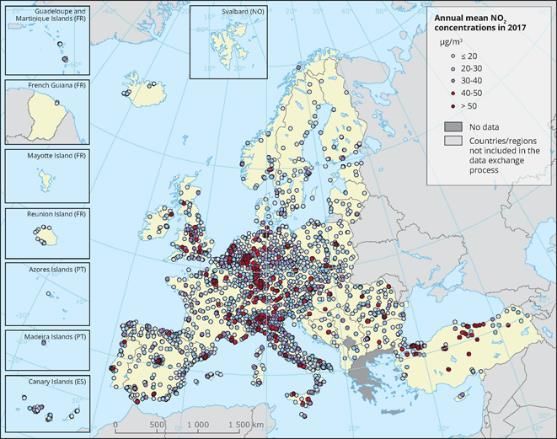
Exposure of population to air pollution
      Fraction of urban EU28 population exposed to AP above EU limit
         and WHO AQG (min & max observed between 2015 and 2017)

            EU limit     Exposure       WHO AQG        WHO Exposure
            (g/m³)     estimate (%)     (g/m³)        estimate (%)                   Blue bars: AEI 2017
                                                                                       Orange dots: 3-year average
PM2.5      Year (25)        6-8          Year (10)        74-81
                                                                                  Exposure level obligation (2015)
PM10       Day (50)        13-19         Year (20)        42-52

 O3      8-hour (120)      12-30       8-hour (100)       95-98

NO2        Year (40)        7-8          Year (40)          7-8

BaP        Year (1)        17-20        Year (0.12)       83-90
                                           estimate
                                                                            The AEI is an average of PM2.5 concentration levels (over a 3-year period) measured
SO2       Day (125)
Transport Sector Contribution to Ambient Air Pollution - ipeec
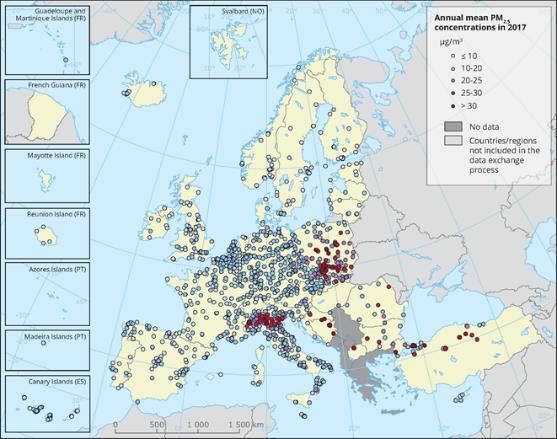
Contribution of sources to pollutants inventories

                                                                                                                        13%
                                                                                                                        47%

                                                                                                                        32%

Year considered: 2017
Non-road: Rail, Inland Waterways, Intra-EU Air and Sea

                                                         Source: European Environment Agency – Air Quality in EU 2019         7
Transport Sector Contribution to Ambient Air Pollution - ipeec
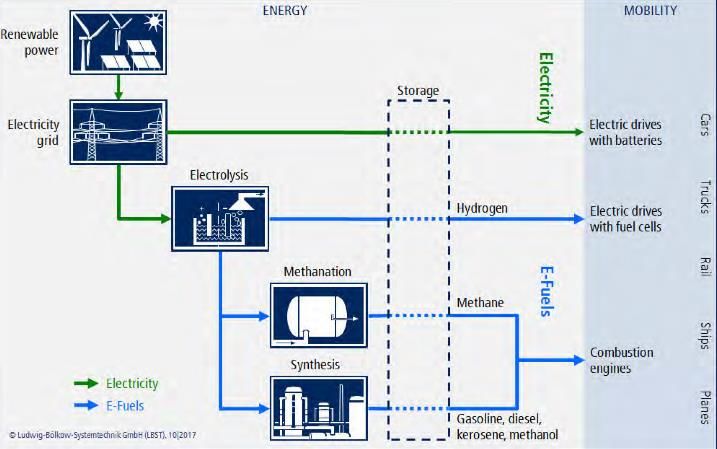
Evolution of emissions from transport modes

                                                               Despite emission control inefficiencies,
                                                               significant reductions in air pollutants
                                                                 emissions have been achieved but
                                                                exceedances of air pollution are still
                                                                               present

             Source: European Environment Agency – Air Quality in EU 2019                                 8
Transport Sector Contribution to Ambient Air Pollution - ipeec
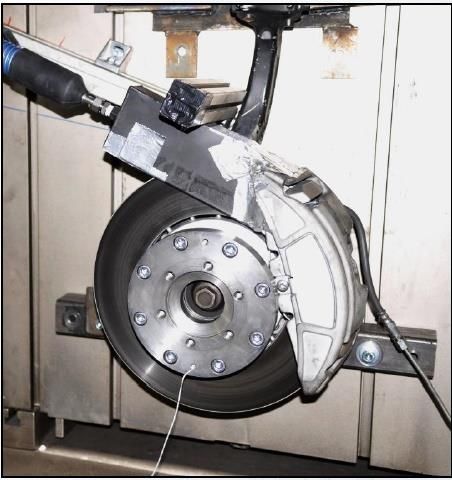
Source apportionment of urban PM2.5

                                                                         Year considered: 2014

         Karagulian et al. (2015), DOI: 10.1016/j.atmosenv.2015.08.087                           9
Transport Sector Contribution to Ambient Air Pollution - ipeec
Source apportionment of urban O3

                                                                                                                                 Year considered: 2010

01   Combustion in the production and transformation of energy                  07          Road Transport
02   Non-industrial combustion plants                                           08          Other mobile sources and machinery
03   Industrial combustion plants                                               09          Waste treatment and disposal
04   Industrial processes without combustion                                    10          Agriculture
05   Extraction and distribution of fossil fuels and geothermal energy          11          Other sources and sinks (nature)
06   Use of solvents and other products

                                                   Karamchadani et al. (2017), DOI:10.5194/acp-17-5643-2017                                              10
Statistics of transport energy consumption

▪   Road transport accounts for the largest share of final energy consumption
▪   A decrease of about 7% in 2017 consumption vs. 2015 consumption
▪   However, consumption in 2017 was still 20% higher than in 1990
▪   The fraction of diesel used in road transport has continued to increase, amounting to 74 % of total fuel sales in 2016
                                                               Source: EEA 2019, EEA 2017, Eurostat 2018                     11
Our ‘reference’ estimate about energy evolution in transport
Passenger Transport activity growth

                                       Total energy demand projection                                   Energy demand by fuel

Freight Transport activity growth

                                      Note: Does not include bunger fuel used for
                                      international maritime transport (~50 Mtoe)

                                                                   Source: EU Reference Scenario 2016                           12
Alternative estimates on future energy projections

                           Buildings   Industry              Transport

      Reference
      Scenario

  Maximum reduction
  scenario with 80%
decarbonisation in 2050
  compared to 1990                                                                    60%                      Even in the most advanced scenarios, the
                                                                                                               majority of transport activity is served by
Similar to above but no                                                                                        Internal Combustion Engines, up to 2050
new nuclear plans and
 no CO2 underground
        storage                                                                       55%

                                            Source: Nijs et al. (2018), EC Joint Research Centre projections with the TIMES tool                             13
How the future car fleet may look like
Car sales                                                   Fleet structure

11.6M BEV+PHEV sales in 2030, increasing to 16.2M in 2050   24% BEV+PHEV in 2030 increasing to 78% in 2050
2.8M petrol sales in 2030, declining to
VEHICLE EXHAUST EMISSION CONTROL TECHNOLOGY EFFECTS

                                                      15
Emissions standards evolution
                                         2014          2015           2016         2017        2018           2019          2020        2021     2022

                            Emissions           Euro 6b                                   Euro 6c
    New Types                   OBD             OBD Euro 6-1                              OBD Euro 6-2
    Homologation

                                                                                                                                                        Post Euro 6
                   Homologation Cycle           NEDC                                      WLTP
                                 RDE                                  Monitoring          E6d-temp RDE                   E6d RDE

                             Emissions                         Euro 6b                                   Euro 6c
    New Vehicles
                                 OBD                           OBD Euro 6-1                              OBD Euro 6-2
    Registration   Homologation Cycle                          NEDC                                      WLTP
                                 RDE                                                                                    E6d-temp RDE   E6d RDE

                                                                                              High Uncertainty
Euro 6c/d compliance requirements:
−   Particle Number (PN) limit for GDI aligned with the diesel one: 6×10¹¹ #/km
−   OBD thresholds reduction both for NOx and Particulate Matter (PM)
−   WLTP replaced NEDC
−   RDE (Real Driving Emissions) with Conformity Factors (CF) to account for measurement uncertainty :
         ▪ NOx 2.1 Euro 6d-temp| 1.43 Euro 6d
         ▪ PN       1.5
                                                                                                                                                                      16
The impact of RDE on diesel NOx
                            EU6b                   EU6c                                                                       EU6d-temp

Official RDE results from public database:
− Euro 6 diesel before RDE continued to emit much higher than limit
− Latest Euro 6d-temp already by far fulfil Euro 6d

                                            source: //www.acea.be/publications/article/access-to-euro-6-rde-monitoring-data               17
Real world emissions

Divergence between real-world and   EURO 6 Diesel RDE test results for
                                                                                    EURO 6 Testing outside of RDE
type-approval CO2 emission values          pre-RDE vehicles

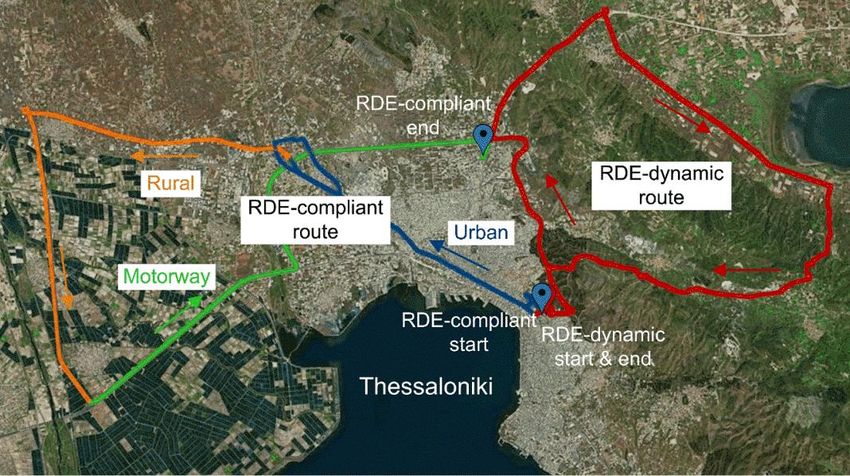
                                          Source: ICCT, 2019; EC, 2018; T&E, 2018                                   18
Different driving conditions examined - Thessaloniki

                                                                                                         Regulation
                                                              Trip characteristics          RDE   DYN
                                                                                                         boundaries
                                                              Trip duration [min]           110   60      90 – 120
                                                              Stop duration [% of trip]     22    20        > 10
                                                              Trip distance [km]            77    77        > 46
                                                              Urban distance share [%]      37    30      29 – 44
                                                              Rural distance share [%]      29    36      23 – 43
RDE route fully respects regulatory requirements              Motorway distance share [%]   34    34      23 – 43
DYN is a route of demanding driving, incl. uphill             Urban av. speed [km/h]        21    30      15 – 30
                                                              Rural av. speed [km/h]        83    75      60 – 90
                                                              Motorway av. speed [km/h]     118   110    100 – 145
                                                              Max altitude [m]              115   530      < 700
                                                              Positive el. gain [m/100km]   507   1600
NOx emission levels

Independent tests confirm NOx reduction with diesel Euro 6d-temp. More tests are needed.
− Not much difference between EU5 and EU6 pre-RDE
− Occasional big deviations between lab (WLTP) and RDE for pre-RDE Euro 6
Latest positive-ignition still below diesel. Hybrid at detection limit over RDE.
− Impact of LPG or CNG uncertain on already low emission levels
LPG retrofits on older gasoline cars lead to very high NOx levels!
                                                        Source: LAT, 2019                  20
What can be the impact of (real) low limits?
NOx emission evolution                                                                             NO2 concentration exceedances

                                           Source: Kleefeld and Ntziachristos (2012) TSAP Review                               Source: Amann (2018)

                  Emission control technologies that deliver emission levels on the road as designed by the
                   emission standards can lead to zero exceedances (in this case NO2) in urban conditions

                                                                                                                                                      21
Next regulatory stage: Post Euro 6/VI

EU consider that the next stage will be the last stage with all the objectives included
Major lines of consensus
− In use performance monitoring for compliance and enforcement over the lifetime of the vehicle
− Pollutant emissions to be considered along with CO2/GHG emissions
− Non regulated emissions to be also included in the regulations
                                                         Source: Ricardo,2019                     22
NEW FUELS

            23
Alternative Fuels

➢ Biofuels (biodiesel, bioethanol) sustainability questioned
   • Feedstock availability
   • Real CO2 benefits obtained
   • Not positive air quality impacts
➢ Renewable diesel (catalytic hydrogenation/de-oxidation of plant oils – BTL)
   • Well-controlled specifications
   • Paraffinic fuel
➢ 2nd – 3rd generation biofuels
   • Target is a 20% reduction to CO2 emissions
   • Adapted engines and vehicles are being studied in H2020
➢ E-fuels
   • Produced with renewable energy (H2, CH4, FT-Hydrocarbons)
   • High specific energy, designed properties, no contaminants
   • High cost (4 € / l)

                                                                                24
Synthetic fuels

Renewable synthetic fuels
− e-fuels are gaseous and liquid fuels such as hydrogen, methane, synthetic petrol, and diesel fuels generated from renewable
   electricity
                                                                                                                                25
EXHAUST VS NON-EXHAUST EMISSIONS

                                   26
Exhaust emissions vs non exhaust emissions

                 Paper # (if applicable)     27
The significance of fuel evaporation

                         300

                         250
EU28 NMVOC 2017 (kT)

                         200
                                                                      25% of total
                         150

                         100

                          50

                            0

                       Source: EU28 inventory submission under NECD

            Notes:
            • Calculations do not include refuelling losses, no ORVR control in the EU
            • No reliable estimate of running losses

                                                                                                 28
Exhaust vs non-exhaust PM emissions
                       80                                              64% of total
                       70
EU28 PM10 2017 (kt)

                       60
                       50
                       40
                       30
                       20
                       10
                        0
                               PCs     LCVs     HDVs           L-Vehs Tyre & Road
                                                                      brake abrasion
                      Source: EU28 inventory submission under NECD     wear

                                                                           0.0005
                                                                        (dpf or petrol)
                                                                           0.0008
                                                                        (dpf or petrol)   Source: Harrison et al. (2012), DOI: 10.1021/es300894r
                                                                            0.0010
                                                                             (dpf)

                                                                                                                                                   29
PM2.5 projections

           500
                                   Inl. vessels + ships
                                   Agric. + forestry machines
                                   Construction machines
           400
                                   Rail - diesel only
                                   Other non-road machinery
                                                                                          ➢ Baseline:
                                   Heavy trucks - diesel
                                                                                          − Reductions until 2030 vs. 2005
kt PM2.5

           300                     Cars and light trucks - gasoline
                                   Cars and light trucks - diesel
                                                                                                >90%: diesel HDV&LDV, locos, NRMM
                                   Mopeds + Motorcycles
                                                                                                ~70% other mobile machines
           200                     Buses + all other
                                   Tyre, brake, abrasion                                  − Road abrasion, tyre, clutch and brake wear
                                                                                                increase with traffic volume,
                                                                                                >80% of emissions from road vehicles in 2030
           100

             0
              2000   2010   2020      2030              2040            2050

                                                        Source: Kleefeld and Ntziachristos (2012) TSAP Review                                  30
Current PMP activities for non-exhaust PM

➢Reepsentative braking driving cycle under development
➢Particle sampling and measurement system under development
➢Metric still unknown (PM and PN)
➢Tyre emissions considered but little activity as yet

                        Source: Presentations from PMP group   31
VESSEL EMISSIONS
ECAs in EU waters

➢ Currently three regions:
    Baltic Sea
    North Sea
    English Channel
➢ Limits
    0.1% max S since 1.1.2015
    Baltic and North Seas NOx
     Tier III ECAs from 1.1.2021 on
➢ Developments
    On-going discussion for inclusion of the      Mediterranean Sea

     Mediterranean region as a SOx - ECA

                                                                       33
SOx limits in EU

 SOx - ECA vs non ECA zones

Permissible SOx levels outside
SOx - ECA for different shipping
           activities

       Source: Directive (EU) 2016/802: The sulphur directive
                                                                       34
NOx emissions with different technologies
 Tier II MSD                    Tier II MSD + Scrubber               Tier II MSD + SCR = Tier III

                                              Category                        NOx (g/kg-fuel)
                                An order of   Diesel PC Euro 6d-temp                1.5
                                magnitude     Diesel Truck Euro VI                  0.5
                                comparison    MSD Tier II                           60
                                              MSD Tier III                          6
Lehtoranta et al., CIMAC 2019                                                                       35
PM from ships as a function of fuel sulphur content
               3.00          Anderson, Salo and Fridell, Env Sci Tech 2015
                                                                                                             PM (g/kg-fuel)          SO2 (g/kg-fuel)              PN (#/kg-fuel)
                                                                                                         100             Fridell and Salo, J Eng Maritime Env 2016
               2.50                                                                                                                                                     1.E+16
                                                                                                                                                                        1.E+14

                                                                                            Mass (g/kg-fuel)

                                                                                                                                                                                   PN (#/kg-fuel)
               2.00                                                                                        10
                                                                                                                                                                        1.E+12
EFPM (g/kWh)

                                                                                                                                                                        1.E+10
               1.50          Biofuels                                                                       1                                                           1.E+08
               1.00
                                                                                                                                                                        1.E+06
                                                                                                          0.1                                                           1.E+04
               0.50                                                                                                                                                     1.E+02
                                                                                                         0.01                                                           1.E+00
               0.00                                                                                              Before      After             LNG          Typical
                      0.00   0.50      1.00       1.50        2.00     2.50   3.00   3.50
                                                                                                               scrubber scrubber engine                      MGO
                               LNG                 wt% S
                                                                                            Category                                              PM (mg/kg-fuel)
                                                                      An order of           Diesel PC Euro 6d-temp                                           6
                                                                      magnitude             Diesel Truck Euro VI                                             5
                                                                      comparison            MSD Tier II + MGO                                             1400
                                                                                            SSD Tier II + HFO                                             7400
                               Aakko-Saksa et al., TRA 2020                                                                                                                                         36
The SCIPPER Project

  www.scipper-project.eu

▪ Deployment of five measurement techniques for enforcing environmental
  regulations of shipping
▪ Testing of techniques in five real-world campaigns

                                                                      37
CONCLUDING MESSAGES

                      38
Key messages
▪ Air pollution and GHG
   o Transport remains significant source for urban air pollution
   o Air quality expected to improve, provided standards deliver reductions on the road
   o Fuels significant to achieve sustainability also in terms of GHG
▪ Vehicles
   o Post Euro 6 likely to be massive and change of approach
   o Will include new pollutants, enhanced on-board monitoring and in-service conformity
   o Connecting the car with rest of the ecosystem is crucial to AP/GHG success
▪ Vessels
   o Environmental regulations become stringent
   o Fuel refinement and emission aftertreatment deemed to bring significant reductions
   o Real –world measurement-based enforcement is required
                                                                                           39
Thank you!
 Prof. Leonidas Ntziachristos
 Lab of Applied Thermodynamics, & Heat Transfer and Environmental Engineering
 Aristotle University of Thessaloniki, PO Box 483 - GR 541 24 THESSALONIKI GREECE
 +30 2310 996003
 leon@auth.gr

                                                                                    40
You can also read