Presentation to investors and analysts - Result announcement for the full year ended 31 March 2019
←
→
Page content transcription
If your browser does not render page correctly, please read the page content below

Presentation to investors and analysts
Result announcement for the full year ended 31 March 2019
3 May 2019

Macquarie I FY19 result announcement I macquarie.com                                           Introduction   Overview of Result    Result Analysis and Financial Management   Outlook   Appendices

Disclaimer
The material in this presentation has been prepared by Macquarie Group Limited ABN 94 122 169 279 (MGL) and is general background information about Macquarie’s (MGL and its
subsidiaries) activities current as at the date of this presentation. This information is given in summary form and does not purport to be complete. The material contained in this presentation
may include information derived from publicly available sources that have not been independently verified. Information in this presentation should not be considered as advice or a
recommendation to investors or potential investors in relation to holding, purchasing or selling securities or other financial products or instruments and does not take into account your
particular investment objectives, financial situation or needs. Before acting on any information you should consider the appropriateness of the information having regard to these matters,
any relevant offer document and in particular, you should seek independent financial advice. No representation or warranty is made as to the accuracy, completeness or reliability of the
information. All securities and financial product or instrument transactions involve risks, which include (among others) the risk of adverse or unanticipated market, financial or political
developments and, in international transactions, currency risk.
This presentation may contain forward looking statements – that is, statements related to future, not past, events or other matters – including, without limitation, statements regarding our
intent, belief or current expectations with respect to Macquarie’s businesses and operations, market conditions, results of operation and financial condition, capital adequacy, provisions for
impairments and risk management practices. Readers are cautioned not to place undue reliance on these forward looking statements. Macquarie does not undertake any obligation to
publicly release the result of any revisions to these forward looking statements or to otherwise update any forward looking statements, whether as a result of new information, future events
or otherwise, after the date of this presentation. Actual results may vary in a materially positive or negative manner. Forward looking statements and hypothetical examples are subject to
uncertainty and contingencies outside Macquarie’s control. Past performance is not a reliable indication of future performance.
Unless otherwise specified all information is for the year ended 31 March 2019.
Certain financial information in this presentation is prepared on a different basis to the Financial Report within the Macquarie Group Annual Financial Report (“the Financial Report”) for the
year ended 31 March 2019, which is prepared in accordance with Australian Accounting Standards. Where financial information presented within this presentation does not comply with
Australian Accounting Standards, a reconciliation to the statutory information is provided.
This presentation provides further detail in relation to key elements of Macquarie’s financial performance and financial position. It also provides an analysis of the funding profile of
Macquarie because maintaining the structural integrity of Macquarie’s balance sheet requires active management of both asset and liability portfolios. Active management of the funded
balance sheet enables the Group to strengthen its liquidity and funding position.
Any additional financial information in this presentation which is not included in the Financial Report was not subject to independent audit or review by PricewaterhouseCoopers. Numbers
are subject to rounding and may not fully reconcile.

                                                                                                                                                                                                   2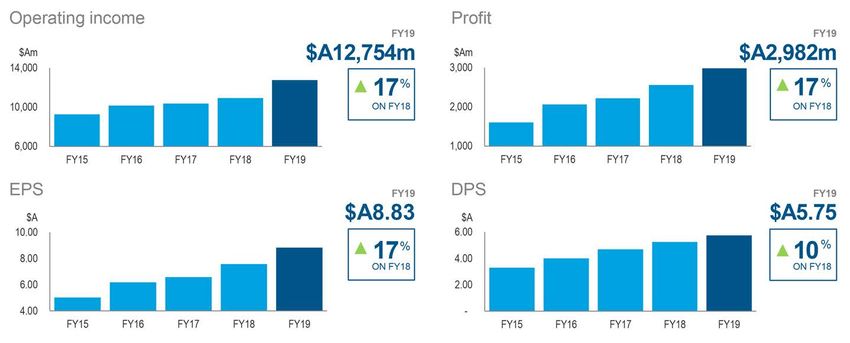
Agenda
01 Introduction
02 Overview of Result
03 Result Analysis and Financial Management
04 Outlook
05 Appendices
MACQUARIE 2019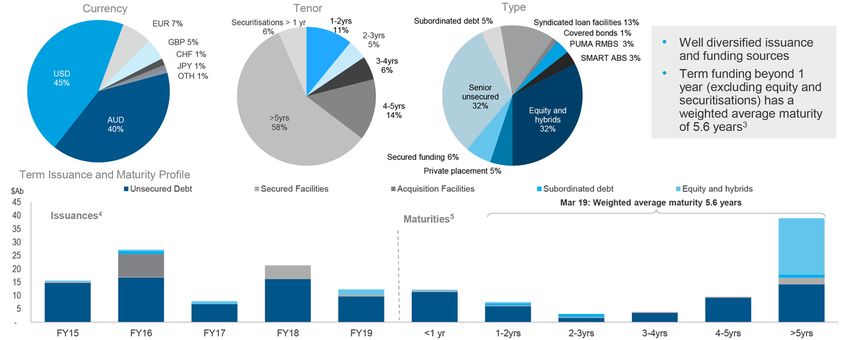
01 Introduction
Sam Dobson
Head of Investor Relations
MACQUARIE 2019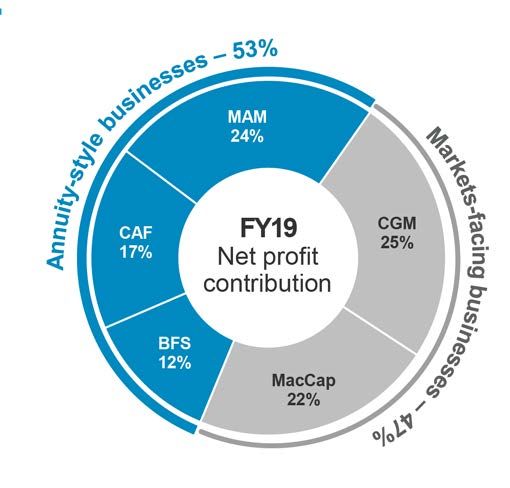
02 Overview of Result
Shemara Wikramanayake
Managing Director and Chief Executive Officer
MACQUARIE 2019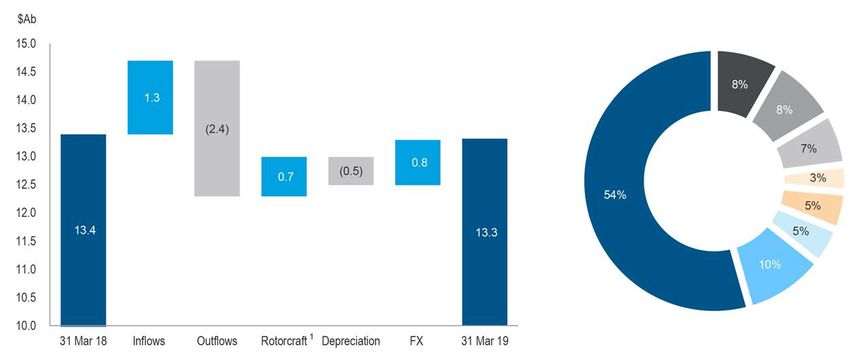
Macquarie I FY19 result announcement I macquarie.com                                                                                            Introduction           Overview of Result              Result Analysis and Financial Management                     Outlook            Appendices

About Macquarie
Annuity-style businesses                                                                                                                                                                                 Markets-facing businesses
Macquarie Asset Management (MAM)                                                                                                                                                                         Commodities and Global Markets (CGM)
•   Top 501 global asset manager with $A542.7b2 of assets under                                                                                                                                          •   Integrated, end-to-end offering across global markets including
    management, diversified across regions, products, asset                                                                                                                                                  equities, fixed income, foreign exchange and commodities
    classes and investor types                                                                                                                                                                           •   Provides clients with risk and capital solutions across physical
•   Provides investment solutions to clients across a range of                                                                                                                                               and financial markets
    capabilities, including infrastructure, real estate, agriculture,                                                                                                                                    •   Diverse platform covering more than 25 market segments, with
    equities, fixed income, private credit, liquid alternatives and                                                                                                                                          more than 160 products
    multi-asset solutions
                                                                                                                                                                                                         •   Growing presence in commodities (natural gas, LNG, NGLs,
Corporate and Asset Finance (CAF)                                                                                                                                                                            power, oil, coal, base metals, iron ore, sugar and freight)
                                                                                                                                                                                                         •   Global institutional securities house with strong Asia-Pacific
•   Global provider of specialist finance and asset management                                                                              FY19                                                             foundations covering sales, research, ECM, execution and
    solutions, with a $A21.3b2 asset and loan portfolio
•   Asset Finance delivers a range of tailored finance solutions
                                                                                                                                     Net profit                                                              derivatives and trading activities

    globally across a variety of industries and asset classes                                                                       contribution                                                         Macquarie Capital (MacCap)
•   Principal Finance provides flexible primary financing solutions                                                                                                                                      Global capability in:
    and engages in secondary market investing, across the capital                                                                                                                                        • Advisory and capital raising services, providing clients with
    structure. It operates globally in the corporate, transportation                                                                                                                                        specialist expertise, innovative advice and flexible capital
    and real estate sectors                                                                                                                                                                                 solutions across a range of sectors and products including
                                                                                                                                                                                                            investing alongside partners and clients
Banking and Financial Services (BFS)
                                                                                                                                                                                                         •   Infrastructure, green and conventional energy, focusing on
•   Macquarie’s retail banking and financial services business with                                                                                                                                          utilising balance sheet to construct assets, build businesses and
    total BFS deposits3 of $A53.4b2, Australian loan and lease                                                                                                                                               create platforms across development, construction and
    portfolio4 of $A62.5b2 and funds on platform5 of $A86.0b2                                                                                                                                                operational phases
•   Provides a diverse range of personal banking, wealth
    management, business banking and vehicle finance6 products
    and services to retail clients, advisers, brokers and
    business clients

Since 1 December 2018, certain businesses were reorganised between Operating Groups to better align businesses with a shared focus on particular customer segments and geographies. This included the transfer of Macquarie’s Australian vehicle finance business from CAF into BFS, the MSIS
business from MAM to CAF and Macquarie Capital’s global real estate business into MAM to merge with MIRA Real Estate. These changes were announced as part of Macquarie’s 1H19 results on 2 November 2018. Comparatives have been restated to reflect this reorganisation between Operating
Groups. Net profit contribution is management accounting profit before unallocated corporate costs, profit share and income tax. Pie chart is based on FY19 net profit contribution from Operating Groups as reported on 3 May 19. 1. P&I Largest Money Managers 2018. 2. As at 31 Mar 19.
3. BFS deposits exclude corporate/wholesale deposits. 4. The Australian loan and lease portfolio comprises residential mortgages, loans to Australian businesses, vehicle finance, insurance premium funding and credit cards. 5. Funds on platform includes Macquarie Wrap and Vision.
6. Includes general plant & equipment.                                                                                                                                                                                                                                                          6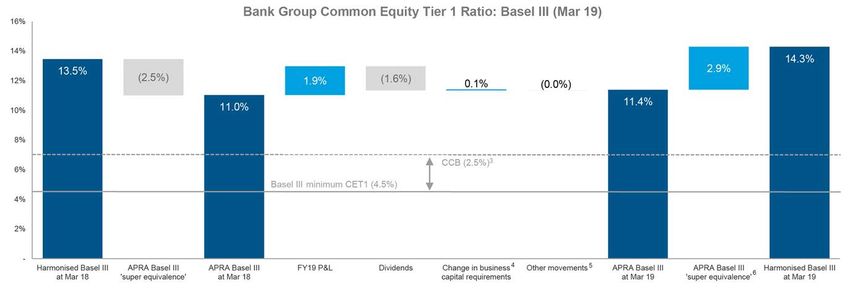
Macquarie I FY19 result announcement I macquarie.com                                                             Introduction       Overview of Result       Result Analysis and Financial Management   Outlook   Appendices

2H19 result: $A1,672m up 28% on 1H19; up 28% on 2H18
                                                                                                            2H19                1H19                     2H19 v
                                                                                                            $Am                 $Am                       1H19

   Net operating income                                                                                     6,924               5,830                      19%

   Total operating expenses                                                                                (4,762)         (4,125)                         15%

   Operating profit before income tax                                                                       2,162               1,705                      27%

   Income tax expense                                                                                       (505)               (374)                      35%
          Effective tax rate1 (%)                                                                             23.2               22.2

   Loss/(profit) attributable to non-controlling interests                                                     15                (21)

   Profit attributable to MGL shareholders                                                                  1,672               1,310                      28%

   Annualised return on equity (%)                                                                           19.5                16.3                      20%

   Basic earnings per share                                                                                $A4.95          $A3.88                          28%

   Dividend per ordinary share                                                                             $A3.60          $A2.15                          67%

1. Calculation of the effective tax rate is after adjusting for the impact of non-controlling interests.                                                                                                                  7
Macquarie I FY19 result announcement I macquarie.com                                                                                            Introduction           Overview of Result              Result Analysis and Financial Management                     Outlook           Appendices

2H19 net profit contribution from Operating Groups
$A3,544m up 36% on 1H19; up 48% on 2H18
 ANNUITY-STYLE BUSINESSES                                                                                                                                                     MARKETS-FACING BUSINESSES

 $A1,823m                                                                      25% ON 1H19                                                                                    $A1,721m                                                                     51% ON 1H19
                                                                               35% ON 2H18                                                                                                                                                                 64% ON 2H18
 MAM:               on 1H19                                                                                                                                                                        CGM:               on 1H19
 Increased combined performance fees and investment-                                                                                                                                               Strong contribution from the commodities platform driven
 related income net of impairments                                                                                                                                                                 by increased client activity and improved trading
                                                                                                                                                                                                   opportunities, partially offset by higher expenses reflecting
                                                                                                                                                                                                   increased trading activity, higher average headcount and
 CAF:              on 1H19                                                                                                                                                                         technology investment; consistent performance from fixed
 Asset Finance income lower due to fewer asset sales and                                                                                                                                           income, currencies and futures, offset by challenging
 legacy lending transaction-related expenses in 2H19;
 higher income in Principal Finance due to realisations
                                                                                                                                           2H19                                                    market conditions in equities
 including the sale of its majority stake in Energetics and                                                                          Net profit
 asset sales in Transportation Finance                                                                                              contribution                                                   Macquarie Capital:                               on 1H19
                                                                                                                                                                                                   Higher investment-related income due to asset realisations
                                                                                                                                                                                                   and increased M&A fee income from ANZ and the US,
 BFS: flat on 1H19                                                                                                                                                                                 partially offset by lower DCM and ECM fee income and
 Growth in total BFS deposits and Australian loan portfolio,                                                                                                                                       increased net credit and other impairment charges due to a
 offset by decrease in Australian vehicle finance portfolio                                                                                                                                        small number of underperforming investments
 and the impact of realigning the wealth advice business to
 focus on the high net worth segment

Since 1 December 2018, certain businesses were reorganised between Operating Groups to better align businesses with a shared focus on particular customer segments and geographies. This included the transfer of Macquarie’s Australian vehicle finance business from CAF into BFS, the MSIS
business from MAM to CAF and Macquarie Capital’s global real estate business into MAM to merge with MIRA Real Estate. These changes were announced as part of Macquarie’s 1H19 results on 2 November 2018. Comparatives have been restated to reflect this reorganisation between Operating
Groups. Net profit contribution is management accounting profit before unallocated corporate costs, profit share and income tax. Pie chart is based on 2H19 net profit contribution from Operating Groups.                                                                                      8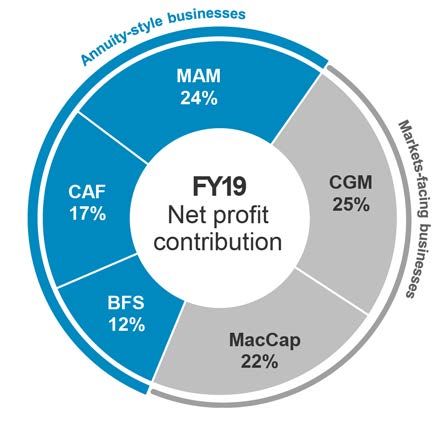
Macquarie I FY19 result announcement I macquarie.com                                                                                                   Introduction            Overview of Result         Result Analysis and Financial Management   Outlook      Appendices

FY19 result: $A2,982m up 17% on FY18
                                                                                                                                         2H19                     1H19                     2H19 v                        FY19               FY18               FY19 v
                                                                                                                                         $Am                      $Am                       1H19                         $Am                $Am                 FY18

   Net operating income1                                                                                                                 6,924                    5,830                             19%                12,754            10,920                   17%

   Total operating expenses1                                                                                                          (4,762)                  (4,125)                              15%               (8,887)            (7,456)                  19%

   Operating profit before income tax                                                                                                    2,162                    1,705                             27%                  3,867             3,464                  12%

   Income tax expense                                                                                                                    (505)                     (374)                            35%                  (879)              (883)                  -
         Effective tax rate2 (%)                                                                                                             23.2                     22.2                                                  22.8              25.7

   Loss/(profit) attributable to non-controlling interests                                                                                     15                     (21)                                                   (6)              (24)

   Profit attributable to MGL shareholders                                                                                               1,672                    1,310                             28%                  2,982             2,557                  17%

   Annualised return on equity (%)                                                                                                         19.5                     16.3                            20%                    18.0              16.8                  7%

   Basic earnings per share                                                                                                           $A4.95                   $A3.88                               28%               $A8.83             $A7.58                   17%

   Dividend per ordinary share                                                                                                        $A3.60                   $A2.15                               67%               $A5.75             $A5.25                   10%

1. Impact in FY19 from AASB 15 Revenue from Contracts with Customers of $A262m. 2. Calculation of the effective tax rate is after adjusting for the impact of non-controlling interests.                                                                                  9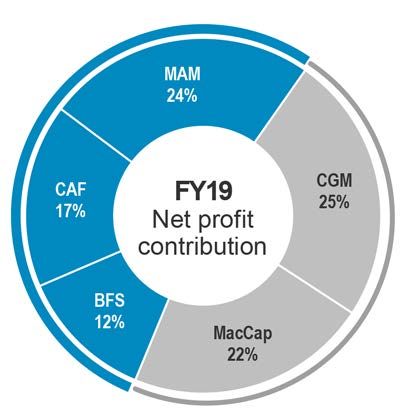
Macquarie I FY19 result announcement I macquarie.com                                                                                            Introduction           Overview of Result              Result Analysis and Financial Management                     Outlook           Appendices

FY19 net profit contribution from Operating Groups
$A6,145m up 21% on FY18
 ANNUITY-STYLE BUSINESSES                                                                                                                                                     MARKETS-FACING BUSINESSES

 $A3,287m                                                                        4% ON FY18                                                                                   $A2,858m                                                                    76% ON FY18
 MAM:               on FY18                                                                                                                                                                        CGM:                on FY18
 Increased base fees, offset by higher operating expenses                                                                                                                                          Strong performance in commodities and improved results
 and lower combined performance fees and investment-                                                                                                                                               in foreign exchange, interest rates and credit, partially
 related income                                                                                                                                                                                    offset by challenging market conditions in Cash Equities,
                                                                                                                                                                                                   increased impairments and operating expenses
 CAF:              on FY18
 Higher Asset Finance portfolio income more than offset by                                                                                                                                         Macquarie Capital:                                on FY18
 one-off investment-related income in the prior year and                                                                                                                                           Higher investment-related income due to asset
 legacy lending transaction-related expenses; higher                                                                                                                                               realisations and increased fee and commission income,
 investment-related income in Principal Finance, offset by                                                                                 FY19                                                    partially offset by higher net credit and other impairment
 lower interest income from the loan portfolio; reduced                                                                             Net profit                                                     charges and increased expenditure on green energy and
 provisions and impairments in the prior year                                                                                      contribution                                                    other projects in the development phase

 BFS:              on FY18
 Growth in Australian loan portfolio, BFS deposits and funds
 on platform, partially offset by a decline in the Australian
 vehicle finance portfolio and increased costs associated
 with investment in technology

Since 1 December 2018, certain businesses were reorganised between Operating Groups to better align businesses with a shared focus on particular customer segments and geographies. This included the transfer of Macquarie’s Australian vehicle finance business from CAF into BFS, the MSIS
business from MAM to CAF and Macquarie Capital’s global real estate business into MAM to merge with MIRA Real Estate. These changes were announced as part of Macquarie’s 1H19 results on 2 November 2018. Comparatives have been restated to reflect this reorganisation between Operating
Groups. Net profit contribution is management accounting profit before unallocated corporate costs, profit share and income tax. Pie chart is based on FY19 net profit contribution from Operating Groups.                                                                                      10
Macquarie I FY19 result announcement I macquarie.com Introduction Overview of Result Result Analysis and Financial Management Outlook Appendices
Financial performance
11Macquarie I FY19 result announcement I macquarie.com Introduction Overview of Result Result Analysis and Financial Management Outlook Appendices
Business Mix
Annuity-style businesses represent approximately 53% of the Group’s performance1
Net Profit Contribution2
Annuity-style businesses: Macquarie Asset Management Corporate Asset Finance Banking and Financial Services
Markets-facing businesses: Commodities and Global Markets Macquarie Capital
Comparative figures have been restated to conform to changes in current year financial presentation and group restructures, where necessary.
1. Based on FY19 net profit contribution from Operating Groups. 2. Net profit contribution is management accounting profit before unallocated corporate costs, profit share and income tax. 12Macquarie I FY19 result announcement I macquarie.com Introduction Overview of Result Result Analysis and Financial Management Outlook Appendices Assets under management of $A551.3b AUM increased 11% from $A496.7b at 31 March 2018 Increase due to investments made by MIRA-managed funds, foreign exchange impacts, contributions from businesses acquired during the current year and market movements, partially offset by asset realisations made by MIRA-managed funds and net flows in MIM. Note: Includes MAM, CAF and BFS AUM as at 31 Mar 19. Prior year numbers have not been restated for the reorganisation between Operating Groups. 13
Macquarie I FY19 result announcement I macquarie.com Introduction Overview of Result Result Analysis and Financial Management Outlook Appendices
Diversification by region Asia
International income 66% of total income1 Staff
Total staff2 15,715, International staff 58% of total
9%
of total income
3,746
Income
EMEA
$A1,138m
Staff
Assets under management
2,407 $A60.2b
28%
of total income
Income employing 39,000+ people4
Americas $A3,472m ASIA Manila
Bangkok Mumbai
Beijing Seoul
Staff Gurugram Shanghai
Assets under management
2,889 Hong Kong Singapore
29%
of total income
Income
$A107.5b
employing 50,000+ people4
Australia3
Hsin-Chu
Jakarta
Kuala Lumpur
Taipei
Tokyo
$A3,707m Staff
EUROPE MIDDLE EAST
Amsterdam
Braintree
Abu Dhabi
Dubai
34% 6,673
Dublin
Assets under management Edinburgh SOUTH AFRICA of total income Income
Frankfurt Cape Town
$A275.5b Geneva
London
Johannesburg $A4,235m
employing 32,000+ people4 Luxembourg
Madrid
Munich Assets under management
CANADA USA Nashville Paris
Calgary
Montreal
Austin
Boston
New York
Orlando
Reading
Vienna $A108.1b
Toronto Chicago Philadelphia Zurich employing 8,000+ people4
Vancouver Denver San Diego
Houston San Francisco
LATIN AMERICA Jacksonville San Jose AUSTRALIA Newcastle
Mexico City Los Angeles Adelaide Parramatta
Sao Paulo Minneapolis Brisbane Perth
Santiago Canberra Sydney
Gold Coast
Manly NEW ZEALAND
Melbourne Auckland
1. Net operating income excluding earnings on capital and other corporate items. 2. Includes staff employed in certain operationally segregated subsidiaries throughout the presentation 3. Includes New Zealand. 4. Includes staff employed at MIRA-managed fund assets and assets Macquarie Capital 14
has invested in.Macquarie I FY19 result announcement I macquarie.com Introduction Overview of Result Result Analysis and Financial Management Outlook Appendices
Diversification by region
66% of total income1 in FY19 was generated offshore
A 10% movement2 in AUD is estimated to have approximately a 7% impact on NPAT
Total income
1. Excluding earnings on capital and other corporate items. 2. This represents an average movement against all major currencies. 15Macquarie I FY19 result announcement I macquarie.com Introduction Overview of Result Result Analysis and Financial Management Outlook Appendices
Macquarie Asset Management
OPERATING INCOME MACQUARIE INFRASTRUCTURE MACQUARIE INVESTMENT
$A2,844m 11 % AND REAL ASSETS (MIRA)
• $A116.9b in equity under management, up 36% on Mar 18. The
MANAGEMENT (MIM)
• $A361.0b in assets under management, up 8% on Mar 18, largely
ON FY18
increase is primarily due to new equity raised, the acquisition of GLL due to foreign exchange, market movements and the acquisition
Real Estate Partners (GLL) and the merger of Macquarie Capital’s of ValueInvest
real estate business into MIRA • Acquired ValueInvest Asset Management S.A., a value-oriented
• Raised $A18.9b in new equity, including new commitments for investment manager focused on global equities with ~€4b in AUM
NET PROFIT CONTRIBUTION funds and co-investments in Europe, North America, Australia • Significant investment in MIM’s global operating platform to create a
$A1,503m 4% •
and South Korea
Invested $A10.9b2 across 13 acquisitions and 26 follow-on
platform for sustainable and scalable future growth
• Launched a number of new capabilities including
ON FY18 investments including infrastructure across Europe, the Americas and
- Macquarie Income Opportunities Fund on the ASX mFund platform
Asia, and agriculture in Australia
- Macquarie Insurance Dedicated Infrastructure Fund, a unique offering
• Equity proceeds from asset divestments3 of $A8.7b2 in Germany,
for insurance companies delivered by investment teams across MAM
Canada, New Zealand, Mexico, US, India and Russia
AUM1 - New strategies for Global Listed Real Assets and Global Natural
• $A25.5b of equity to deploy at 31 Mar 19 reflects the recent
$A542.7b 11 % •
infrastructure raisings in the US and Europe
Build out of the real estate platform to AUM $A26.8b through the
Resource equities
• In April 2019, agreed to acquire the assets related to the mutual fund
ON MAR 18 business of Foresters Investment Management Company, Inc., the
acquisition of GLL Real Estate Partners and the merger of Macquarie
investment adviser of the First Investors funds, adding $US12.3b of
Capital’s global real estate business into MIRA
AUM1 on completion. In addition, MIM chosen to manage a portion of
• Appointed as investment manager of The Infrastructure Fund (TIF), Foresters’ life insurance general account. The transaction is expected to
a $A2.5b unlisted infrastructure fund in Australia close in Q4 CY19
• No.1 infrastructure manager globally4 • 2019 Investment Manager of the Year in Australia by the Financial
Standard Investment Leadership Awards
• Received two Lipper awards and one Euro Funds award5
Note: Net profit contribution is management accounting profit before unallocated corporate costs, profit share and income tax. Pie chart is based on FY19 net profit contribution from Operating Groups.
1. As at 31 Mar 19. AUM comparative restated for MSIS, which transferred to CAF on 1 December 2018. 2. Excludes GLL and Macquarie Capital real estate business for comparative purposes 3. Equity proceeds from asset divestments differs to the impact of divestments on reported EUM which
captures a reduction of the original capital commitment at time of return of capital to investors. 4. Based on AUM. IPE Real Assets Top 50 Infrastructure Investment Managers 2018, published July/August 2018. 5. For more information and disclosures about these awards, visit: 16
https://www.macquarieim.com/mimdisclosures.Macquarie I FY19 result announcement I macquarie.com Introduction Overview of Result Result Analysis and Financial Management Outlook Appendices
Corporate and Asset Finance
OPERATING INCOME ASSET FINANCE PRINCIPAL FINANCE
$A1,631m 8 %
• Asset Finance portfolio of $A8.0b, up 2% on Mar 18 due to growth
in Technology, Energy and Ship Finance
• Principal Finance’s portfolio of $A4.1b, down 12% on Mar 18 due
to net repayments and realisations
ON FY18
• Notable deals • Transportation Finance’s portfolio of $A9.2b, up 5% on Mar 18
- Worked with the UK’s largest energy supplier to enhance their due to acquisition of rotorcraft assets in the portfolio offset by
existing smart meter facility to better match their rollout program asset depreciation
NET PROFIT CONTRIBUTION and extend the tenor of our existing financing • Notable deals
$A1,028m 10 % - Assisted in providing funding solutions for a major US telco to
assist with its ongoing network deployment
- Acquisition of a 50% interest in a portfolio of multifamily rental
properties and development pipeline in the US
ON FY18 - Arrangement and underwrite of €137.0m European airline - Acquisition of a 120 rotorcraft portfolio from Waypoint Leasing
facility financing (Ireland) Ltd
• Continued growth in mobile device finance programs with over - Sale of Principal Finance’s majority stake in Energetics, a
1.2m devices leading UK multi-utility network provider, to a European
• Continued opportunities in the ship financing market with new loans infrastructure investor
ASSET, LOAN &
TRANSPORTATION PORTFOLIO of more than $A400m being written during the year - In April 2019, Macquarie entered into a sales agreement with a
third-party investor for 25% of Macquarie Air Finance (MAF). MAF
• Continued to grow the Macquarie Infrastructure Debt Investment
will be deconsolidated and become a Macquarie-managed entity
$A21.3b FLAT
ON MAR 18
Solutions (MIDIS) business:
- Closed 21 third party investor commitments totalling $A2.8b,
for which Macquarie will earn fees for management support and
origination services
bringing total commitments on MIDIS platform to $A11.2b
• Asset quality remains sound and the portfolio continues
- Closed 21 investments totalling $A2.2b in US, UK, France, Spain to generate strong overall returns
and Australia, bringing total AUM to $A8.2b
- $A3.0b of capital to deploy as at 31 Mar 19
Note: Net profit contribution is management accounting profit before unallocated corporate costs, profit share and income tax. Pie chart is based on FY19 net profit contribution from Operating Groups. 17Macquarie I FY19 result announcement I macquarie.com Introduction Overview of Result Result Analysis and Financial Management Outlook Appendices
Banking and Financial Services
OPERATING INCOME PERSONAL BANKING BUSINESS BANKING WEALTH MANAGEMENT
$A2,103m 4 %
• Australian mortgage portfolio of $A38.5b,
up 18% on Mar 18, representing
• Business banking deposit volumes
up 8% on Mar 18
• Funds on platform2 of $A86.0b, up 4%
on Mar 18
ON FY18 approximately 2% of the Australian market • Business banking loan portfolio of $A8.2b • Expanded Macquarie Wrap managed
• Continued investment in the home up 12% on Mar 18 accounts offering, with assets under
loan origination process to improve • Total business banking clients up 4% management of $A2.3b, up from $A1.1b
customer experience on Mar 18 in Mar 18
NET PROFIT CONTRIBUTION • Macquarie Transaction Account named as a • Continued implementation of cloud-based
• Won Best Non Major Business Bank and
$A756m 3% winner in the 2019 Mozo Experts Choice
Awards for Exceptional Everyday Account.
Best Industry Specialisation awards at the
2018 Australian Business Banking Awards
investment and portfolio management
platform as part of ongoing wealth
ON FY18 Macquarie also awarded a Mozo Experts platform transformation
• Sold stake in insurance funding business,
Choice Award for Internet Banking • Awarded Outstanding Private Bank in
Macquarie Pacific Funding, to
• Macquarie Transaction Account Steadfast Group Australia in the $A10m+ category at the 2018
maintained Canstar’s 5-Star Rating Australian Business Banking Awards for the
• Ongoing focus on third party distribution with
for Outstanding Value1 second year in a row
AUSTRALIAN CLIENT NUMBERS continued growth in SME and middle market
MORE THAN cash flow lending and deposits • Named Retail Superannuation Fund of the
Year at the Roy Morgan Customer
1.5 million LEASING
Satisfaction Awards 2019
• Australian vehicle finance portfolio3 of $A15.2b, down 5% on Mar 18 due to declining new
car sales nationally, lower dealer finance and run off in previously acquired portfolio
• Macquarie Vehicle Leasing (Leasing) transferred into BFS from CAF on 1 Dec 18 and will be
fully integrated into the Personal Banking and Business Banking channels for FY20
DEPOSITS
• Total BFS deposits4 of $A53.4b, up 17% on Mar 18
− CMA deposits of $A27.2b, up 5% on Mar 18
• Awarded Best Cash and Term Deposit Accounts at the 2018 SMSF Awards and Core Data SMSF Service Provider Awards for the third
consecutive year
Note: Net profit contribution is management accounting profit before unallocated corporate costs, profit share and income tax. Pie chart is based on FY19 net profit contribution from Operating Groups.
1. Canstar 5-Star Rating for Outstanding Value Transaction Account – High transactor and low transactor profiles. 2. Funds on platform includes Macquarie Wrap and Vision. 3. Includes general plant & equipment. 4. BFS deposits exclude corporate/wholesale deposits. 18Macquarie I FY19 result announcement I macquarie.com Introduction Overview of Result Result Analysis and Financial Management Outlook Appendices
Commodities and Global Markets
OPERATING INCOME Commodity Markets Financial Markets Futures
$A3,883m 34 % (Physical & Financial) 83%1 (Primary & Secondary) 11%1
CASH EQUITIES
6%1
ON FY18
COMMODITY MARKETS FIXED INCOME & CREDIT AND EQUITY
FUTURES
AND FINANCE CURRENCIES MARKETS DERIVATIVES &
TRADING
NET PROFIT CONTRIBUTION • Strong results across the commodities • Strong result • Result up on • Result impacted by • Strong overall result
$A1,505m 65 % platform, particularly from North American
Gas and Power, Global Oil, and EMEA
across the platform
• Increased sales and
FY18 due to
continued growth
challenging market
conditions and
primarily driven
by increased
ON FY18 Gas and Power hedging activity in from settlement reduced opportunities contribution from the
• Significant contribution from the North foreign exchange financing activity • Maintained platform US and continued
American Gas and Power business driven across all regions with clients strength in Australia strength in Australia
by supply-demand imbalance across engaged in the due to client activity
• Improved client • Ongoing investment
regional US centres US corporate • Ranked No.1 Futures
demand for UK in technology
direct lending broker on the ASX5
• Increased client hedging activity and securitisations • Ranked 2nd overall for
PHYSICAL GAS MARKETER market
No.2 in North America2 •
improved trading opportunities
Gains on physical and financial
Research in 2018
Peter Lee survey of
oil trading across Europe and Australian institutional
North America investors
• Consistent contribution from Agriculture, • No.2 in Australian and
Metals and Mining New Zealand ECM4
• Increased average index volumes in
investor products business
• Ranked No.1 North America Power Dealer
of the Year3
Note: Net profit contribution is management accounting profit before unallocated corporate costs, profit share and income tax. Pie chart is based on FY19 net profit contribution from Operating Groups.
1. Percentages are based on net profit contribution before impairment charges. 2. Platts Q4 CY18. 3. 2019 Energy Risk Commodity Rankings. 4. Dealogic and Refinitiv 1 Apr 18 – 31 Mar 19. 5. Based on overall market share on ASX24 Futures volumes YTD as at 31 Mar 19. 19Macquarie I FY19 result announcement I macquarie.com Introduction Overview of Result Result Analysis and Financial Management Outlook Appendices
Macquarie Capital
OPERATING INCOME ADVISORY, CAPITAL RAISING AND BALANCE
INFRASTRUCTURE AND ENERGY INVESTMENTS
$A2,237m 53 % SHEET INVESTMENTS
Summary highlights Summary highlights
ON FY18 • Maintained the leading market position globally for infrastructure • Continued focus on green energy with over 90 projects under development
financial advisory2 or construction at 31 Mar 19
• Maintained a leading market position in ANZ across capital markets and M&A3 • Acquisition of Conergy Asia, a platform with significant capabilities in solar
• Total fee revenue up on FY18 – highlights include M&A fee revenue up in all • Total investment in green energy of $A1.1b9 at 31 Mar 19; investments
key regions, DCM fee revenue in line with a strong FY18, continued growth made of $A0.7b and investments realised of $A0.9b for FY19
NET PROFIT CONTRIBUTION from financial sponsor clients in the US and ECM fee revenue up in ANZ
$A1,353m 89 % Notable deals
Notable deals
• Green Investment Group (GIG) agreed to acquire Savion (the solar
ON FY18 • Financial adviser to Wesfarmers Limited in relation to the ~$A19b demerger of development and energy storage unit of Enel Green Power subsidiary
Coles Group Limited, the largest spin off in ASX history4 Tradewind Energy), securing a 6GW pipeline of 100+ utility-scale projects
• Exclusive financial adviser to KKR on its acquisition of BMC Software and joint and advancing GIG’s vision to create a leading US development platform.
bookrunner and joint lead arranger on the supporting $US6.6b financing The transaction is subject to regulatory approval
• Financial adviser to consortium in the £1.6b acquisition of John Laing • Realisation of Macquarie’s 21.8% interest in Quadrant Energy through the
417 TRANSACTIONS Infrastructure Fund, the first listed infrastructure fund take-private in the UK sale of 100% of the business to Santos Limited for $US2.2b
VALUED AT 461 transactions • Financial adviser to Fairfax Media Limited in relation to its ~$A3.3b merger • Co-developer, financial adviser and equity investor for the $A698m
with Nine Entertainment Co. Holdings Limited Kwinana Waste to Energy Project, the first of its kind in Australia
$A400b • Financial adviser on the sale of Erwin Hymer Group to Thor Industries, Inc in a • 100% equity sponsor and sole financial adviser building ~530 social
$A478b IN FY191 IN FY181 €1.7b cross-border transaction
• Realisation of Macquarie’s 23.9% interest in PEXA, an Australian online
housing units in Dublin for completion by 2021, followed by full
maintenance over a 27 year concession
property exchange network, through a trade sale process valuing 100% of the • Green energy realisations included Markbygden ETT (Swedish onshore
business at $A1.6b wind), Westermost Rough (UK offshore wind) and Lincs (UK offshore wind)
Awards/Ranking Awards/Ranking
• No. 1 M&A for completed deals in ANZ5 • Asia-Pacific Clean Energy Deal of the Year (Kwinana Waste to Energy)10
• No. 2 ECM in ANZ6 • Asia-Pacific Renewables Deal of the Year (Formosa 1)10
MacCap
• No. 1 Global Infrastructure Financial Adviser2 • Infrastructure and Project Finance Deal of the Year 2018 (Europe)
• No. 1 US LBO Loans Bookrunner – Software & Services7 (Markbygden Ett Wind Farm)11
22% • No. 1 Global Renewables Adviser8 • Latin America Conventional Project Finance Deal of the Year (Norte III)12
• Most Innovative Investment Bank for Infrastructure and Project Finance11
• World’s Best Investment Bank in Infrastructure sector13
Note: Net profit contribution is management accounting profit before unallocated corporate costs, profit share and income tax. 1. Source: Dealogic and IJGlobal for Macquarie Group completed M&A, investments, ECM and DCM transactions converted as at the relevant report date. Deal values reflect
the full transaction value and not an attributed value. 2. Inframation (CY18, by value and volume). 3. Dealogic (CY18, by value and volume). 4. Refinitiv (1 Apr 87 – 14 Jan 19, by “spin off”). 5. Dealogic (CY18, by volume). 6. Dealogic (CY18, by value). 7. Bloomberg (CY18, by value). 8. Inframation
(CY18, by volume). 9. Includes debt and equity balance sheet investments. 10. PFI (2018). 11. The Banker (2018). 12. PFR (2018). 13. Global Finance Awards (2019). 20Macquarie I FY19 result announcement I macquarie.com Introduction Overview of Result Result Analysis and Financial Management Outlook Appendices
Funded balance sheet remains strong
Term liabilities exceed term assets
TOTAL CUSTOMER DEPOSITS9
$A56.0b FROM MAR 18
16%
NEW TERM FUNDING10
$A13.3b RAISED SINCE
MAR 18
These charts represent Macquarie’s funded balance sheets at the respective dates noted above. For details regarding reconciliation of the funded balance sheet to Macquarie’s statutory balance sheet refer to slide 70. 1. ‘Other debt maturing in the next 12 months’ includes Structured Notes, Secured Funding,
Bonds, Other Loans, Subordinated debt maturing within the next 12 months and Net Trade Creditors. 2. ‘Debt maturing beyond 12 months’ includes Subordinated debt not maturing within next 12 months. 3. Non-controlling interests netted down in ‘Equity and hybrids’ and ‘Equity investments and PPE’ and
‘Loan assets (incl. op leases) > 1 year. 4. Hybrid instruments include Macquarie Income Securities, Macquarie Additional Capital Securities, Macquarie Capital Notes 2, 3 & 4 and Macquarie Bank Capital Notes. 5. ‘Cash, liquids and self-securitised assets’ includes self-securitisation of repo eligible Australian
assets originated by Macquarie. 6. ‘Loan Assets (incl. op lease) < 1 year’ includes Net Trade Debtors. 7. ‘Loan Assets (incl. op lease) > 1 year’ includes Debt Investment Securities. 8. ‘Equity investments and PPE’ includes Macquarie’s co-investments in Macquarie-managed funds and equity investments. 9.
Total customer deposits as per the funded balance sheet ($A56.0b) differs from total deposits as per the statutory balance sheet ($A56.2b). The funded balance sheet reclassifies certain balances to other funded balance sheet categories. 10. Issuances cover a range of tenors, currencies and product types and
are AUD equivalent based on FX rates at the time of issuance and include undrawn facilities. 21Macquarie I FY19 result announcement I macquarie.com Introduction Overview of Result Result Analysis and Financial Management Outlook Appendices
Basel III capital position
• APRA Basel III Group capital at Mar 19 of $A21.8b, Group capital surplus of $A6.1b1,2
• APRA Basel III CET1 ratio: 11.4%3; Harmonised Basel III CET1 ratio: 14.3%3,4
Group regulatory surplus: Basel III (Mar 19)
1. Calculated at 8.5% RWA including the capital conservation buffer (CCB), per APRA ADI Prudential Standard 110. 2. Based on materiality, the 8.5% used to calculate the Group capital surplus does not include the countercyclical capital buffer (CCyB) of ~10bps. The individual CCyB varies by
jurisdiction and the Bank Group’s CCyB is calculated as a weighted average based on exposures in different jurisdictions. 3. Basel III applies only to the Bank Group and not the Non-Bank Group. 4. ‘Harmonised’ Basel III estimates are calculated in accordance with the BCBS Basel III framework.
5. Includes $A0.9b issuance of Macquarie Capital Notes 4 in Mar 19, $A1.0b of Macquarie Capital Notes 3 in Jun 18 and redemption of $A0.6b of Macquarie Capital Notes in Jun 18. 6. Includes the transfer of CAF Principal Finance and CAF Transportation Finance to the Non-Bank Group.
7. Includes the foreign currency translation reserve, the share based payment reserve, MEREP and other movements. 8. APRA Basel III ‘super equivalence’ includes the impact of changes in capital requirements in areas where APRA differs from the BCBS Basel III framework and includes
differences in mortgages treatment $A0.7b; capitalised expenses $A0.4b; equity investments $A0.3b; investment into deconsolidated subsidiaries $A0.2b; DTAs and other impacts $A0.3b. 22Macquarie I FY19 result announcement I macquarie.com Introduction Overview of Result Result Analysis and Financial Management Outlook Appendices
Business growth
Business capital requirements1 FY19 KEY DRIVERS
Continuing business growth offset
$A1.5b
~$A0.9b of investments
($A0.7b) by equity investment realisations
$Ab over
net 1H19 of realisations
of ~$A0.5b over 2H19
MAM
17.0 • Investment in MIRA managed funds and
~$A0.9b of investments
$A16.4b 0.0 (0.2) 0.2 real estate offset by decrease in short-term
net of ~$A0.4b of realisations underwriting of seed assets
0.4 (0.2)
16.0 ~$A0.6b of investments
(0.5)
net of ~$A1.0b 0.0
of realisations
$A15.7b CAF
0.5 • Includes rotorcraft acquisition and principal
- investments offset by the sale of Energetics,
$A14.9b 0.1 (0.1) 0.0 0.6 ~$A0.6b of investments loan repayments and the impact of the
15.0 - transfer of CAF Principal Finance and
net of ~$A1.1b of realisations CAF Transportation Finance to the
Non-Bank Group
14.0 BFS
• Increase in mortgages and business banking
loan portfolios, partially offset by decrease
in the vehicle finance portfolio
13.0
CGM
• Increased trading activity, net of impairments
and realisation of equity positions
12.0 MacCap
• $A1.5b of investments net of $A1.5b of
realisations including sell downs of Quadrant
11.0 Energy and PEXA
Corporate
• Primarily driven by commitment for Martin
10.0 Place Metro
Mar 18 MAM CAF BFS CGM MacCap Corporate Sep 18 MAM CAF BFS CGM MacCap Corporate Mar 19
1. Regulatory capital requirements are calculated at 8.5% RWA including the capital conservation buffer (CCB), per APRA ADI Prudential Standard 110. Business growth restated to reflect the Group structure as at Mar 19. Business Group capital allocations for Mar 19 are based on 31 Dec 18
allocations adjusted for material movements over the Mar 19 quarter. 23Macquarie I FY19 result announcement I macquarie.com Introduction Overview of Result Result Analysis and Financial Management Outlook Appendices
Strong regulatory ratios
Bank Group (Mar 19)
2
1. ‘Harmonised’ Basel III estimates are calculated in accordance with the BCBS Basel III framework. 2. Average LCR for Mar 19 quarter is based on an average of daily observations. 3. Includes the capital conservation buffer in the minimum CET1 ratio requirement. In Nov 18, APRA released a draft
update to 'Prudential Standard APS 110 Capital Adequacy' proposing a minimum requirement for the leverage ratio of 3.5% effective Jan 22. 24Macquarie I FY19 result announcement I macquarie.com Introduction Overview of Result Result Analysis and Financial Management Outlook Appendices
Final dividend
2H19 ORDINARY DIVIDEND FROM FY19 ORDINARY DIVIDEND FROM
$A 3.60 $A2.15 $A $A5.25
(45% franked)
5.75 (45% franked)
(45% franked) IN 1H19 (45% franked) IN FY18
2H18 RECORD DATE FY19 ANNUAL PAYOUT RATIO
14 May 19 DRP shares for the Dividend policy
2H18 PAYMENT DATE
3 Jul 19
2H19 dividend to be
sourced on-market1 66% remains 60-80%
annual payout ratio
1. Shares may be issued if purchasing becomes impractical or inadvisable. The DRP pricing period is from 21 May 19 to 27 May 19.
25Macquarie I FY19 result announcement I macquarie.com Introduction Overview of Result Result Analysis and Financial Management Outlook Appendices
Management changes
Commodities and Global Markets (CGM)
• Effective 31 March 2019, Andrew Downe stepped down as Group Head of CGM and from the
Executive Committee. He will continue to lead the Cash Equities business globally and retain regional
leadership for CGM in Asia. Mr Downe has been with Macquarie for 37 years and on the Executive
Andrew Downe Nicholas O’Kane Committee for 22 years.
• Effective 1 April 2019, Nicholas O’Kane became Group Head of CGM, following two years of transition in
anticipation of this change. Mr O’Kane has been with Macquarie for 24 years and on the Executive Committee
since June 2017. He has extensive experience in global commodities and financial markets, leading CGM’s
global energy markets business since 2007, which in 2017 was expanded to include all commodity financing,
trading and client coverage activities across energy, metals and agriculture.
Macquarie Capital (MacCap)
• Effective 31 May 2019, Tim Bishop will step down as Group Head of Macquarie Capital and from the
Executive Committee. He will become Chairman of Macquarie Capital to assist with transition. Mr Bishop has
been with Macquarie for 20 years, on the Executive Committee for nine years and Head of Macquarie Capital
Tim Bishop for seven years.
• Effective 1 June 2019, Daniel Wong, currently Global Co-Head of the Infrastructure and Energy Group based
in London, and Michael Silverton, currently Head of the Americas, Europe and Asia Group based in New
York, will become Group Co-Heads of Macquarie Capital and join the Executive Committee. Both have been
with Macquarie for 20 years, the majority of which has been spent building the Macquarie Capital business in
Daniel Wong Michael Silverton
international markets.
2603 Result Analysis and
Financial Management
Alex Harvey
Chief Financial Officer
MACQUARIE 2019Macquarie I FY19 result announcement I macquarie.com Introduction Overview of Result Result Analysis and Financial Management Outlook Appendices
Income statement key drivers
2H19 1H19 FY19 FY18 • Net interest and trading income of $A4,551m, up 15% on FY18
$Am $Am $Am $Am – Increased contribution across CGM’s commodities platform driven by client hedging activity
Net interest and trading income 2,322 2,229 4,551 3,943 in Risk management and significant opportunities in North American Gas and Power due to
supply-demand imbalances
Fee and commission income 2,865 2,661 5,526 4,670 – Partially offset by lower interest income from CAF’s Principal Finance loan portfolio
• Fee and commission income of $A5,526m, up 18% on FY18
Net operating lease income 489 461 950 935
– Increase in base fees from investments made by MIRA-managed funds, favourable foreign
Share of net (losses)/profits of associates exchange movements, and contributions from businesses acquired during the year, and
(63) 7 (56) 241
and joint ventures higher performance fees from a broad range of MIRA-managed funds, managed accounts and
co-investors in MAM
Credit and Other impairment charges (476) (76) (552) (366) – Higher M&A and other fee income in Macquarie Capital
Investment income 1,617 485 2,102 1,233 – Increase in income following the adoption of AASB 15 ($A262m), offset by brokerage, commissions
and trading-related expenses
Other income 170 63 233 264 • Share of net losses of associates and joint ventures of $A56m, significantly down on FY18, primarily
Net operating income 6,924 5,830 12,754 10,920 reflecting a change in the composition and performance of investments in Macquarie Capital’s
portfolio, including increased expenditure on green energy and other projects in the
Employment expenses (2,763) (2,454) (5,217) (4,493) development phase
Brokerage, commissions and • Higher credit and other impairment charges compared to FY18, mainly reflecting impairment charges
(561) (579) (1,140) (830) related to a small number of underperforming investments in Macquarie Capital and specific
trading-related expenses
commodity equity positions in CGM. FY18 included the write-down of MIRA’s investment in MIC
Other operating expenses (1,438) (1,092) (2,530) (2,133) • Investment income of $A2,102m, up 70% on FY18, primarily due to higher revenue from asset
Total operating expenses (4,762) (4,125) (8,887) (7,456) realisations, particularly in the technology, green energy and conventional energy sectors in Macquarie
Capital and investment realisations in CAF Principal Finance including Energetics, partially offset by the
Operating profit before tax and non- non-recurrence of gains on reclassification of certain investments in MAM and CAF
2,162 1,705 3,867 3,464
controlling interests • Total operating expenses of $A8,887m, up 19% on FY18 mainly due to increased performance-related
Income tax expense (505) (374) (879) (883) profit share and share-based payments expense, higher average headcount, an increase in business
activity and investment in technology projects, the impact of AASB 15 adoption and unfavourable foreign
Non-controlling interests 15 (21) (6) (24) exchange movements
Profit attributable to MGL shareholders 1,672 1,310 2,982 2,557
28Macquarie I FY19 result announcement I macquarie.com Introduction Overview of Result Result Analysis and Financial Management Outlook Appendices
Operating expenses
Operating expenses excluding the impact of FX and AASB 15 are up 12%
KEY DRIVERS
• Following the adoption of AASB 15, $A262m of fee
expenses relating to stock borrowing activities and
certain recoverable costs previously presented net
of associated revenues have been reclassified to
Brokerage, commission and trading-related
expenses
• Employment expenses mainly reflect higher
performance-related expenses, increased average
headcount to support business growth and the
impact of business acquisitions
• Other mainly includes the impact of increased
business activity (such as professional fees, travel
and brokerage and commission expense), higher
technology spend, indirect tax expenses and other
one-off and legacy lending transaction-related
expenses
29Macquarie I FY19 result announcement I macquarie.com Introduction Overview of Result Result Analysis and Financial Management Outlook Appendices
Income statement by operating group
KEY DRIVERS
• MAM: Increased base and performance
fees along with reduced impairments, offset
by higher operating expenses and lower
$Am investment-related income
4,000 • CAF: Prior year included higher Asset Finance
investment-related income and reduced credit and
other impairment charges
• BFS: Strong volume growth in Lending, Deposits
3,500 and Platforms, partially offset by higher operating
and technology expenses
637 ( 663 )
• CGM: Strong performance in commodities, fixed
income & currencies and futures, partially offset
4
3,000 by lower equity trading income and higher
operating expenses
• MacCap: Strong investment-related income
595
( 55 ) and fee and commission income, partially offset by
( 112 )
2,500 19 higher net credit and other impairment charges
and increased expenditure on green energy and
other projects in the development phase
2,982
• Corporate: includes higher performance-related
2,000 2,557 expenses driven by the improved overall
performance of the Operating Groups and other
corporate expenses
1,500
FY18 NPAT MAM CAF BFS CGM MacCap Corporate Tax expense FY19 NPAT
(excl. tax
expense)
30Macquarie I FY19 result announcement I macquarie.com Introduction Overview of Result Result Analysis and Financial Management Outlook Appendices
Macquarie Asset Management
Increased base fees, offset by higher operating expenses and lower
combined performance fees and investment-related income1
KEY DRIVERS
• Base fees up due to:
– Investments made by MIRA-managed funds, favourable foreign
exchange movements, and contributions from businesses
acquired during the year (GLL and ValueInvest)
– Partially offset by asset realisations in MIRA-managed funds
• Higher performance fees with FY19 benefiting from a broad range
of MIRA-managed funds, managed accounts and co-investors
across all regions including MEIF1, MEIF3, ALX (formerly MQA),
MIP1, GIFII and KMGF
• Lower investment-related and other income compared to a strong
FY18, which included gains on reclassification of certain
investments and higher equity accounted income
• Higher operating expenses which were mainly driven by the impact
of acquisitions of GLL and ValueInvest, foreign exchange
movements and investment in MIM’s operating platform
• Lower credit and other impairment charges as FY18 included the
write-down of MIRA’s investment in MIC
1. Includes net income on equity and debt investments and share of net profits of associates and joint ventures. 2. Includes net income on equity and debt investments, share of net profits of associates and joint ventures and other income.
3. Movement excludes the impact of adopting AASB 15. 31Macquarie I FY19 result announcement I macquarie.com Introduction Overview of Result Result Analysis and Financial Management Outlook Appendices
MAM AUM movement
Increase of 11% due to FX impacts, contributions from businesses acquired during the current
year and market movements
1,2
31 Mar 18 31 Mar 19
1. Includes acquisition of GLL Real Estate Partners and the merger of Macquarie Capital’s real estate business into MIRA 2. MIRA tracks its funds under management using an EUM measure as base management fee income is typically aligned with EUM. EUM and AUM are calculated under different
methodologies and as such, EUM movement is the more relevant metric for analysis purposes – refer to MIRA EUM movement on slide 33. MIRA’s total EUM includes market capitalisation at measurement date for listed funds, the sum of original committed capital less capital subsequently returned
for unlisted funds and mandates as well as invested capital for managed businesses. AUM is calculated as proportional enterprise value at measurement date including equity value and net debt of the underlying assets of funds and managed assets. AUM excludes uninvested equity in MIRA. Refer
MD&A s7 for further information with respect to EUM and AUM measures. 32Macquarie I FY19 result announcement I macquarie.com Introduction Overview of Result Result Analysis and Financial Management Outlook Appendices
MIRA EUM movement
Increase of 36% primarily due to new equity raised, the acquisition of GLL and the merger of
Macquarie Capital’s global real estate business
$Ab
31 Mar 18 1 31 Mar 19
1.Includes GLL Real Estate Partners and The Infrastructure Fund 2. Macquarie Real Estate Investments – transferred from Macquarie Capital to MAM to merge with MIRA Real Estate 3.Committed capital returned by unlisted funds or under mandates due to asset divestments, redemption or other
capital distributions as well as capital no longer managed due to sale of management rights or expiry of asset management agreements. 4. FX reflects the movement in EUM driven by changes in FX rates. EUM is calculated using capital commitments translated at period end FX rates. Spot FX rates
are used for capital raised and returned and average FX rates are used for security price movements. 33Macquarie I FY19 result announcement I macquarie.com Introduction Overview of Result Result Analysis and Financial Management Outlook Appendices
Corporate and Asset Finance
Prior year included reduced credit and other impairment charges and higher Asset Finance
investment-related income1
KEY DRIVERS
• Higher credit and other impairment charges largely reflecting a
partial reversal of collective provisions, driven by net loan
repayments and the improved credit performance of underlying
portfolios in the prior year
• Asset Finance contribution was down from the prior year driven by
lower one-off investment-related income and legacy lending
transaction-related expenses, partially offset by increased
underlying income from the Energy, Resources and Technology
portfolios and favourable foreign exchange movements
• Principal Finance and Transportation Finance contribution driven
by higher investment-related income offset by decreased interest
income from the loan portfolio, as well as lower underlying
operating lease income
1. Investment-related income includes net income on equity and debt investments and share of net profits of associates and joint ventures. 34Macquarie I FY19 result announcement I macquarie.com Introduction Overview of Result Result Analysis and Financial Management Outlook Appendices
Corporate and Asset Finance
Asset Finance portfolio broadly in line with prior year
$Ab
1
1. Primary driver of movement is from a loan held during FY18 and syndicated in April 2018. 35Macquarie I FY19 result announcement I macquarie.com Introduction Overview of Result Result Analysis and Financial Management Outlook Appendices
Corporate and Asset Finance
Principal Finance movement in the portfolio Exposure by asset class
$Ab
Mortgages
Corporate Real Estate
Infrastructure
Health & Education
Other
Rail
Rotorcraft
Aircraft
1
1. Acquisition of a 120 rotorcraft portfolio from Waypoint Leasing (Ireland) Ltd. 36Macquarie I FY19 result announcement I macquarie.com Introduction Overview of Result Result Analysis and Financial Management Outlook Appendices
Banking and Financial Services
Strong volume growth in Lending, Deposits and Platforms
KEY DRIVERS
$Am • Higher Personal Banking income driven by 15% growth in
900 average mortgage volumes
• Higher Business Banking income driven by a 12% growth
in average business banking loan volumes and a 7%
growth in average business deposit volumes
850 ( 18 )
( 10 ) • Lower Wealth Management income associated with
realigning the wealth advice business to focus on the high
64 net worth segment, partially offset by a 7% increase in
800 ( 38 )
average funds on platform
-
( 20 ) (3)
• Bank Levy incurred for 12 months versus 9 months in the
44 prior year (effective 1 July 2017)
750
• An increase in technology expenses due to higher
development activity
700 • Higher other operating expenses driven largely by
increased professional fees, risk and regulatory costs
756
737 • Other includes lower vehicle finance income driven by a 4%
650 fall in average vehicles volumes
600
FY18 NPC Personal Business Wealth Bank Levy Technology Other Other FY19 NPC
Banking Banking Management expenses operating
income income income expenses
37Macquarie I FY19 result announcement I macquarie.com Introduction Overview of Result Result Analysis and Financial Management Outlook Appendices
Banking and Financial Services
Strong growth across the portfolio
1
Data based on spot volumes at period end. 1. Includes General Plant & Equipment. 38You can also read