Presentation to Investors - Full Year and Q4 2016 results - DSM
←
→
Page content transcription
If your browser does not render page correctly, please read the page content below

Presentation to Investors
Full Year and Q4 2016 results
ROYAL DSM
HEALTH NUTRITION MATERIALS

Safe harbor statement

   This presentation may contain forward-looking statements with respect to DSM’s future (financial) performance and
   position. Such statements are based on current expectations, estimates and projections of DSM and information
   currently available to the company. DSM cautions readers that such statements involve certain risks and uncertainties
   that are difficult to predict and therefore it should be understood that many factors can cause actual performance and
   position to differ materially from these statements. DSM has no obligation to update the statements contained in this
   presentation, unless required by law.

   More details on DSM’s Full Year and Q4 2016 performance can be found in the Full Year and Q4 2016 results press
   release, published together with this presentation. A more comprehensive discussion of the risk factors affecting DSM’s
   business can be found in the company’s latest Annual Report, which can be found on the company's corporate website,
   www.dsm.com

Page 1
Highlights | Full Year 2016
Very strong 2016, well ahead of strategic goals
Sales up 3% to €7,920m, with 4% organic growth
Adjusted EBITDA1 up 17% to €1,262m
ROCE up 280 bps to 10.4% driven by 38% increase in Adjusted EBIT1
Cash from operating activities up 27% to €1,018m
Net profit of €629m compared to €92m in 2015
Proposed dividend increase from €1.65 to €1.75 per ordinary share
Outlook 2017: DSM aims to deliver high single-digit percentage Adjusted EBITDA growth and high double-digit basis point
ROCE growth in line with the targets set out in its Strategy 2018
1 Main non-IFRS terms are explained on page 25 of this presentation and in the Press Release under 'Notes to the condensed financial statements'
Page 2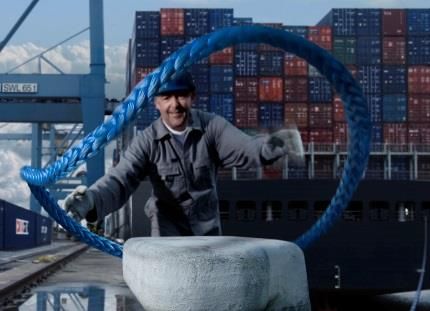
Highlights | Q4 2016 Sales up 5% to €2,015m, with 2% organic growth Adjusted EBITDA1 up 21% to €315m Nutrition: 2% organic sales growth; Adjusted EBITDA up 16% Materials: 7% volume growth; Adjusted EBITDA up 17% Cash from operating activities up 19% to €374m 1 Main non-IFRS terms are explained on page 25 of this presentation and in the Press Release under 'Notes to the condensed financial statements' Page 3
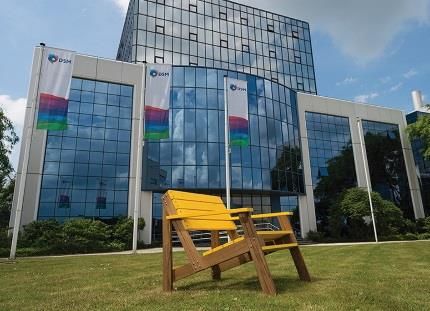
Quote from CEO Feike Sijbesma

                            “With today’s results, we are clearly delivering on the goals we set out at the end of 2015. We
                            are pleased to report a very good year, in which we achieved strong EBITDA and ROCE growth,
                            well ahead of the mid-term targets set out in Strategy 2018: Driving Profitable Growth.

                            Nutrition achieved a year of strong organic growth, in both Animal and Human Nutrition &
                            Health. The Materials transformation is apparent in strong volume and margin growth, driven by
                            our focus on specialties. In addition, we made good progress on our extensive improvement
                            programs. Besides stepping up our financial performance, we were also able to drive our
                            innovation and sustainability agenda in 2016, as well as taking further steps in anchoring the
                            organizational agility and culture that we aim at.

                            While macro-economic conditions are uncertain, we are confident that in 2017 we will again
                            deliver on our strategic objectives, despite a higher comparative base year. We will continue to
       Feike Sijbesma
     CEO / Chairman of
                            execute our growth initiatives, and we are firmly on track with our ambitious, group-wide cost
   the DSM Managing Board   and productivity improvement programs. In addition, we will maintain our disciplined approach
                            to capital allocation and working capital.”

Page 4
Key financials | Q4 and Full Year 2016

 in € million                                     Q4 2016   Q4 2015   % Change   FY 2016   FY 2015   % Change
 Sales - Continuing Operations                      2,015     1,926        5%      7,920     7,722        3%
 Adjusted EBITDA - Continuing Operations             315       261        21%      1,262     1,075       17%
 Adjusted EBITDA margin - Continuing operations     15.6%     13.6%               15.9%     13.9%
 ROCE - Continuing Operations (%)                                                 10.4%      7.6%
 Adjusted net profit - Continuing Operations         130        96        35%       520       381        36%
 Net profit - Total DSM                               87        29                  629        92
 Adjusted net EPS - Continuing Operations            0.73      0.53       38%       2.90      2.14       36%
 Net EPS - Total DSM                                 0.48      0.12                 3.52      0.45
 Cash Flow - Continuing Operations                   374       313        19%      1,018      800        27%

Page 5
Net sales development | Q4 and Full Year 2016

    in € million                    Q4 2016   Q4 2015   % Change   Volume Price/mix    FX   Other
    Sales - Continuing Operations     2,015     1,926        5%        2%        0%   2%      1%
         Nutrition                    1,321     1,264        5%        0%        2%   3%      0%
         Materials                     639        601        6%        7%       -3%   1%      1%
         Innovation Center               41        40        0%       -2%        0%   1%      1%
         Corporate Activities            14        21
         Discontinued Operations         0         0

    in € million                    FY 2016   FY 2015   % Change   Volume Price/mix   FX    Other
    Sales - Continuing Operations     7,920     7,722        3%        4%       0%    -1%     0%
         Nutrition                    5,169     4,963        4%        3%       2%    -1%     0%
         Materials                    2,513     2,528        -1%       4%       -5%   -1%     1%
         Innovation Center             167       155         7%        6%       0%    0%      1%
         Corporate Activities           71        76
         Discontinued Operations         0     1,213

Page 6
EBITDA development | Q4 and Full Year 2016 in € million Q4 2016 Q4 2015 % Change FY 2016 FY 2015 % Change Adjusted EBITDA - Continuing Operations 315 261 21% 1,262 1,075 17% Nutrition 238 206 16% 931 822 13% Materials 105 90 17% 435 384 13% Innovation Center -1 -1 1 -9 Corporate Activities -27 -34 -105 -122 Discontinued Operations 0 1 0 95 Page 7
Nutrition | Sales overview
Sales bridge – Q4 2015 to Q4 2016 Sales bridge – Full Year 2015 to Full Year 2016
1,321
-0%
-1% 5,169
2% 0%
3%
3%
2%
1,264 4,963
0%
Q4 2015 Volume Price/mix FX Other Q4 2016 FY 2015 Volume Price/mix FX Other FY 2016
Q4 2016 sales increased by 5% compared to Q4 2015
– Higher volumes in human nutrition and food specialties were offset by slightly lower volumes in animal nutrition, for
which the reported growth percentage was impacted by a tough comparison with prior year
– Prices in animal nutrition were up in a number of vitamins and premixes, while human nutrition showed a lower
price/mix
– Exchange rates had a 3% positive effect, mainly driven by a stronger US dollar and Brazilian real
Page 8Nutrition | Key financials
in € million Q4 2016 Q4 2015 % Change FY 2016 FY 2015 % Change
Sales 1,321 1,264 5% 5,169 4,963 4%
Adjusted EBITDA 238 206 16% 931 822 13%
Adjusted EBITDA margin (%) 18.0% 16.3% 18.0% 16.6%
Adjusted EBIT 160 123 30% 645 535 21%
Capital Employed 5,537 5,309
Average Capital Employed 5,375 5,192
ROCE (%) 12.0% 10.3%
Total Working Capital 1,414 1,368
Average Total Working Capital as % of Sales 28.1% 29.4%
Q4 2016 Adjusted EBITDA up 16% compared to Q4 2015, resulting from:
– Organic growth
– Contribution from the efficiency improvement and cost saving programs
– Some end of year incidental costs and marketing campaigns in human nutrition
Page 9Nutrition | DSM updated the way Nutrition results are presented
As from Q4 2016, the sales of DSM Nutrition cluster overview – 2015 Sales reported vs. New presentation
Nutritional Products are as follows:
2015 Sales reported 2015 New presentation
– Animal Nutrition & Health
– Human Nutrition & Health Nutrition Nutrition
– Personal Care & Aroma Ingredients €4,963 million €4,963 million
– Other DSM Nutritional Products DSM Nutritional Products
Main changes: €4,439 million €4,439 million
– DSM’s aroma intermediates business which Animal Nutrition & Health Animal Nutrition & Health
was reported in Human Nutrition & Health €2,359 million €2,269 million
is now reported within ‘Personal Care &
Aroma Ingredients’ Human Nutrition & Health Human Nutrition & Health
– The pharma, custom manufacturing and €1,845 million €1,741 million
services activities, which were reported
Personal Care Personal Care & Aroma Ingr.
mainly in Animal Nutrition & Health, are €172 million €316 million
now all reported within ‘Other’
Aland1 Other
The change in presentation has no
€63 million €113 million
consequences for the total sales of Nutrition
DSM Food Specialties DSM Food Specialties
€524 million €524 million
1 As with all acquisitions that are acquired within a book year, after its acquisition in 2015, Aland was reported separately in 2015. As of 2016, Aland is
reported as part of Human Nutrition & Health
Page 10Nutrition | Additional information on new presentation of segments
Personal Care had strong organic growth Nutrition cluster overview – 2015 vs. 2016 New presentation
across all segments, with good growth in the
2015 New presentation 2016 New presentation
business unit’s carefully managed global key
accounts Nutrition Nutrition
€4,963 million €5,169 million
Aroma Ingredients supplies aroma
DSM Nutritional Products DSM Nutritional Products
ingredients to the flavor and fragrance €4,439 million €4,633 million
industries. In 2016, the business showed
good performance, significantly increasing Animal Nutrition & Health Animal Nutrition & Health
its specialty ingredients portfolio, while also €2,269 million €2,399 million
reducing costs and improving efficiencies
Human Nutrition & Health Human Nutrition & Health
€1,741 million €1,823 million
The pharma, custom manufacturing and
services activities are now reported as Other Personal Care & Aroma Ingr. Personal Care & Aroma Ingr.
€316 million €337 million
Other Other
€113 million €74 million
DSM Food Specialties DSM Food Specialties
€524 million €536 million
Page 11Nutrition | Additional information on new presentation of segments
(cont’d)
2015
2,359 316
63
1,845
90 144 144
2,269 23 1,741 172
ANH Custom ANH - New HNH Aland Aroma Custom HNH - PC Reported Aroma PC & Aroma
Reported Manuf. 1 Reported Ingredients Manuf. 1 New Ingredients Ingr.
2016
2,464 1,982 337
-
65 150 150
2,399 1,823 187
9
ANH Custom ANH - New HNH Aland Aroma Custom HNH - PC Reported Aroma PC & Aroma
Reported Manuf. 1 Reported Ingredients Manuf. 1 New Ingredients Ingr.
1 Pharma, custom manufacturing and services activities
Page 12Animal Nutrition & Health | Sales overview
Sales bridge – Q4 2015 to Q4 2016 Sales bridge – Full Year 2015 to Full Year 2016
646
-
-2% 2,399
5% -
5%
7%
581 3%
2,269
-1%
Q4 2015 Volume Price/mix FX Other Q4 2016 FY 2015 Volume Price/mix FX Other FY 2016
Q4 2016 sales up 11% versus Q4 2015
– 6% organic growth mainly driven by positive price/mix
– Europe, Asia and North America delivered good volume growth, reflecting continued good market conditions,
whereas Latin America saw lower volumes
– The reported Q4 volume growth percentage was impacted by a tough comparison with Q4 2015
– Prices were up in a number of vitamins and premixes
Page 13Human Nutrition & Health | Sales overview
Sales bridge – Q4 2015 to Q4 2016 Sales bridge – Full Year 2015 to Full Year 2016
1,822
-0% 1%
-0%
2% 434
-3% -
4%
430
2%
1,742
Q4 2015 Volume Price/mix FX Other Q4 2016 FY 2015 Volume Price/mix FX Other FY 2016
Q4 2016 sales
– Good volume growth in i-Health, food & beverages and infant nutrition
– Growth was partly offset by lower volumes in vitamin C as a result of the extended maintenance stop of our plant in
China in Q3 2016
– The lower price/mix was mainly due to some special price promotion actions in dietary supplements, and a less
favorable product mix
Page 14Materials | Sales overview
Sales bridge – Q4 2015 to Q4 2016 Sales bridge – Full Year 2015 to Full Year 2016
639
-3% 1%
1%
4%
-5%
7%
2,528
2,513
601 -1% 1%
Q4 2015 Volume Price/mix FX Other Q4 2016 FY 2015 Volume Price/mix FX Other FY 2016
Page 15Materials | Sales overview (cont’d)
Q4 2016 sales were 6% higher than the same quarter last year
– Strong 7% volume growth driven by specialties on the back of continued favorable trading conditions
– Prices were 3% lower, fully reflecting the low input costs
– Seasonality effects were less pronounced than usual in Q4 2016, which is understood as demonstrating good end-use
demand in many end-markets, in combination with some stocking effects as raw material costs started to increase
DSM Engineering Plastics
– Volumes: Good volume growth in specialties versus Q4 2015, especially in automotive
– Prices were lower reflecting low input costs
DSM Resins and Functional Materials
– Volumes: Strong growth in all business lines compared to Q4 2015, especially benefitting from improving conditions in
the European building & construction markets, the Chinese markets for sustainable waterborne coating resins, and
continued strong performance in Functional Materials
– Prices reflected low input costs
DSM Dyneema
– Sales up significantly compared to Q4 2015, driven by strong growth in life protection, especially for law enforcement
Page 16Materials | Key financials
in € million Q4 2016 Q4 2015 % Change FY 2016 FY 2015 % Change
Sales 639 601 6% 2,513 2,528 -1%
Adjusted EBITDA 105 90 17% 435 384 13%
Adjusted EBITDA margin (%) 16.4% 15.0% 17.3% 15.2%
Adjusted EBIT 77 54 43% 311 250 24%
Capital Employed 1,807 1,723
Average Capital Employed 1,772 1,734
ROCE (%) 17.6% 14.4%
Total Working Capital 280 225
Average Total Working Capital as % of Sales 12.5% 14.8%
Q4 2016 Adjusted EBITDA increased by 17% compared with Q4 2015
– Result of disciplined margin management, strong growth in the specialty segments, and the benefits of the efficiency and cost saving
programs carried out over recent years
– Input costs were still at a low level versus prior year
The Adjusted EBITDA margin of 16.4% in Q4 2016 was below the level of approximately 18% seen in the previous two quarters
– In part due to slightly higher input costs, and incidental costs, amongst others relating to DSM’s activities at the site in Augusta (USA)
Page 17Innovation Center | Key financials
in € million Q4 2016 Q4 2015 % Change FY 2016 FY 2015 % Change
Sales 41 40 0% 167 155 7%
Adjusted EBITDA -1 -1 1 -9
Adjusted EBIT -9 -14 -24 -43
Capital Employed 576 560
For the full year 2016, the Innovation Center made good progress with 6% organic growth
– Fully driven by higher volumes in both DSM Biomedical and DSM Advanced Surfaces
– Profitability clearly improved due to a combination of organic growth, more focused innovation and reduction of
costs
Adjusted EBITDA in 2016 achieved break-even, in line with the ambition of Strategy 2018
Q4 2016 sales and Adjusted EBITDA stable compared to Q4 2015
Page 18Corporate Activities | Key financials
in € million Q4 2016 Q4 2015 FY 2016 FY 2015
Sales 14 21 71 76
Adjusted EBITDA -27 -34 -105 -122
Adjusted EBIT -38 -48 -141 -169
Full year 2016 Adjusted EBITDA improved by €17 million compared to 2015
– Driven by higher result at DSM’s captive insurance company, as well as the execution of cost savings and efficiency
improvement programs in DSM’s support functions
Q4 2016 Adjusted EBITDA improved by €7 million compared to Q4 2015
– Prior year result of DSM’s captive insurance company was negatively impacted by a claim related to a warehouse fire
at the Chemelot site in Sittard-Geleen (Netherlands)
Page 19Net result contribution of joint ventures / associates | Overview
in € million Q4 2016 Q4 2015 FY 2016 FY 2015
DSM Sinochem (50%) 1 1 6 8
Patheon (33.5%) 11 68 222 56
ChemicaInvest (35%) 0 -12 -9 -14
Other -13 -9 -25 -20
Total share of the profit of
-1 48 194 30
associates/joint control entities
DSM held a 49% stake in Patheon until the end of Q2 2016. Following the IPO of Patheon NV in Q3 2016, this became
33.5%
In 2016, the share of Patheon’s contribution to DSM’s net result includes the €232 million gain from IPO related
transactions
Page 20Key joint ventures and associates | Financial overview
in € million, based on 100% Q4 2016 Q4 2015 % Change FY 2016 FY 2015 % Change
DSM Sinochem Sales 102 86 19% 431 418 3%
Adjusted EBITDA% 15% 16% 14% 14%
1
Patheon Sales 570 421 35% 1,786 1,621 10%
Adjusted EBITDA% 22% 23% 20% 23%
2
ChemicaInvest Sales 502 391 28% 1,802 756 n.a.
Adjusted EBITDA% 13% -4% 6% 0%
DSM Sinochem Pharmaceuticals (50% DSM) - Good EBITDA growth in 2016, as well as in Q4 2016. This was the result of
increased sales from several new product launches, a solid performance in its core antibiotics business, and supported
by improved efficiencies
Patheon (34% DSM) – Good results for the year, as well as for Q4 ending 31 October 2016, as reported in their Annual
report (10-K form) published on 23 December 2016
ChemicaInvest (35% DSM) – Mixed results over 2016, with weak performance in the first half of the year due to
suppressed caprolactam results. Q4 showed improved caprolactam results. Acrylonitrile and Composite Resins continued
to deliver good results
1 Patheon (formerly reported as DPx Holding) respective periods are for the 4th quarter from 1 August – 31 October and for YTD from 1 November – 31 October.
2015 restated for comparative purposes
2 ChemicaInvest in 2015 refers to the period from 1 August – 31 DecemberCash Flow development
Cash flow Average Working Capital%
in € million Q4 20161 Q4 20151 FY 20161 FY 20151
40%
2015 2016
EBITDA 270 236 1,146 1,046 29.4% 28.1%
Change in Working Capital 82 137 -89 -12 30%
Income Tax -23 -12 -77 -75 20.7%
Other 45 -47 38 -263 18.6%
20%
14.8%
Cash from Operating Activities 374 314 1,018 696 12.5%
of which provided by Continuing Operations 374 313 1,018 800
10%
Cash from Investing Activities2 -144 -238 -258 -273
Free Cash Flow from Operations 230 76 760 423
0%
1) DSM - Total (incl. discontinued operations)
Total DSM Nutrition Materials
2) Excl. changes in fixed-term deposits, incl. acquisitions
Cash flow from operating activities amounted to €374 million in Q4 2016 showing an improvement of €61 million
compared to Q4 2015. Full year cash flow from operating activities increased by 27% from €800 million to €1,018 million
Total Working Capital amounted to €1,481 million year-end 2016 compared to €1,343 million at the end of
2015, which represents 18.4% as a percentage of annualized Q4 sales (year-end 2015: 17.4%)
– The increase of 1% was for 0.4% related to operating working capital and 0.6% related to non-operating working
capital following lower cash-related liabilities to joint ventures
– On average, the working capital as a percentage of net sales amounted to 18.6% in 2016 (20.7% in 2015)
Page 22Net debt and ROCE development
Net debt ROCE
3,000 20% 2015 2016
17.6%
2,420 2,321
14.4%
2,070 15%
2,000 12.0%
10.4% 10.3%
10% 7.6%
1,000
5%
0 0%
2014 1 2015 1 2016 Total DSM Nutrition Materials
Net debt decreased by €251 million compared to the end of 2015 and stood at €2,070 million
– The decrease was mainly due to the receipt of dividend and proceeds from the secondary offering of Patheon
amounting to a total of €235 million
ROCE up 280 bps to 10.4% (vs. 7.6% in 2015) driven by 38% increase in Adjusted EBIT
1 Before reclassification to held for sale
Page 23Dividend proposal to AGM: Increase dividend to €1.75 per ordinary share
Dividend per ordinary DSM share - €
Dividend policy “stable and preferably rising”
2.00 6.0% Reflecting its confidence in the financial performance of the
1.75
1.80 1.65 1.65 1.65 company, DSM proposes to increase the dividend
1.50 5.0%
1.60 1.45 Proposal to the AGM on 3 May 2017: Increase dividend from
1.40
4.0% €1.65 to €1.75 per ordinary share in 2016
1.20
– €0.55 interim dividend (paid in August 2016)
1.00 3.0%
0.80 – €1.20 final dividend (payable 26 May 2017)
2.0%
0.60 The dividend will be payable in cash or in the form of ordinary
0.40
1.0%
shares, at the option of the shareholder
0.20
– A maximum of 40% of the total dividend amount is available
0.00 0.0% for stock dividend
2011 2012 2013 2014 2015 2016
proposal – Dividend in cash will be paid after deduction of 15% Dutch
Dividend yield (based on average share price) dividend withholding tax
The ex-dividend date is 5 May 2017
Page 24Reconciliation to Alternative Performance Measures | Overview
In presenting and discussing DSM’s financial position, operating Reconciliation to Alternative Performance Measures
results and cash flows, DSM uses certain alternative performance in € million Q4 2016 Q4 2015
measures (‘APMs’) not defined by IFRS Cont. Discont.
operations operations
Cont. Discont.
Total operations operations Total
EBITDA 270 0 270 230 6 236
These APMs are used in order to provide important measures of Acquisitions/divestments
Restructuring costs
2
43
0
0
2
43
1
36
-5
0
-4
36
DSM’s business development and management performance, and Other
Sub-total EBITDA adjustments
0
45
0
0
0
45
-6
31
0
-5
-6
26
should be used as supplementary information in conjunction with Adjusted EBITDA 315 0 315 261 1 262
IFRS measures Operating profit (EBIT) 139 0 139 36 14 50
Adjustments to EBITDA 45 0 45 31 -5 26
Impairments of PPE and Intangible assets 6 0 6 48 -8 40
In light of the European Securities and Markets Authority (‘ESMA’) Sub-total adjustments to operating profit (EBIT) 51 0 51 79 -13 66
guidelines on APMs, DSM has updated the way these APMs are Adjusted operating profit (EBIT) 190 0 190 115 1 116
presented Net profit 87 0 87 32 -3 29
Adjustments to operating profit (EBIT) 51 0 51 79 -13 66
Adjustments to financial income and expense 0 0 0 0 0 0
Henceforth, material items of profit or loss that management Income tax related to adjustments
Adjustments to share in result associates
-13
5
0
0
-13
5
-17
2
14
0
-3
2
deems necessary to adjust to measure operational performance will Sub-total adjustments to net profit
Adjusted net profit
43
130
0
0
43
130
64
96
1
-2
65
94
be referred to as ‘APM Adjustments’, resulting in the APMs
Net profit available to holders of ordinary shares 86 0 86 29 -8 21
‘Adjusted EBITDA’ and ‘Adjusted net profit’ in line with common Adjustments to net profit 43 0 43 64 1 65
practice Adjusted net profit available to holders of ordinary shares 129 0 129 93 -7 86
Average number of ordinary shares (million) 175.9 174.9
Earnings per share (EPS) (in €):
Net earnings per share 0.48 0.00 0.48 0.17 -0.05 0.12
Adjusted net earnings per share 0.73 0.00 0.73 0.53 -0.04 0.49
Page 25Update on Strategy 2018 | Driving Profitable Growth
Strategy 2018: Driving Profitable Growth
Two headline High single-digit percentage High double-digit basis point
financial targets annual Adjusted EBITDA growth annual ROCE growth
2016 achievements: 2016 achievements:
17% 280 bps
Clear actions identified to Businesses aim to outpace €250-300m cost reduction & Consistent improvements in
achieve targets market growth efficiency improvements capital efficiency
2016 achievements: 2016 achievements: 2016 achievements:
Nutrition On track: ~€110m
Cash from operating
5% organic growth cumulative savings by activities up 27%
Materials
year-end 2016 Capex at €475m,Businesses aim to outpace market growth | Growth projects in Nutrition
are delivering
Nutrition Strategy 2018 and 2016 milestones
1 Expand the core
2
– New vitamin B6 plant and
expansion of the gellan-gum
and pectin facilities all in
China;
1
3 4
2 Add new products and solutions
Excellence in execution
– Product offering broadened
e.g. eubiotics for antibiotic-
free poultry;
2016
Organic growth: 5% – Good progress in the
“GreenOcean” and
EBITDA growth: 13.3%
“CleanCow” projects;
ROCE: 12.0%
Page 28Businesses aim to outpace market growth | Growth projects in Nutrition
are delivering (cont’d)
Nutrition Strategy 2018 and 2016 milestones
3 Expand in new segments/regions
2
– Launch of MEG-3® Ultra allowing for
varieties of (high-concentrate) DHA
and EPA;
1
3 4
– Successful expansion of fast-growing
Excellence in execution
i-health consumer line of products
outside of the US;
4 New business models
2016 – Business to farmer (B2F) network
Organic growth: 5% expanded with new brand
(YiWeiZhuang) and new mobile order
EBITDA growth: 13.3%
platform
ROCE: 12.0%
Page 29Businesses aim to outpace market growth | Materials stepped up its
transformation towards a more specialty portfolio
Materials Strategy 2018 and 2016 milestones
For DSM’s specialty materials, DSM is using new
High Accelerated
growth
Functional
technologies and (sustainable) customer solutions
to accelerate growth:
Materials
High-Performance
Growth PA6 Plastics Solar1
Compounds
Biomedical1
Maximize – Engineering Plastics
Market growth
Specialty Coating Dyneema Fiber
PA6
returns Resins Solutions
Polymers
Powder
Coating Resins
• Used in new ultra-thin USB Type-C
Dyneema Life
Protection
connectors
- Engineering Plastics - Resins & Functional Materials
- Dyneema - Emerging Business Areas
ForTii®
Low DSM’s capability to extract value High PA4T
• Launch of next-generation high-
temperature polyamides PPS
PA46
2016
PA410
PA6, PA66
Volume growth: 4% • New high-performance thermoplastic
EBITDA growth: 13.3% copolyester
ROCE: 17.6%
Page 30Businesses aim to outpace market growth | Materials stepped up its
transformation towards a more specialty portfolio (cont’d)
Materials Strategy 2018 and 2016 milestones
– Dyneema
High Accelerated
Functional
growth Materials
High-Performance
• Launch of Dyneema® Carbon hybrid
Growth PA6
Compounds
Plastics Solar1
composite, offering the low weight, high
Biomedical1
Maximize strength qualities of carbon fiber without
Market growth
Specialty Coating Dyneema Fiber
PA6
returns
Polymers
Resins Solutions
the characteristic of shattering
Powder
Coating Resins
Dyneema Life
Protection
- Engineering Plastics - Resins & Functional Materials – Resins & Functional Materials
- Dyneema - Emerging Business Areas
Low DSM’s capability to extract value High
• Good progress with sustainable waterborne
coatings for marine containers in China;
2016
Volume growth: 4% • High acceptance of powder and waterborne
EBITDA growth: 13.3% coatings in Europe
ROCE: 17.6%
Page 31Ambitious improvement programs firmly on track
Cost savings: total €250-300m by 2018 Timing of cumulative cost savings
~€m Realized Forecast
Nutrition 400
Program
€130-150m 300
DSM-wide (by 2018)
support 200
functions ~110
€125-150m 100
Materials ~25
(by end 2017)
0
2015 2016 2017 2018
DSM is rigorously executing its ambitious cost reduction and efficiency improvement programs across the company
The plans are firmly on track to reach the overall savings of €250-300 million by 2018 (vs. the 2014 baseline)
Page 32FTE reduction on track and one-time costs within budget
Cumulative FTE reduction1 One-time costs
5,000 Realized Forecast Realized Forecast
~4,400
400
4,000
300
3,000
200
2,000
900-1,100 ~80 ~80
1,000 ~675 100 ~70
0 0
Total FTE in Support 2016 Reduction target 2015 2016 2017
Functions (vs. 2014 base)
(2014 baseline)
FTE reduction in service organization on track to reach target:
– FTE reduction up to and incl. FY2016 is ~675 FTE vs. an ambition of 900-1,100 FTE (end of 2017)
One time restructuring costs in 2016 amounted to ~€80m
1 Vs. 2014 baseline
Page 33DSM-wide savings in support functions & staff | Strong progress made with
globally leveraging support functions at lower costs
Savings: €125-150m1
Progress (%) Remarks Actual 2015/2016 Forecast 2017/ Run Rate EoY
Shared Services Improvement Plan completed, incl. shift of most activities to Global Service Centre in
Support
India
Funct. Finance 65 35
Finance Regions (EMEA, North America, Asia) staffed and operational in Financial, Commercial &
Operations Control
Shared Services operational and payroll outsourced
HR 85 15
Updated processes and tools for talent development, career review, recruitment, learning & development
IT Operating Model defined and related FTE reductions announced, implementation has started
IT 50 50
Standardization/outsourcing of personal workplaces and other saving initiatives realized
75 25 Supplier base rationalization, FTE reduction and related savings in external spend progressing well
Ind. Sourcing
85 15 Global external & internal Communications function fully operational across regions and business groups
Comms
Supplier rationalization in (Marketing-)Communications progressing well
30 70 One Shared Services Organization with Global Delivery Centre in India and satellite in China live
Shared Services
One multi-functional Service Desk and Portal in development
Funct.
Operating Models implemented (FTE reduction of ~40%); good progress in implementing new mandates
Excell.
Regional organizations brought in line with new DSM Operating Model; Finance, HR implementing Functional Operating Models
Regions
1 Vs. 2014 baseline
Page 34Nutrition-specific improvement program | Overall program running well
with purchasing savings being ahead of plan and cost-reductions on track
Savings: €130-150m1
Cost improvements (recap) Work streams closely monitored and on track
Current status: Actions Financial benefits
Purchasing Purchasing savings so far
exceeding target, helped by low
commodity prices
Efficiency Purchasing
gains Fixed cost Cost reduction programs are
(Yield & reduction being executed. Remaining part
Energy) will be captured in the upcoming
period
Throughput Program on track, planned
gains benefits end of 2016 realized.
Fixed cost Target gains are expected to be
reduction secured
(~100 FTE) Efficiency Program on track, planned
gains benefits end of 2016 realized.
Target gains are expected to be
Throughput gain in sold-out units secured
1 Vs. 2015
Page 35DSM maintains its disciplined approach to capital allocation
Capital efficiency is a key driver of cash generation; in 2016 we undertook a number of improvement projects in this
area throughout DSM
– One of these has been to take a more integrated approach to business planning, in particular in our Nutrition cluster
– Holistically addressing processes instead of approaching them as a series of individual steps has resulted in clear
improvements in inventory management, production and distribution efficiencies.
Driving financial performance Reducing working capital1 Strict capital allocation
Cash from operating activities Average Total Working Capital better Capex €475m below €500-550m
(continuing operations) up 27% than aspiration levelDSM has stepped up its sustainability aspirations1
Key sustainability focus areas
Nutrition
Climate change and renewable energy
Circular and bio-based economy
Sustainability as Business Growth Driver
Brighter Living Solutions: ECO+ and People+ 2016
Eco+ People+ Profitable solutions better for people and planet
Aspiration: 65% of DSM products by 2020 63%
Securing Sustainable Operations
Operational Aspirations Long-term goals 2016
Leading in reporting benchmarks Gold class DJSI Gold class
GHG and Energy
Health & Safety GHG efficiency improvements 40-45% (2008-2025) 23%
Efficiency Energy efficiency improvements >10% (2016-2025) 2%
Engagement
Renewable Purchased electricity from renewables 50% by 2025 8%
Diversity
energy Employee engagement favorable score 75% by 2020 71%
Safety: Frequency recordable index 0.25 by 2020 0.33
1 Please see DSM’s Annual Report for definitions and additional information
Page 37In 2016, DSM launched the ‘Brighter Living Solutions’ program in order to
steer products and innovations that are better for people and the planet
Examples of ‘Brighter Living Solutions’
Uralac® Ultra Dyneema® heavy marine ropes Pack-Age®
Coating solutions for Ropes for mooring and Moisture-permeable
furniture that gets heavy- towing tankers and other membrane that allows
duty use ships cheese to ripen naturally
Uralac® technology uses less The ropes are up to 30% Replaces conventional
water and energy along the lighter compared to cheese ripening methods
life cycle than comparable polyester, resulting in such as coatings without any
alternatives reduced emissions and easier need for additional
to handling than traditional preservatives
alternatives made of steel Also prevents cheese losses
wire during the ripening time and
processing of cheese
Page 38Key joint ventures and associates | Overview
DSM Sinochem Pharmaceuticals (50%) Patheon (34%) ChemicaInvest (35%)
Pharma - Antibiotics Pharma - Contract Manufacturing Bulk Chemicals
JV with Sinochem created in 2011 Created in 2014, when DSM ChemicaInvest includes the former
when Sinochem took a 50% combined DSM Pharmaceutical (bulk chemical) activities of DSM in
interest in DSM Anti-Infectives Products with JLL Partners’ caprolactam, acrylonitrile and
Patheon in return for a 49% stake composite resins in which DSM still
Global leader in generic anti-
holds a 35% stake (65% owned by
infective molecules selling raw Produces a unique breadth of
CVC Capital Partners)
materials, intermediates, offerings from finished dosage
(enzymatic beta-lactam) APIs and (drug products) to active
finished dosage substances (APIs)
In € million at 100% 2016 In € million at 100% 20161 In € million at 100% 2016
Sales 431 Sales 1,786 Sales 1,802
Adjusted EBITDA% 14% Adjusted EBITDA% 20% Adjusted EBITDA% 6%
1 Book year 1 November until 31 October. Based on continuing operations
Page 39Key business/innovation projects driving earnings growth beyond 2018
DSM has set itself strategic targets for the period to 2018. At the same time, we are also preparing for further longer-
term growth
Range of key business and innovation projects across the clusters will drive earnings growth beyond 2018 and we will
continue to develop more initiatives in light of market dynamics
Nutrition Materials Emerging Business Areas
Vitamers (high-potency vitamins) ForTii® (HPPO polymer) 3D options (combine Somos/Resins,
New infant ingredients Niaga® (recycle carpets) Biomedical & Engineering Plastics)
New bio colorants (blue/red) Ultra (low-temp. powder coating) New Bio-Medical products
Stevia (sweetener) Decovery ® (bio-based resins) Solar materials
Hydrocolloids (texture) Apparel (Dyneema® textile apps) Bio-based Products & Services
Proteins for the future Force multiplier technology
New skin solutions (Personal Care) (light personal protection)
India B2C businesses
i-Health (B2C nutrients)
New premix solutions
Eubiotics (cultures)
New enzymes
Clean Cow (feed ingredient)
Algae-based Omega-3 for aquaculture
Page 40You can also read