Presentation to Investors - H1 2017 results ROYAL DSM - MarketScreener
←
→
Page content transcription
If your browser does not render page correctly, please read the page content below

Presentation to Investors
H1 2017 results
ROYAL DSM
HEALTH NUTRITION MATERIALS

Safe harbor statement

 § This presentation may contain forward-looking statements with respect to DSM’s future (financial) performance and
   position. Such statements are based on current expectations, estimates and projections of DSM and information
   currently available to the company. DSM cautions readers that such statements involve certain risks and uncertainties
   that are difficult to predict and therefore it should be understood that many factors can cause actual performance and
   position to differ materially from these statements. DSM has no obligation to update the statements contained in this
   presentation, unless required by law.

 § More details on DSM’s H1 2017 performance can be found in the H1 2017 results press release, published together with
   this presentation. A more comprehensive discussion of the risk factors affecting DSM’s business can be found in the
   company’s latest Annual Report, which can be found on the company's corporate website, www.dsm.com

Page 1

Highlights H1 2017

 § Continued good performance in Q2 concludes very strong H1
 § Sales up 11% to €4,320m, with 8% organic growth
 § Adjusted EBITDA up 16% to €721m, driven by both Nutrition and Materials
 § ROCE up 170 bps to 12.2%
 § Net profit up 42% to €312m
 § Interim dividend of €0.58 per ordinary share
 § Outlook 2017: slightly improved: DSM now expects to deliver full-year 2017 results above the targets set out in its
   Strategy 2018, with an EBITDA growth for the year moving slightly up from high single-digit to double digit, and with a
   ROCE increase moving from double digit basis points to over 100 basis points

Page 2
Highlights Q2 2017

 § DSM reports a very good Q2
 § Sales up 8% to €2,161m, with 6% organic growth
 § Adjusted EBITDA up 15% to €376m
 § Nutrition: 4% organic sales growth; Adjusted EBITDA up 14%
 § Materials: 4% volume growth; Adjusted EBITDA up 9%

Page 3
Quote from CEO Feike Sijbesma

                            § DSM maintained its positive momentum with a very strong first half-year performance. The
                              second quarter was another very good quarter.

                              Halfway through Strategy 2018, we are well ahead of our targets. All businesses are delivering
                              on their growth initiatives, helping us outpace the market; we increasingly provide our
                              customers with innovative solutions, resulting in a continued shift toward specialties.
                              Furthermore, we are fully on track with our wide-ranging cost-reduction and efficiency
                              improvement programs, while anchoring the high-performance culture we strive for. We also
                              continued to make good progress with our sustainability agenda, future-proofing our
                              operations and delivering products and solutions which help our customers to make their
                              businesses more sustainable. The expected Patheon transaction demonstrates our commitment
       Feike Sijbesma         to monetize the significant value within our associates and earlier than anticipated.
     CEO / Chairman of
   the DSM Managing Board
                              While being mindful of the volatile macro-economic environment and the higher-base results
                              achieved since 2015, we are confident for the remainder of the year and have increased our
                              outlook for the full year.”

Page 4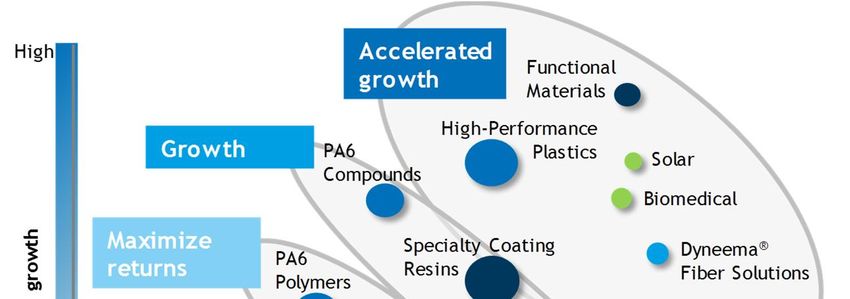
Group | Key financials

         in € million             H1 2017   H1 2016   % Change   Q2 2017   Q2 2016   % Change
         Sales                      4,320     3,907       11%      2,161     1,994        8%
         Adjusted EBITDA             721       624        16%       376       328        15%
         Adjusted EBITDA margin     16.7%     16.0%                17.4%     16.4%
         ROCE (%)                   12.2%     10.5%
         Adjusted net profit         338       244        39%       175       135        30%
         Net profit - Total DSM      312       220        42%       163       135        21%
         Adjusted net EPS            1.90      1.36       40%       0.98      0.76       29%
         Net EPS - Total DSM         1.75      1.22                 0.91      0.76
         Cash Flow                   329       319         3%       133       182        -27%

Page 5
Group | Net sales development

  in € million             H1 2017   H1 2016   % Change   Volume Price/mix   FX   Other
  Sales                      4,320     3,907       11%        6%       2%    3%     0%
    Nutrition                2,778    2,545         9%        5%       1%    3%     0%
    Materials                1,426    1,240        15%        8%       5%    1%     1%
    Innovation Center           84       83         1%        6%       -6%   1%     0%
    Corporate Activities        32       39

  in € million             Q2 2017   Q2 2016   % Change   Volume Price/mix   FX   Other
  Sales                      2,161     1,994        8%        4%       2%    2%     0%
    Nutrition                1,380     1,295        7%        4%       0%    3%     0%
    Materials                 725       640        13%        4%       7%    1%     1%
    Innovation Center           41       40         3%        9%       -7%   1%     0%
    Corporate Activities        15       19

Page 6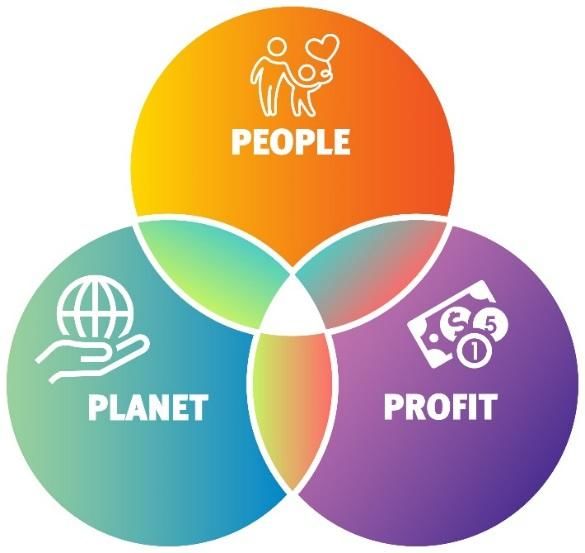
Group | EBITDA development

         in € million             H1 2017   H1 2016   % Change   Q2 2017   Q2 2016   % Change
         Adjusted EBITDA             721       624        16%       376       328        15%
           Nutrition                 528       462        14%       271       237        14%
           Materials                 241       212        14%       128       117         9%
           Innovation Center           1         1                     0         0
           Corporate Activities       -49       -51                  -23       -26

Page 7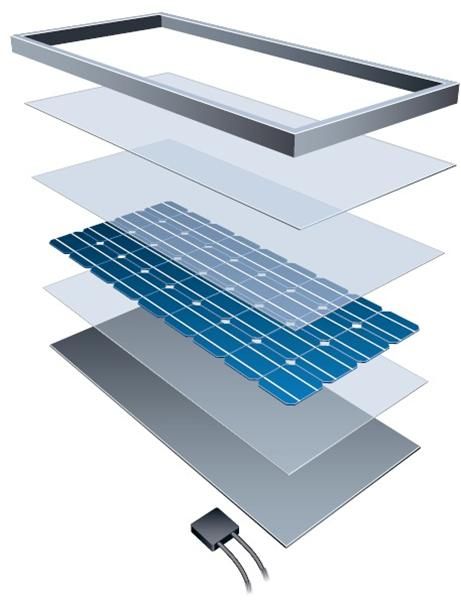
Nutrition | Sales overview

Sales bridge | H1 2016 to H1 2017                             Sales bridge | Q2 2016 to Q2 2017
                                                   2,778                                                          1,380
                                           0%                                                            0%
                                 3%                                                            3%
                       1%                                                             0%

             5%                                                             4%

  2,545                                                          1,295

 H1 2016   Volume   Price/mix    FX      Other    H1 2017      Q2 2016    Volume   Price/mix   FX       Other   Q2 2017

 § Nutrition is well on track towards its aspirations as outlined in Strategy 2018:
   – Continued strong momentum of delivering above-market growth with an increasingly higher-value portfolio of feed
     and food solutions
   – Productivity, market clout and profitability are being supported by the improvement programs, covering cost
     reduction, operational excellence, and sales
   – Growth and profitability initiatives have enabled Animal Nutrition to continue to grow well despite the economic
     malaise in Latin America, while bringing Human Nutrition back to a solid growth footing

Page 8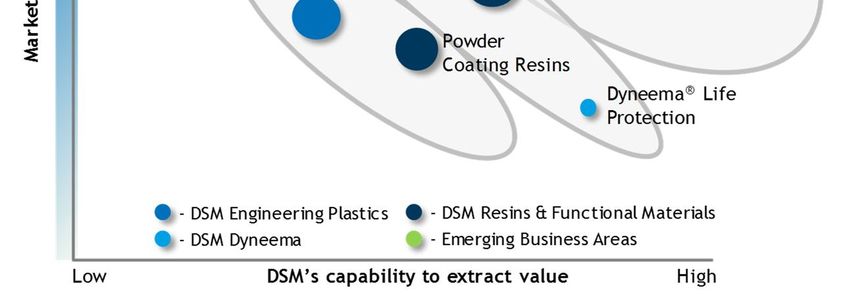
Nutrition | Key financials

              in € million                                  H1 2017   H1 2016   % Change   Q2 2017   Q2 2016   % Change
              Sales                                           2,778     2,545        9%      1,380     1,295        7%
              Adjusted EBITDA                                  528       462        14%       271       237        14%
              Adjusted EBITDA margin (%)                     19.0%      18.2%                19.6%     18.3%
              Adjusted EBIT                                    383       326        17%       198       165        20%
              Capital Employed                                5,431     5,391
              Average Capital Employed                        5,508     5,317
              ROCE (%)                                       13.9%      12.3%
              Total Working Capital                           1,548     1,470
              Average Total Working Capital as % of Sales    27.6%      27.8%

 § Q2 2017 Adjusted EBITDA was €271 million, up 14% compared to Q2 2016
   – Driven by solid organic growth, favorable currencies and the execution of the profit improvement programs

 § Adjusted EBITDA and Adjusted EBITDA margin benefited in Q2 from highly favorable mix effects in Human Nutrition
   with a relatively high share of high-margin businesses

Page 9
Animal Nutrition & Health | Sales overview
Sales bridge | H1 2016 to H1 2017 Sales bridge | Q2 2016 to Q2 2017
1,263 629
0% 0%
4%
3%
3%
0%
4% 2%
1,138 598
H1 2016 Volume Price/mix FX Other H1 2017 Q2 2016 Volume Price/mix FX Other Q2 2017
§ Animal Nutrition continued to make good progress with its growth programs, outperforming underlying global growth in animal
protein markets
– Business conditions for animal nutrition remained good across most regions in H1 2017, with the exception of Latin America
• The ongoing meat scandal in Brazil further dampened conditions in that region, where business was already pressured by the
weak economic backdrop
§ Q2 2017 volumes were up 2%
– Excluding the effect of the ongoing meat scandal in Brazil of around €20 million on Q2 sales, volumes would have been up 5%,
in line with DSM’s growth trend in recent years
§ Prices in Q2 were overall stable when compared to the same period last year
– Positive 3% exchange rate effect was driven by USD and BRL, partly offset by the weaker CNY
Page 10Human Nutrition & Health | Sales overview
Sales bridge | H1 2016 to H1 2017 Sales bridge | Q2 2016 to Q2 2017
1,019 507
0% 0%
3% 2%
-1% -1%
7% 7%
934 467
H1 2016 Volume Price/mix FX Other H1 2017 Q2 2016 Volume Price/mix FX Other Q2 2017
§ The initiatives undertaken at Human Nutrition over the last couple of years, including reorganizing and refocusing the
commercial organization, have given these businesses clear growth momentum
– Seven consecutive quarters of good growth including a strong first half of 2017 across all regions and market
segments
§ In Q2 2017, Human Nutrition reported a strong 7% volume growth
– Highly favorable mix due to strong sales in its premix, i-Health and fish oil-based omega-3
§ Prices were slightly down in Q2, with the anticipated lower contractual prices in Early Life Nutrition
Page 11Materials | Sales overview
Sales bridge | H1 2016 to H1 2017 Sales bridge | Q2 2016 to Q2 2017
1,426 725
1% 1%
1% 1%
5%
7%
8%
4%
1,240 640
H1 2016 Volume Price/mix FX Other H1 2017 Q2 2016 Volume Price/mix FX Other Q2 2017
§ Materials continued to make solid progress in executing its strategy in H1 2017
– The differentiated approach focusing on specialties has provided a clear strategic framework to outpace market
growth
§ Q2 2017 sales were 13% higher than Q2 2016 with 11% organic growth including 4% higher volumes
Page 12Materials | Sales overview (cont’d)
§ DSM Engineering Plastics showed strong sales growth in its high-performance specialty plastics
– Good demand in automotive in Europe and Asia, while automotive in the US showed some signs of weakening in the
second quarter
– Demand in electrical & electronics was good
§ DSM Resins & Functional Materials continued to benefit from above-average market growth driven by its increasingly
specialty, sustainable product portfolio
– Coating resins benefited from improved demand for powder and waterborne coating solutions in the European
building and construction markets
– Demand in China for waterborne solutions for maritime container coatings continued to develop strongly
– Strong demand for fiber-optic materials, where DSM further improved its position
§ DSM Dyneema saw an increased demand in H1 2017 from the markets for materials for personal protection, both for law
enforcement and civilian use
– The commercial marine markets, which have been soft in recent years, showed a promising recovery in H1 2017, with
increased demand for ultra-strong fishing nets for sustainable aquaculture
Page 13Materials | Key financials
in € million H1 2017 H1 2016 % Change Q2 2017 Q2 2016 % Change
Sales 1,426 1,240 15% 725 640 13%
Adjusted EBITDA 241 212 14% 128 117 9%
Adjusted EBITDA margin (%) 16.9% 17.1% 17.7% 18.3%
Adjusted EBIT 177 148 20% 96 86 12%
Capital Employed 1,807 1,775
Average Capital Employed 1,815 1,751
ROCE (%) 19.5% 16.9%
Total Working Capital 353 312
Average Total Working Capital as % of Sales 12.2% 12.2%
§ Q2 2017 Adjusted EBITDA was €128 million, up 9% compared to Q2 2016
§ The Adjusted EBITDA margin in Q2 2017 was 17.7%
– Price increases implemented to offset the higher input costs
– This robust performance underlines the structural improvements achieved in the quality of returns in the Materials
businesses over recent years
Page 14Innovation | Key financials
in € million H1 2017 H1 2016 % Change Q2 2017 Q2 2016 % Change
Sales 84 83 1% 41 40 3%
Adjusted EBITDA 1 1 0 0
Adjusted EBIT -12 -10 -7 -5
Capital Employed 592 559
§ DSM Biomedical reported stable H1 sales when compared to the same period last year
– The comparison is impacted by the discontinuation of a large contract. Excluding this impact, business developed
well in the first half of the year
§ DSM Advanced Solar continued to show good growth
– In H1 2017, DSM acquired Suzhou Sunshine New Materials Technology, active in high performance solar photovoltaic
back sheets. This technology acquisition supports DSM in its commercialization of a portfolio of innovations focused
on lowering the cost of solar energy by providing solid, durable and sustainable materials solutions
§ In Q2 2017, higher sales volumes in Biomedical and Advanced Solar were offset by a less favorable price/mix, related
to the above-mentioned discontinuation of a contract in Biomedical
Page 15Corporate Activities | Key financials
in € million H1 2017 H1 2016 Q2 2017 Q2 2016
Sales 32 39 15 19
Adjusted EBITDA -49 -51 -23 -26
Adjusted EBIT -70 -68 -31 -35
§ H1 Adjusted EBITDA slightly improved compared to H1 2016, as a result of the progress in cost savings being
implemented
Page 16Key joint ventures/associates | Financial overview
in € million, based on 100% H1 2017 H1 2016 % Change Q2 2017 Q2 2016 % Change
DSM Sinochem Sales 217 226 -4% 107 114 -6%
Adjusted EBITDA% 15% 15% 14% 14%
ChemicaInvest Sales 996 892 12% 461 437 5%
Adjusted EBITDA% 8% 2% 7% 0%
§ DSM Sinochem Pharmaceuticals (50% DSM) showed slightly lower sales with stable margins
§ ChemicaInvest (35% DSM) showed improved results with top-line growth and higher margins driven by better market
conditions and a lower cost base
Page 17Joint ventures/associates | Net result contribution
in € million H1 2017 H1 2016 Q2 2017 Q2 2016
DSM Sinochem (50%) 4 4 1 1
Patheon (33.5%) 1 9 -21 2 -9
ChemicaInvest (35%) 0 -10 0 -7
Other associates / joint ventures -14 -9 -10 -4
Total share of the profit of
-1 -36 -7 -19
associates/joint ventures
§ As of 15 May, DSM announced that it entered into an agreement regarding the sale of its shares in Patheon to Thermo
Fisher Scientific
– This will result in proceeds of USD 1.7 billion for DSM
– The transaction expected to be completed by the end of 2017
– Patheon’s net result contribution in Q2 includes the period 1 February 2017 until 15 May 2017, which is the date of
the tender offer. Per the same date, Patheon was classified as an asset held for sale
– This expected monetization is earlier than anticipated in our Strategy 2018
1. In H1 2016, DSM’s share in Patheon was 49%
Page 18Cash flow and Working Capital | Overview
Cash Flow, Capital Expenditures and Financing Average Working Capital %
40%
YTD YTD H1 2016 H1 2017
in € million H1 2017 H1 2016 Q2 2017 Q2 2016
30% 27.8% 27.6%
Cash from Operating Activities 329 319 133 182
Total Working Capital 1,591 1,481 18.9%
20% 18.3%
Total Working Capital as % of Sales 18.4% 18.6%
12.2% 12.2%
Capital Expenditure (cash, net of customer funding) 250 177 120 78
10%
Net Debt 2,205 2,466
0%
Total DSM Nutrition Materials
§ Cash flow from operating activities amounted to €329 million in H1 2017, which was slightly higher than H1 2016
§ Total Working Capital amounted to €1,591 million at the end of Q2 2017 compared to €1,481 million at the end of Q2
2016
– The higher working capital reflected the higher level of sales (18.4% as a percentage of annualized Q2 sales, which
was somewhat below Q2 2016)
Page 19Net debt and ROCE | Overview
Net debt ROCE
3,000 25%
H1 2016 H1 2017
2,466 19.5%
2,205 20%
16.9%
2,000 13.9%
15% 12.2% 12.3%
10.5%
10%
1,000
5%
0 0%
H1 2016 H1 2017 Total DSM Nutrition Materials
§ Net debt amounted to €2,205 million compared to €2,466m end of June 2016
– The decrease of €261 million was mainly due to the proceeds from the secondary offering of Patheon in total of €219
million in Q3 2016
§ ROCE up 170 bps to 12.2% (vs. 10.5% in H1 2016)
Page 20Interim dividend proposal | DSM will pay an interim dividend of €0.58 per
ordinary share for 2017
§ Dividend policy “stable and preferably rising” Dividend per ordinary share - €
§ DSM will pay an interim dividend of €0.58 per ordinary
share for 2017 2.00 6.0%
1.75
– As usual, this represents one third of the total dividend 1.80 1.65 1.65 1.65
5.0%
for the previous year 1.60 1.45 1.50
– The interim dividend should not be taken as an 1.40
4.0%
indication of the total dividend for the year 2017 1.20
1.00 3.0%
§ The interim dividend will be payable in cash or in the form
0.80
of ordinary shares, at the option of the shareholder 0.58 2.0%
0.60
– A maximum of 40% of the total dividend amount is 0.40
available for stock dividend 1.0%
0.20
– Dividend in cash will be paid after deduction of 15% 0.00 0.0%
Dutch dividend withholding tax 2011 2012 2013 2014 2015 2016 2017
interim
§ The ex-dividend date is 3 August 2017
Dividend yield (based on average share price)
– The interim dividend will be payable as from 24 August
2017
Page 21Update on Strategy 2018 | Driving Profitable Growth ROYAL DSM HEALTH NUTRITION MATERIALS
Strategy 2018 | Summary and 2016 achievements

   Two headline                    High single-digit percentage    High double-digit basis point
   financial targets               annual Adjusted EBITDA growth   annual ROCE growth

   Achievements to date:           § 2016:        17%              § 2016:         280 bps
                                   § H1 2017:     16%              § H1 2017:      170 bps1

    Clear actions identified to    Businesses aim to outpace       €250-300m cost reduction &      Consistent improvements in
    achieve targets                market growth                   efficiency improvements         capital efficiency

    Achievements to date:          Nutrition organic growth        § On track: ~€150m              § Cash from operating
                                   § 2016:         5%                cumulative savings by           activities up 27% in 2016
                                   § H1 2017:      6%                end of H1 20172                 and 3% again in H1 2017
                                                                                                   § Total Working Capital
                                   Materials volume growth                                           end of H1 2017 at 18.4%,
                                   § 2016:        4%                                                 better than aspiration
                                   § H1 2017      8%                                                 level
Nutrition | Essential nutritional ingredients for animal feed & human food
Nutrition | Value proposition Nutrition | Strategy 2018
§ Increase the nutritional content of feed and food
§ Enable feeding a growing global population with
the scarce natural resources available
New products
&
§ Reduce the ecological footprint of producing food solutions
through biotechnology e.g. enzymatic
fermentation
Expand
the core
Grow in Access new
underpenetrated segments/ new
species/ categories business models
Excellence in execution
Page 24Nutrition | ‘Sustainable solutions’ for food and feed drive ‘above market
growth’ aspiration
People
§ Feeding a growing more urban, global
population
§ Ensuring healthier food, promote well-being
at all ages and avoid diseases
§ End hunger, combat malnutrition
Planet Profit
§ Addressing scarcity of natural § Sustained mid-single digit sales
resources growth
§ Reducing eco-footprint from § Above average margins, reflecting
producing animal proteins higher value of sustainable
solutions to customers / end-users
§ Improving yields in food & feed
production
Page 25Nutrition | Outpacing market growth through sustainable solutions in
Animal Nutrition
In line with Nutrition Strategy 2018, Animal Nutrition is growing profitably by expanding its core, creating new products
and solutions, by growing in underpenetrated categories/ regions, and by accessing new segments/ new business
models, all via innovative, sustainable solutions
Ø Portfolio of alternative feed solutions to help Ø Eubiotics for more efficient digestion has
eliminate antibiotics as growth promotor immense impact on performance
Ø Better milk efficiency and financial returns via Ø Business to farmer (B2F) network expanded
RONOZYME® RumiStar™ with new brand (YiWeiZhuang)
Ø Improve protein digestibility, while also
reducing nitrogen excretion
Page 26Nutrition | Outpacing market growth through sustainable solutions in
Human Nutrition
In line with Nutrition Strategy 2018, Human Nutrition is growing profitably by expanding its core, creating new products
and solutions, by growing in underpenetrated categories/ regions, and by accessing new segments/ new business
models, all via innovative, sustainable solutions
Ø Natural ingredients with specific health benefits Ø i-Health probiotic consumer products incl. the
such as: newly added UP4™ Probiotics consumer brand
– Fruitflow® , contributing to healthy blood flow
Ø Partnership with MedDay to treat progressive
– A bioactive oat beta-glucan to reduce blood multiple sclerosis using D-Biotin
cholesterol levels
Ø MEG-3® Ultra; allowing for varieties of (high-
– Unique range of yeast extracts that reduce salt
concentrate) DHA and EPA for hart and brain
and ‘repair’ mouthfeel
health
Page 27Materials | High quality, specialty materials portfolio
Materials | Value proposition Materials | Strategy 2018
§ Replacing existing materials (e.g metals,
hazardous materials) with sustainable alternatives
offering better performance in combination with
reduced ECO footprint
– Offering innovative lightweight,
environmentally friendlier, safer and high-
performance solutions meeting stricter
regulations and customer demand
§ Enabling affordable solar and bio-based energy,
supporting move to a low carbon economy
§ DSM’s ability to innovate is key
Page 28Materials | Driving substitution growth with higher-value, more
sustainable specialty products
People
§ Safer, responsible production, handling,
application
§ Addressing high demanding customer needs
§ Providing highest performance
Planet Profit
§ Reducing water and energy use § Sustained mid-single digit sales
(e.g. fossil fuels), enabling lower growth
GHG emissions, reducing carbon
§ Above average margins,
footprint
reflecting higher value of
§ Addressing scarcity of natural sustainable solutions to
resources customer/end-users
§ Replacing hazardous materials
Page 29Materials | Outpacing market growth through sustainable solutions in
Materials
§ DSM Engineering Plastics § DSM Dyneema
– Next generation high-temperature polyamides – Lighter ropes, slings, cargo nets and fishing nets for
and high-performance thermoplastics for fuel efficiency
better, smarter, safer, lighter cars
– Ropes that overcome abrasion, bending fatigue,
compression and creep fatigue to prevent rope
failure (and increase safety)
– Smart solutions for electronic components that
are faster, thinner, stronger and more planet – Dyneema® Anti Stab, Soft Ballistics and Diamond
friendly technology help make life/ work safer
Page 30Materials | Outpacing market growth through sustainable solutions in
Materials (cont’d)
§ DSM Resins & Functional Materials § DSM Biomedical
– Leading the substitution push from solvent to – Biomedical materials that speed up recovery,
water and other sustainable coatings shorten hospital stays, and in turn lower health costs
and help people to lead longer, healthier and more
active lives
– DeSolite® Supercoatings deliver outstanding
performance and reliability
in the most demanding applications
§ DSM Advanced Solar
– Increasing the yield of sustainable solar panels
• Acquisition of Suzhou SunShine technology
– More efficient and effective prototyping with
enables high-performance solar photovoltaic (PV)
Somos® Taurus for elevated temperature 3D
backsheets based on co-extrusion technology
printed parts applications
Page 31Sustainable solutions will continue to drive earnings growth beyond 2018
§ DSM has set itself strategic targets for the period to 2018. At the same time, we are also preparing for further longer-
term growth
§ Range of key business and innovation projects across the clusters will drive earnings growth beyond 2018 and we will
continue to develop more initiatives in light of market dynamics
Nutrition Materials Emerging Business Areas
§ Fermentative § ForTii® (HPPO § 3D options (combine
stevia polymer) Somos, Resins, Biomedical
§ Algae-based omega-3 & Engineering Plastics)
for aquaculture § Niaga® (recycle
carpets) § Advanced solar
§ Clean cow
materials
§ Decovery® (bio-based
§ Hydrocolloids
resins)
§ Eubiotics § Bio-based products
§ Apparel (Dyneema® and services
§ i-Health textile apps)
(B2C nutrients)
§ New bio colorants § Force multiplier technology
§ New bio-medical products
(blue/red) (light personal protection)
Page 32Cost savings & efficiency | Driving profitable growth supported by cost
reduction and efficiency improvement programs
Cost savings: total €250-300m by 2018 Timing of cumulative cost savings
~€m Realized Forecast
Nutrition 400
Program
€130-150m 300
DSM-wide (by 2018)
support 200
functions ~110
€125-150m 100
Materials ~25
(by end 2017)
0
2015 2016 2017 2018
§ DSM is rigorously executing its ambitious cost reduction and efficiency improvement programs across the company
§ Cost reduction/efficiency improvement programs target overall savings of €250-300m by 2018
§ The plans are on track to deliver the targeted benefits, with current run rate of ~€150m in gross savings achieved vs.
the base line 2014
Page 33Cost savings & efficiency | FTE reduction on track and one-time costs
within budget
Cumulative FTE reduction1 One-time costs
~€m ~€m
5,000 Realized Forecast Realized Forecast
~4,400
250
4,000
200
3,000
150
2,000 100 ~80 ~80 ~70
900-1,100
1,000 ~840 50
0 0
Total FTE in Support H1 2017 Reduction target 2015 2016 2017
Functions (vs. 2014 base)
(2014 baseline)
§ FTE reduction in service organization on track to reach target:
– FTE reduction up to and incl. H1 2017 is ~840 FTE vs. an ambition of 900-1,100 FTE (end of 2017)
§ One time restructuring costs in H1 2017 amounted to ~€26m
1. Vs. 2014 baseline
Page 34Cost savings & efficiency | DSM-wide support functions & staff costs
efficiency program continues to run on track, near end of the program
Savings: €125-150m1
Progress (%) Remarks Achieved by end of H1 2017 Remaining 2017/ Run Rate EoY
§ Shared Services Improvement Plan completed, incl. shift of most activities to Global Service Centre in
Support
70 30 India
Funct. Finance § Finance Regions staffed and operational
§ Implementation of cross-business, standardized reporting systems on track
§ Shared Services operational and payroll outsourced
HR 90 10 § HR transformation program done; HR integration in Shared Service organization by end of year
§ Updated processes and tools for talent development, career review, recruitment, learning & development
§ New IT model in implementation phase (60% of transfer realized)
IT 60 40 § Standardization/outsourcing of personal workplaces and other saving initiatives realized
75 25 § Supplier base rationalization, FTE reduction and related savings in external on schedule to be finalized by
Ind. Sourcing
year-end
95 § Global external & internal Communications function fully operational across regions and business groups
Comms 5
§ Supplier rationalization in (Marketing-)Communications progressing well and close to target
§ One Shared Services Organization with Global Delivery Centre in India and satellite in China live
Shared Services 50 50 § One multi-functional Service Desk and Portal and Performance Management & Reporting being
Funct. implemented
Excell. § Operating Models implemented (FTE reduction of ~40%); good progress in implementing new mandates
Regions § Regional organizations brought in line with new DSM Operating Model; Finance, HR and IT implementing Functional Operating Models globally
1. Vs. 2014 baseline
Page 35Cost savings & efficiency | Nutrition-specific improvement program
running well: purchasing savings ahead of plan and cost-reductions on track
Savings: €130-150m1
Cost improvements Work streams closely monitored and on track
Current status as per end H1 2017: Actions Financial benefits
Purchasing § Purchasing savings so far
exceeding target
Efficiency Purchasing
gains
(Yield &
Fixed cost § Cost reduction programs are
Energy) reduction being executed. Remaining part
will be captured in the upcoming
period
Fixed cost Throughput § Program on track and 2017 target
reduction gains confirmed
(~100 FTE)
Efficiency § Program on track and 2017 target
gains confirmed
Throughput gain in sold-out units
1. Vs. 2015
Page 36Capital efficiency | Disciplined approach to capital allocation
§ Capital efficiency is a key driver of cash generation; in 2016 we undertook a number of improvement projects in this
area throughout DSM
– One of these has been to take a more integrated approach to business planning, in particular in our Nutrition cluster
– Holistically addressing processes instead of approaching them as a series of individual steps has resulted in clear
improvements in inventory management, production and distribution efficiencies.
Driving financial performance Reducing working capital1 Strict capital allocation
§ Cash from operating activities up 3% § Average Total Working Capital better § Cash capex at €250m in line with
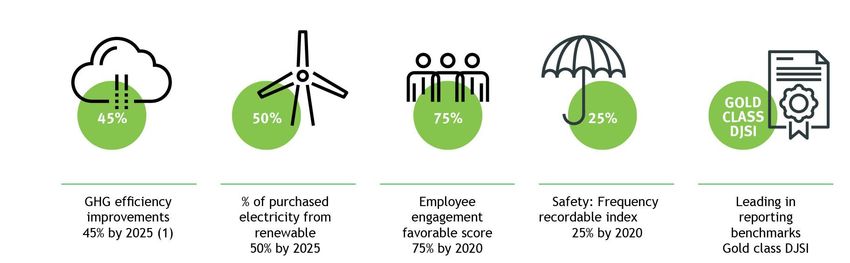
vs. H1 2016 than aspiration levelDSM’s strategy is well aligned with the UN Sustainable Development Goals: Identified 5 SDGs on which we believe can be most influential Page 38
Stepping-up sustainability aspirations on our own operations

 § Sustainability actions in DSM’s own operations – uniformly applied to our operations around the globe – result improved
   eco footprint and in lower risks and lower cost

                                                                                                           Leader in
                                                                                                         Sustainalytics

1. Relative improvement as compared to baseline 2008

Page 39
As a result, sustainability agenda is core to DSM’s business strategy1
Key sustainability focus areas
Climate & Circular & bio-
Nutrition
energy based economy
Sustainability as business growth driver
Brighter Living Solutions: ECO+ and People+1 H1 2017
ECO+ People+ § Profitable solutions better for people and planet
§ Aspiration: 65% of DSM products by 2020 63%
Securing sustainable operations
Operational Aspirations1 Long-term goals H1 2017
§ Leading in reporting benchmarks Gold class DJSI Gold class
GHG and Energy
Health & Safety § GHG efficiency improvements 40-45% (2008-2025) 27%
Efficiency § Energy efficiency improvements >10% (2016-2025) 5%
Engagement
Renewable § Purchased electricity from renewables 50% by 2025 19%
Diversity
energy § Employee engagement favorable score 75% by 2020 71%2
§ Safety: Frequency recordable index 0.25 by 2020 0.35
1. Please see DSM’s Integrated Annual Report 2016 for definitions and additional information
2. 2016 score; employee engagement will be measured again in Q3 2017
Page 40DSM Investor Seminar 2017 Delft/The Hague - 25 September 2017 ROYAL DSM HEALTH NUTRITION MATERIALS
Page 42
You can also read