Presentation to the Public-Private Infrastructure Forum
Killarney Country Club

Thursday 21 June 2012
←
→
Page content transcription
If your browser does not render page correctly, please read the page content below
Presentation to the Public-Private Infrastructure Forum Killarney Country Club Thursday 21 June 2012
Contents

           ▪ Overview of the Market Demand Strategy (MDS)
                Context and summary
                Financial Position
                Funding
                Infrastructure Spend
                Capacity creation
                Job creation
                Skills and development
                Localisation

           ▪ Port Planning
           ▪ Rail Planning
           ▪ Capital Implementation Plans
           ▪ Detail on Mega Capital Projects
           ▪ Alignment with planning and policy processes in Government

                                                                          PAGE 1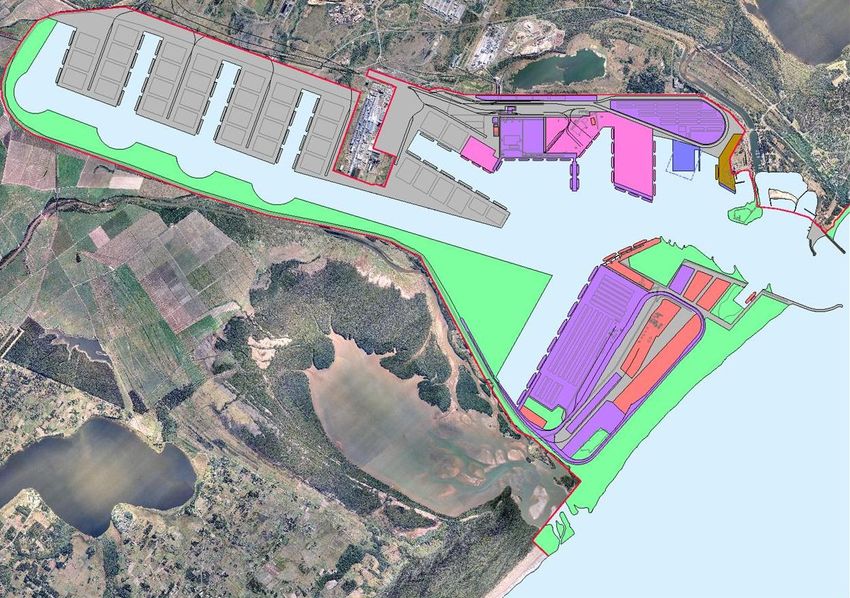
Market Demand Strategy
R300bn capital investment programme
Expanding rail, port and pipeline infrastructure
Increase in capacity to meet market demand
Continued financial stability and strength
Significant productivity and operational efficiency improvements
Shift from road to rail – reducing the cost of doing business and carbon
emissions
Enabling economic growth
Job creation, skills development, localisation, empowerment and
transformation opportunities
PAGE 2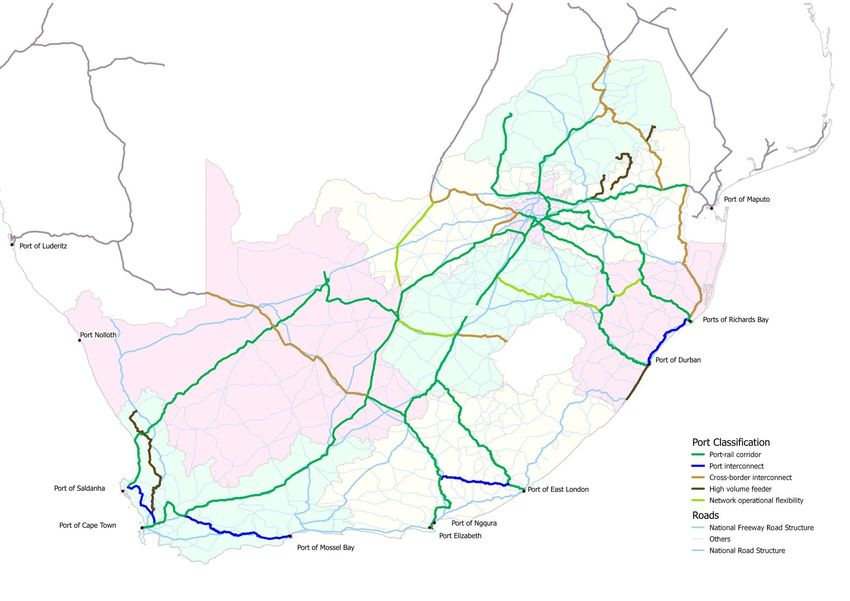
Based on Transnet's solid foundations,
it aims to capture identified growth
opportunities over the next 7 years

                                                                     300
               Capital investment (Rbn)               118
                                                                                +154%
  Enablers                                        Last 7 years   Next 7 years

               Personnel („000 FTEs)                                            +25%

               TFR Export coal (mt)                                             +44%

                                                                     83
               TFR Export iron ore (mt)               53                        +57%
  Volume
  Highlights                                                         170
               TFR GFB (mt)                           80                        +113%

               Maritime Containers                                  7,646
                                                     4,344                      +76%
               („000 TEUs)

                                                                     128
               Revenue (Rbn)                          46
                                                                                +178%
                                                                     68
  Financial    EBITDA (Rbn)                           19
  Highlights                                                                    +258%

               Cashflows from                                        51
               operating activities (Rbn)             16                        +219%

                                                  2011/12 LE       2018/19

  X%    Total growth    2011/12 Latest estimate
                                                                                        PAGE 3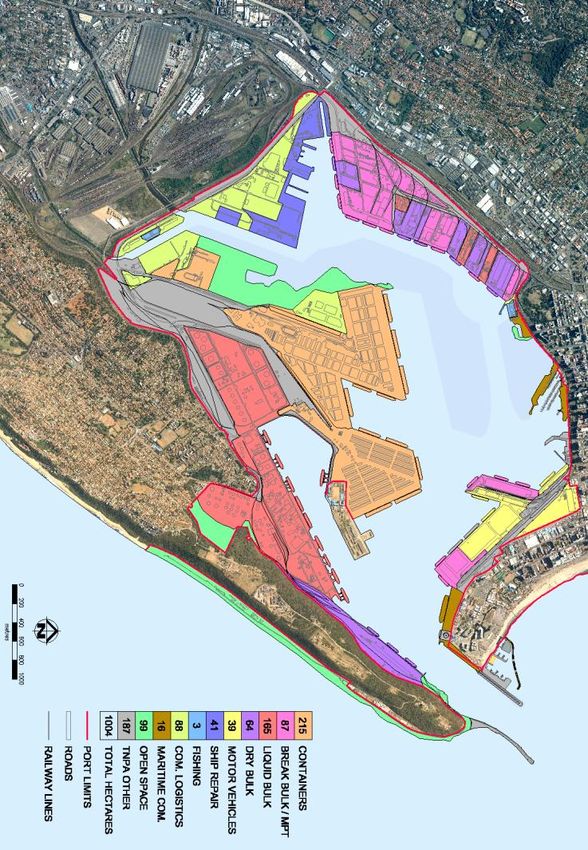
Transnet will maintain a solid financial position
and credit rating

   EBITDA margin (%)                                                       ROTA (%)*

                            50,9        54,9   54,9   53,3   53,6                                    13,4   13,3   13,0   13,3
                    48,2                                                                      11,5
     41,2    41,8
                                                                                  8,5
                                                                                        9,9                                      ≥12,2%
                                                                    >40%    7,3

    11/12 12/13 13/14 14/15 15/16 16/17 17/18 18/19                        11/12 12/13 13/14 14/15 15/16 16/17 17/18 18/19
     LE                                                                     LE

   Gearing (%)*                                                            Cash interest cover (times)

            45,5    47,3    47,0    46,1
                                                                    3,0X

    11/12 12/13 13/14 14/15 15/16 16/17 17/18 18/19                        11/12 12/13 13/14 14/15 15/16 16/17 17/18 18/19
     LE                                                                     LE

  * Excludes Ports Regulator Clawback                                                                                               PAGE 4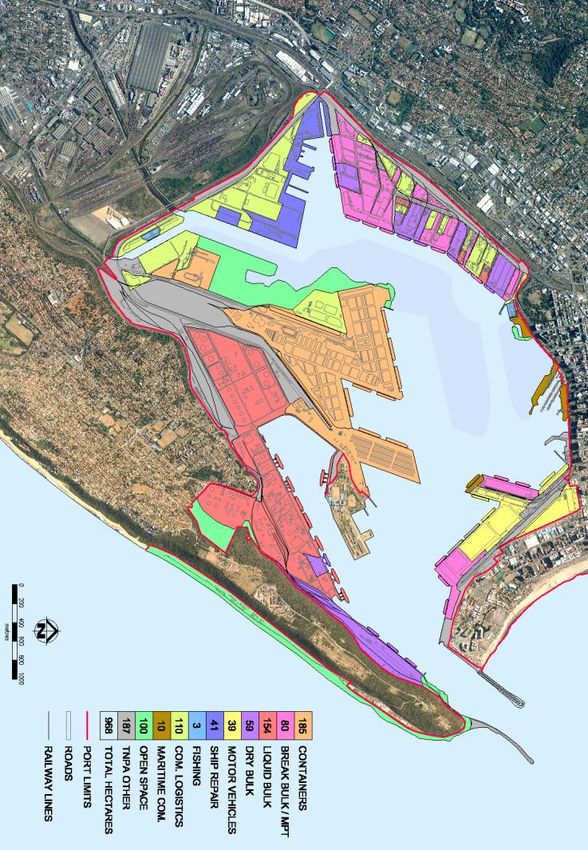
Transnet's planned infrastructure spend of R300 billion will
      achieve various policy objectives

         Capital investment
         Rbn

                                                                                  56
                                                                 48                            47
                                                         39                                                         41
                                                 37
                                    31
                25

            11/12 LE              12/13         13/14   14/15   15/16            16/17        17/18             18/19

                                                                        Maintenance vs. Expansion
                                                                        %        Maintain                  Expand

                                                                            67                                      58
                                                                                         37           42
                       Total capital spend
                           of R300bn
                                                                                11/12                     12/13
                                                                             Corporate Plan           Corporate Plan

                                                                                                                         PAGE 5
1   Before deducting PSP initiatives of ~R5bn
The majority of the investments will be in
General Freight and Freight Rail

  Commodity split (Rbn)                                            Major programmes

            30                                                           GFB rail capacity growth to meet market
       26                       GFB                   Break Bulk         demand volumes from 79,7mt to 170,2mt
                                Export Coal           Bulk
                                                                         – including Waterberg
   9
            3
   24                     151   Export Iron Ore       Other
                                Containers (Ports)                       Increase export coal
       25
                                Piped Products                           to 97,5mt
            32

                                                                                                Increase in fleet
                                                                         Increase export        and improvement
  Divisional split (Rbn)                                                 iron ore to 82,5mt     to the infrastructure

                     47
                                                                         Increase export
                 4              TFR           TPT                        manganese to 16mt
                          33
                                TRE           TPL
                     4    11    TNPA          Other
    201
                                                                         Completion of the
                                                                         New Multi-Product Pipeline (NMPP)

                                                                                                                   PAGE 6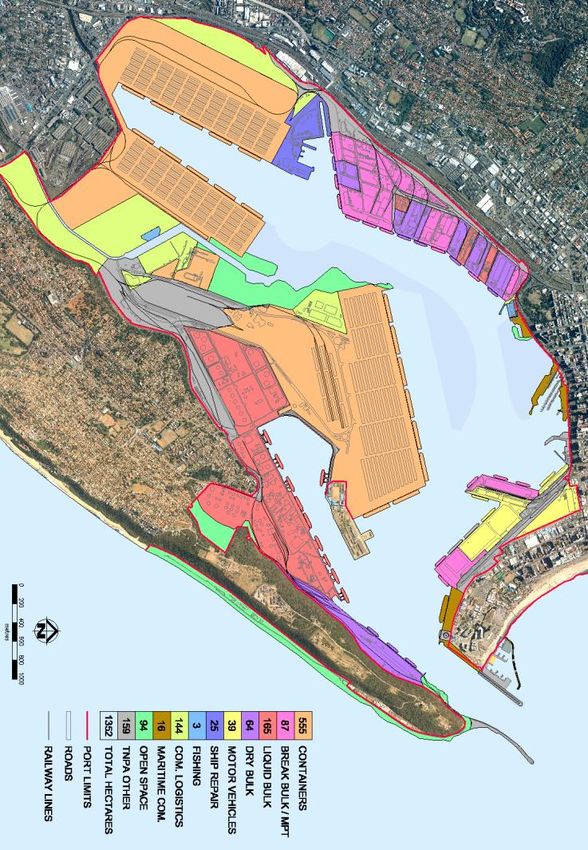
Major areas of capital investment and
 capacity creation

                                                                       Capacity created
 Area of investment                 Existing Capacity                                                    Future Capacity         Utilisation 2019
                                                                         over 7 years

       TFR Coal Line
                                           68.0 Mtpa                        29.5 Mtpa                          97.5 Mtpa              100%
         R31.6bn

       TFR Ore Line
                                          52.8 Mtpa                         29.7 Mtpa                          82.5 Mtpa              100%
         R18.6bn

   TFR General Freight
                                          79.7 Mtpa                         90.5 Mtpa                          170.2 Mtpa             100%
       R150.8bn

   Maritime Containers*             Terminals: 5.0 MTEUs             Terminals: 4.3 MTEUs              Terminals: 9.3 MTEUs       Terminals: 79%
         R24.1bn                      Ports: 5.5 MTEUs                 Ports: 4.0 MTEUs                  Ports: 9.4 MTEUs           Ports: 79%

            Bulk                    Terminals: 79.5 Mtpa              Terminals: 44.3 Mtpa             Terminals: 123.8 Mtpa      Terminals: 99%
          R31.6bn                    Ports: 196.0 Mtpa                  Ports: 36.0 Mtpa                 Ports: 232.0 Mtpa          Ports: 95%

         Breakbulk                   Terminals: 15 Mtpa                                                  Terminals: 15 Mtpa       Terminals: 80%
                                                                        Mainly sustaining
          R4.0bn                       Ports: 29 Mtpa                                                      Ports: 29 Mtpa           Ports: 52%

           NMPP
                                      4.0 billion litres/a              4.4 billion litres/a              8.4 billion litres/a        92%
          R 7.5bn

* TNPA‟s container capacity emanating from Multi-purpose Terminal and Maydon Wharf is shown under break-bulk                                 PAGE 7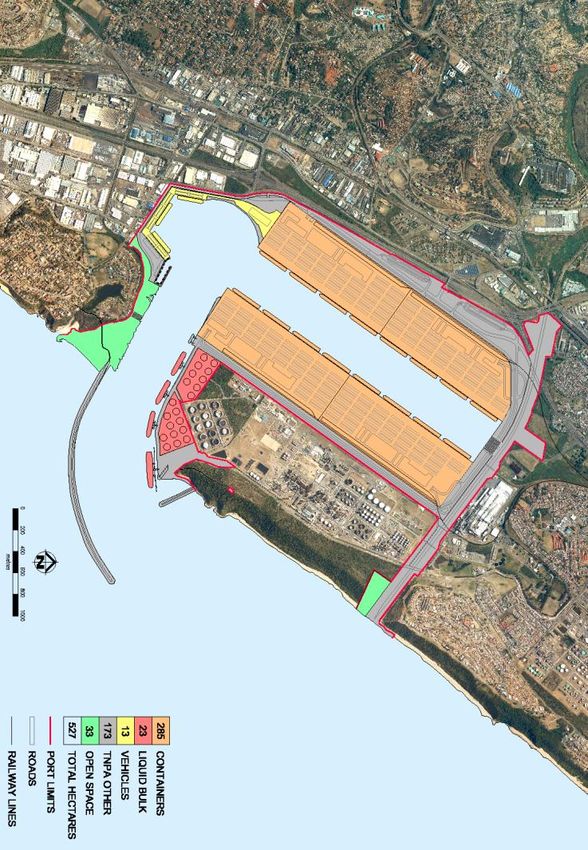
The impact of infrastructure development
will be felt nation-wide

      7 year capital investment                                                           Provisional contribution to direct and
      by region1                                                                          indirect jobs (‟000)
                                                                                               Free State              Gauteng                Eastern Cape
                                                                                               North West              Limpopo                Western Cape
                                                                                               Northern Cape           Mpumalanga             KwaZulu-Natal

                                                                                                                                             136
                                                                                                                                   123
                                                                                                                110                                   108
                                                                                                                          106
                                                                                                        99
                                                                                                                                                                88
                                                                                               83

                                                                                            11/12 12/13 13/14 14/15 15/16 16/17 17/18 18/19
                                                                                             LE
1 National – countrywide investments – R153,3bn
Freight Rail corporate centre and General Freight investments (wagons, infrastructure and locomotives have been classified as national investments (which cut across all
corridors) except for R7,4 billion for Freight Rail manganese expansion to 16mt which is allocated to the South corridor
                                                                                                                                                                     PAGE 8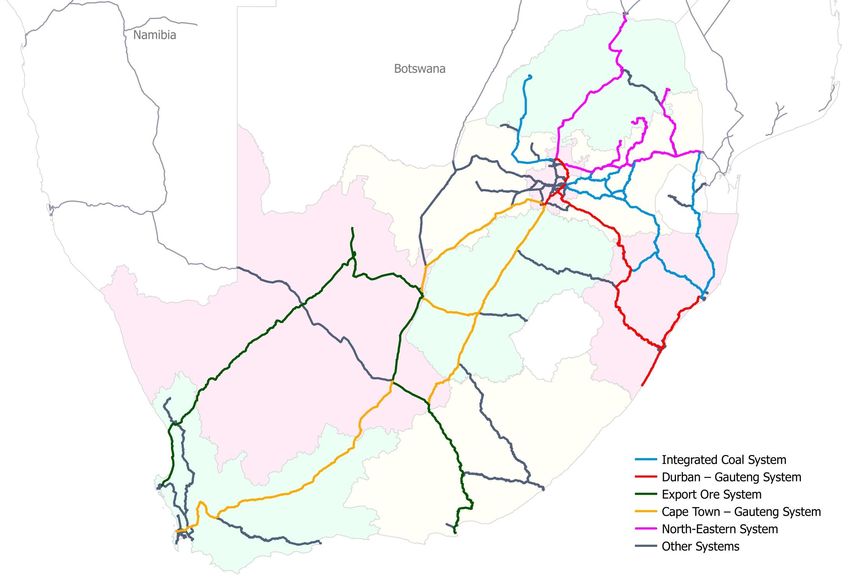
MDS will create jobs. Together with current operations
Transnet is expected to create employment for 588,000 people
at its peak with a large focus on skills and capacity building
Job creation impact of MDS on South Africa R7,6bn to be spent on training over
’000 people the next 7 years
Economy wide impact Indirect jobs Transnet incl. contractors Additional 15,000 direct jobs
588 576 570
543 Increased intake in schools of excellence
~220k 485
460
255 252 249
420
237 R4,6bn spent on bursaries and grants
368 213
200
184
317 technicians in training by 2018/19
164
235 260 251 248 Step up recruitment in critical skills and
194 203
173 expand annual intake
145
2,000 apprentices at all times
59 64 66 69 71 73 72 74
Increase engineering bursar intake to 543
11/12 12/13 13/14 14/15 15/16 16/17 17/18 18/19 students in 2018/19
LE
PAGE 9Direct jobs will ramp-up by 25% with a significant
step up in skills and development
Group employees
‘000 FTE % forecast employees trained 2011/12 Latest estimate
69 71 73 72 74
59 64 66
+25%
11/12 LE 12/13 13/14 14/15 15/16 16/17 17/18 18/19
58% 57% 57% 57% 57% 58% 57% 54%
Investment of ~4.6% of wage bill on skills development initiatives
Number of trainees
Engineering bursars Technicians Apprenticeships Management Leadership Programme Chartered Accountants
3,893 3,913 3,951 3,984 4,021 4,062 4,107
466 476 487 499 512 527 543
180 190 217 238 262 288 317
2,000 2,000 2,000 2,000 2,000 2,000 2,000
1,200 1,200 1,200 1,200 1,200 1,200 1,200
47 47 47 47 47 47 47
12/13 13/14 14/15 15/16 16/17 17/18 18/19
PAGE 10MDS will promote localisation, transformation
and empowerment
Potential local content commitment Localisation initiatives:
for locomotives (%) R2,9bn already spent on local content by
international suppliers
International suppliers to transfer knowledge
and expertise to up-skill local suppliers
On-the-job training and apprenticeships will
International be built into international supplier contracts
Provision of jobs and procurement
48% opportunities to rural areas where facilities
are located
Assistance will be provided to small
52% Local business to foster innovation and create jobs
~R4,2bn expected to be spent over the next
7 years on small business promotion
Transformation initiatives:
Collaboration with suppliers to meet
Government’s transformation and
empowerment objectives
PAGE 11A strong emphasis will be placed on Supplier A
Development to ensure growth and development
objectives are being met
Policy link to Transnet commodity tiers (i.e. potential supplier
type) Key outcomes
SDP Growth and
Industrialisation
High
Development focus Programmatic Programmatic
(Fleet OEM
• Transnet will affect suppliers Localisation
procurement) Sub Assembly
it procures from either
directly or indirectly (directly Technology Strategic enablers
procure from supplier or transfer/
indirectly support Strategic sustainability • SD, Sourcing and
downstream suppliers of CSDP Tier1, 2 and 3 Governance, Risk
suppliers higher up in the (Strategic SD) Assemblies and and Compliance
tier) Job creation/
Level of SD opportunity
components COEs
preservation
• SD Plan
• The level of SD opportunity • 4 Step SD Process
available is dependent on (identify and
the applicable tier of the Skills classify)
commodity (i.e. Tiers higher Focused development
Supplier • Sourcing Process
up can be measured against Tier 1,2 and 3
Development (now updated with
more key outcomes, e.g. Components
(Focused SD) SD components)
OEM‟s for all outcomes) Small business
• Evaluation Process
promotion
and Criteria
• Transnet will push for key • Further Recognition
outcomes and targets in Criteria
evaluation of tenders in the Small Enterprise
respective tiers and measure Development Further • ED models and plans
Enterprise Other Services, recognition1
winning bidders delivery to
targets Development Maintenance and
(BOE/ BWOE/ Repair Rural development
EME/ QSE)
Low and regional
integration
1 Points allocated in further recognition of certain components of B-BBEE in line with Transnet and government objectives
(i.e., black ownership, management control, EE , ED and preferential procurement) PAGE 12Market Demand Strategy will be executed through
a series of initiatives
Detailed further
Significant financial, social, economic and environmental
impact for South Africa and the region through:
1 2 3 4 5 6
Improving Regulatory and key Safety, health,
Optimising capital Growing volumes operational Finance and stakeholder sustainability,
investments and market share efficiencies funding engagement quality and risk
• Optimise the capital • Expand integrated • Become a “Gold • Maintain financial • Alignment on tariff • Embed a safety
portfolio customer planning standard” operator sustainability methodology and culture
• Achieve “gold • Create long-term • Improve quality of throughout the regulatory policy • Accelerate initiatives
standard” stable customer infrastructure capital investment • Engage with to address
management and relationships programme stakeholders to environmental
• Drive continuous
execution • Enhance key account improvement to • Pursue private sector develop joint view on challenges
• Practice efficient, management enhance operational participation transport industry • Actively monitor and
cost-effective capabilities efficiency and opportunities structure improve socio-
procurement • Align tariffs to productivity • Enhance financial • Actively engage with economic impact
• Achieve localisation recover full economic risk management internal and external
and empowerment cost from customers stakeholders to
objectives support MDS
7 Human capital strategy
• Fill critical vacancies whilst achieving employment equity targets • Embed core values of dignity and respect
• Implement enhanced talent management strategy • Continued focus on employee wellness
• Increase contribution to skills development within South Africa • Embed union engagement model
8 Building organisational readiness, a high performance culture and maintaining good governance
• Enhance performance management approaches • Enhance identification, assessment and mitigation capacity of
• Optimise the reward and incentives model enterprise risk management to manage risks
• Establish high performance programmes • Improve, standardise and integrate IMS to support delivery on business
requirements
• Safe guard corporate governance and ensure statutory compliance
• Ensure integrated, holistic approach to MDS tracking and reporting
PAGE 13As of today numerous achievements have been
made with regards to MDS execution
▪ Development of detailed 7-year MDS implementation plans kicked
off with most of Transnet's functions and ODs
MDS
readiness ▪ First assessment of capital 12/13 budget at risk completed and
assessment mitigation actions co-developed with ODs
conducted
▪ Procurement bottlenecks for 12/13 identified and mitigating actions
defined
▪ Capital and procurement templates and checklists to be utilised by
CAPIC and BADC developed
▪ Development of 12/13 capital and procurement pipeline
▪ Governance structure to institutionalise MDS defined
▪ BoD and sub-committee mandate, governance and reporting review
ongoing; new agenda for BoD meetings suggested
▪ Comprehensive stakeholder engagement strategy created; initial
events successfully executed, e.g., DPE; MDS Launch
▪ SPO alignment and definition including capability building included for
Exco members
▪ Amendment of long-term incentive (LTI) scheme to align with MDS
▪ HC priorities defined
PAGE 14The South African ports
WESTERN PORTS
Saldanha Bay Cape Town Mossel Bay
CENTRAL PORTS
Port Elizabeth Ngqura East London
EASTERN PORTS
Durban New Durban dig-out port Richards Bay
PAGE 15The South African ports system
An integrated system of complementary regional ports and rail corridors
EASTERN PORTS
WESTERN PORTS CENTRAL PORTS
PAGE 16Port planning principles
These planning principles have informed the development of the port plans:
• Develop a complementary ports system with a regional grouping of old and new ports
to provide a rational range of facilities to meet local and hinterland demand, and avoid
duplication of investment
• Optimise capital investment across the ports system to ensure capacity meets demand,
and to meet the requirements of Transnet, the National Ports Act, and South Africa
• Integrate and align port and rail capacity planning
• Ensure a sustainable response to environmental opportunities and constraint
• Align with the planning initiatives of stakeholders, including local, provincial and
national government, industry, and other key roleplayers
• Utilise available port space for berths, freight handling and back-of-port logistics
to maximise freight capacity
• Improve infrastructural and operational efficiencies and reduce transport and
logistics costs.
PAGE 17National demand forecast
4,2% 2,3% -0,4% 0,2% 2,3% 2,6%
3,3%
1,1% 2,6%
6,6% 0,0%
4,3%
14% 2,7%
4,7%
8,4%
2011/12 2018/19 2021/22 2031/32 2041/42 2011/12 2018/19 2021/22 2031/32 2041/42 2011/12 2018/19 2021/22 2031/32 2041/42 2011/12 2018/19 2021/22 2031/32 2041/42
4,3 m 7,6 m 8,7 m 13,4 m 20,2 m 72,7 m 91,0 m 97,4 m 93,2 m 94,9 m 52,8 m 82,5 m 82,5 m 92,3 m 115,5 m 4,8 m 12,0 m 13,0 m 16,8 m 21,7 m
8,4% 4,7% 4,3% 4,2% 3,3% 2,3% -0,4% 0,2% 6,6% 0,0% 1,1% 2,3% 14% 2,7% 2,6% 2,6%
2,0%
2,0%
1,3% 2,3%
1,9% 1,6%
1,2%
5,5% 1,9% 2,2% 2,6% 1,6%
1,1% 1,2%
4,3% 2,2%
2011/12 2018/19 2021/22 2031/32 2041/42 2011/12 2018/19 2021/22 2031/32 2041/42 2011/12 2018/19 2021/22 2031/32 2041/42 2011/12 2018/19 2021/22 2031/32 2041/42
22,4 m 38,4 m 39,3 m 42,4 m 45,8 m 10,4 m 15,1 m 16,0 m 19,3 m 23,5 m 21,5 m 29,0 m 30,9 m 38,5 m 48,3 m 0,6 m 0,7 m 0,7 m 0,9 m 1,1 m
8,0% 0,7% 0,8% 0,8% 5,5% 1,9% 1,9% 2,0% 4,3% 2,2% 2,2% 2,3% 2,6% 1,6% 1,6% 2,0%
• Top lines of tables show actual volumes
• Bottom lines of tables shows actual annualised growth rates
PAGE 18Roles of the container ports
The size of the container terminals is a reflection of the size of CAPE TOWN
their hinterlands. Durban handles two thirds of all imports and • Services the Western Cape
exports due to its proximity to Gauteng. hinterland.
• Handles small volumes of
time-sensitive Gauteng
containers.
Gauteng
NGQURA (WITH PE)
economic hub • Services the Eastern Cape
hinterland.
• Secondary gateway to
Gauteng.
• Southern African and inter-
continental transshipment
hub.
DURBAN
DURBAN
2011: 2,7m TEU
2018: 4,0m TEU
• Premier gateway for Gauteng
2042: 12,0m TEU and Southern African
containers.
CAPE TOWN • Services Durban and the KZN
PE+NGQURA
2011: 0,7m TEU
2011: 0,8m TEU hinterland.
2018: 0,9m TEU
2018: 2,0m TEU
2042: 2,2m TEU
2042: 5,8m TEU
PAGE 19National container demand vs capacity
DCT pier 2 Current terminal PE
DCT pier 1 Expansion: Phase 1 & 2 Ng berths 1–2
Point/MW Seaward expansion Ng berths 3–4
Airport site Outer basin Outer basin at Ngqura
Demand Demand Demand
Durban containers Cape Town containers PE/Ngqura containers
• Demand grows from 2,7m TEU to 12m TEU • Demand grows from 0,7m TEU to 2,5m TEU • Demand in Algoa Bay will grow at a high rate
over a 30 year period. over a 30 year period. based on increasing volumes of new
transshipments, reaching 6m TEU in 2042.
• Capacity is provided in the existing port until • The current capacity expansion projects will
2019, after which capacity is provided at the provide capacity until around 2026, after • Expansions in PE and the operationalising of
new dig-out port. which capacity will be created through berths 3+4 at Ngqura will provide short-term
seaward expansion of the terminal. capacity, after which a new outer basin must
be developed at Ngqura.
PAGE 20Container demand and development plans
STATUS QUO
• Container terminals are situated in Durban, PE and
Ngqura, and Cape Town.
• Containers are also handled at multi-purpose terminals in
Cape Town, East London, Durban and Richards Bay.
DEMAND AND CAPACITY
• Container volumes are forecast to grow from 4,3m TEU in
2012 to 7,6m TEU over a seven year period, to 20,2m TEU
over the 30-year horizon.
• Durban will continue to handle almost two thirds of the
national total; increased transshipment volumes result in
Ngqura handling the second largest volumes, ahead of
Cape Town and Port Elizabeth.
DEVELOPMENT PLANS
• Durban‟s Pier 1 + 2 Terminals will be expanded in the
short-term with new deepened berths and equipment,
followed by the development of container capacity at the
new dig-out port.
• The second phase of the Cape Town CT expansion will
provide landside capacity to match that developed at the
quayside. This will be followed by a seaward expansion in
the medium term.
• The operationalising and equipping of berths 3 and 4 at
the Ngqura Container Terminal will take capacity to 2m
TEU. Port Elizabeth Container Terminal can be expanded to
three berths in future, with berth deepening being
considered.
PAGE 21SA ports – current layouts
This slide and the next show the
ports, drawn to a similar scale,
comparing their current layouts with
the long-term potential layouts.
This comparison indicates that the
port system has the potential to
meet the long-term maritime needs
of the country.
Total landside area: 5 445ha
Total length of quayside: 34km
PAGE 22SA ports – long-term visions
Total landside area: 9 218ha (70% growth)
Total length of quayside: 92km (170% growth)
PAGE 23Landside capacity – national land use summary
Medium Long Medium Long
Land use Current Port Current
term term term term
• Total area within port limits
Containers 360Ha 812Ha 1 100Ha grows from 5 445 to 9 Saldanha Bay 543Ha 1 314Ha 1 255Ha
Vehicles 66Ha 94Ha 107Ha 218Ha Cape Town 234Ha 352Ha 465Ha
Dry Bulk 535Ha 916Ha 819Ha Mossel Bay 16Ha 16Ha 16Ha
• Containers, dry bulk and
Break Bulk 227Ha 316Ha 326Ha Port Elizabeth 184Ha 186Ha 420Ha
liquid bulk are the primary
Liquid Bulk 419Ha 833Ha 884Ha operational land users Ngqura 1 128Ha 1 132Ha 1 775Ha
Ship Repair 97Ha 140Ha 117Ha East London 131Ha 140Ha 165Ha
Com. Logistics 145Ha 249Ha 522Ha
• Large percentage of open
Durban Airport 0 527Ha 527Ha
space retained for future
Fishing 18Ha 29Ha 28Ha Durban 968Ha 1 004Ha 1 316Ha
development
Maritime Com. 17Ha 60Ha 60Ha Richards Bay 2 242Ha 2 320Ha 3 279Ha
TNPA Other 1 937Ha 2 380Ha 3 750Ha Total 5 445Ha 6 991Ha 9 218Ha
Open Space 1 625Ha 1 163Ha 1 506Ha
Total 5 445Ha 6 991Ha 9 218Ha
PAGE 24Vessel sizes and port capabilities
Dimensions
Vessel Side view SB CT PE Ng EL Air Dur RB
(LOA x Beam x Draft
Container: Feeder
3 000 TEU
210m x 30m x 11,0m √ √ √ √ √ √ √
Container: Panamax
4 500 TEU
240m x 32m x 12,0m √ √ √ √ √ √
Container: Post Panamax
6 600 TEU
305m x 40m x 14,0m √ √ √ √ √
Container: Ultra large
15 000 TEU
400m x 59m x 15,5m √ √ √
Dry bulk: Handysize
35 000 t
177m x 28m x 10,0m √ √ √ √ √ √ √ √
Dry bulk: Panamax
80 000 t
225m x 32m x 13,0m √ √ √ √
Dry bulk: Cape size
180 000 t
289m x 45m x 18,4m √ √
Liquid bulk: Handymax
50 000 t
183m x 32m x 11,0m √ √ √ √ √ √ √ √
Liquid bulk: Suezmax
175 000 t
300m x 43m x 16,5m √ √ √
PAGE 25Design vessels for the Durban dig-out port
Vessel type Capacity LOA (m) Beam (m) Draft (m)
Ultra Large Container Ship (ULCS) 15 000 TEU 400 60 16
Super Post Panamax Container Vessels 9 000 TEU 350 45.6 14.5
Very Large Crude Carrier (VLCC) 300 000 t 332 58 22
Car Carrier 9 000 CEU 246 33.6 14.3
Bulk Liquid Vessel 100 000 t 245 42 14.3
Super Post Panamax
Ultra-large container ship (ULCS) Very large crude carrier (VLCC)
PAGE 26Increasing vessel and equipment sizes
1973 2012
DCT North Quay at current depth of DCT North Quay at -16,5m after deepening and widening, with 9 200 TEU
-12,8m with Alphen class vessel and vessel and mega-max tandem lift STS cranes
quayside cranes as per original design
PAGE 27Trains serving the South African ports
Ore train: Sishen to Saldanha Bay
4 X 9E and 5 X 34D locos, 342 CR14 wagons, 34200 ton payload, 3547m long
Coal train: Ermelo to Richards Bay
4 X 11E locos, 200 X CCR11 wagons, 16800 ton payload, 2496m long
Manganese train: Hotazel to Port Elizabeth
4 X 18E locos, 104 X CR9 wagons, 6300 ton payload, 1085m long
Container train: Durban to Gauteng
3 X 6E locos, 50 X SMLJ wagons, 2400 ton payload, 771m long
Car train: Durban to Gauteng
2 X 6E locos, 36 X SCL wagons, 576 ton payload, 769m long
Tanker train: Durban to Gauteng
4 X 6E locos, 50 X XPLJ wagons, 2635 ton payload, 931m long
PAGE 28TNPA fleet requirements
Seven-year Fleet planning method
Current 30-year
Port Type (exp and
fleet (exp only) • Understand port type: ie ports that
sust)
require more than one vessel move:
– – Cape Town
Tugs 4 3
Saldanha Bay –
Pilot boats 2 2 – Durban
–
– Richards Bay
Tugs 4 – 3
Cape Town
Pilot boats 2 2 –
• Review existing fleet size
• Review workload of existing marine craft
–
Port Elizabeth
Tugs 4 2
– • Ensure effective fleet management
Pilot boats 1 1
– • Craft lifespan to be taken as 35 years
Tugs 3 –
– • Determine bollard pull requirements
Ngqura –
Pilot boats 1 –
–
• Review propulsion requirements
• Align with port development framework
2 –
East London Tugs 2
– –
Tugs –
–
11
Pilot boat specifications
– • Type: Conventional twin
Airport site Pilot boats – 2
– screw
Helicopters – 1
– • Propulsion: 2 x 550kW
– • Length overall: 27m
Tugs 11 8 • Beam: 8m, Draft: 1,8m
–
Durban Pilot boats 2 –
–
Helicopters 2 –
–
Helicopter specifications
• Type: 8 seater multi-
– purpose helicopter
Tugs 3 2
Richards Bay Pilot Boats 1 1
– • Propulsion: 2 x 440kW
– Twin-engine
Helicopters 1 1
–
Tug specifications
Tugs 31 17 14 • Type: Voith schneider
Pilot boats 9 6 2 • Propulsion: 2 x 2 640kW
Total
Helicopters 3 1 1 • Bollard pull: 80 tons
Dredgers 5 4 –
• Length overall: 31m
• Beam: 11,5m, draft: 6,2m
PAGE 29Transnet Port Terminals
CONTAINER TERMINAL
DRY BULK TERMINAL
MULTI-PURPOSE TERMINAL
AUTOMOTIVE TERMINAL Durban Ro-Ro and point MPT
0,4m, 0,4m and 0,5m units
Richards Bay dry and break bulk
13m, 19m and 24m tpa
0,3m, 0,3m , 0,4m tpa
8m, 12m and 15m tpa
VOLUMES: 2012, 2019, 2042
Durban Maydon wharf
0,5m, 1,0m and 1,2m tpa Richards Bay
Durban containers
2,7m, 4,3m and 12m TEU
Durban agri bulk
1m, 1,8m and 13m tpa
Saldanha iron ore
49m, 81m and 115m tpa
Durban
Saldanha MPT
0,6m, 0,6m and 1,6m tpa Port Elizabeth containers
0,3m 0,5m and 1,1m TEU
Saldanha Bay
Port Elizabeth car and MPT
0,15m, 0,16m , 0,2m units East London
0,14m, 0,11m and 0,14m tpa
Port Elizabeth manganese East London car and combi
4,6m, 0m and 0m tpa 06m, .07m and .09m units
0,02m, 0,02m and 0,02m tpa
Ngqura
East London bulk
Cape Town Port Elizabeth Ngqura Containers
0,1m, 0,1m and 0,2m tpa
0,5m, 1,8m and 4,7m TEU
Cape Town Containers Cape Town MPT
0,7m, 1,0m and 2,2m TEU 0,3m, 0,4m and 0,7m tpa
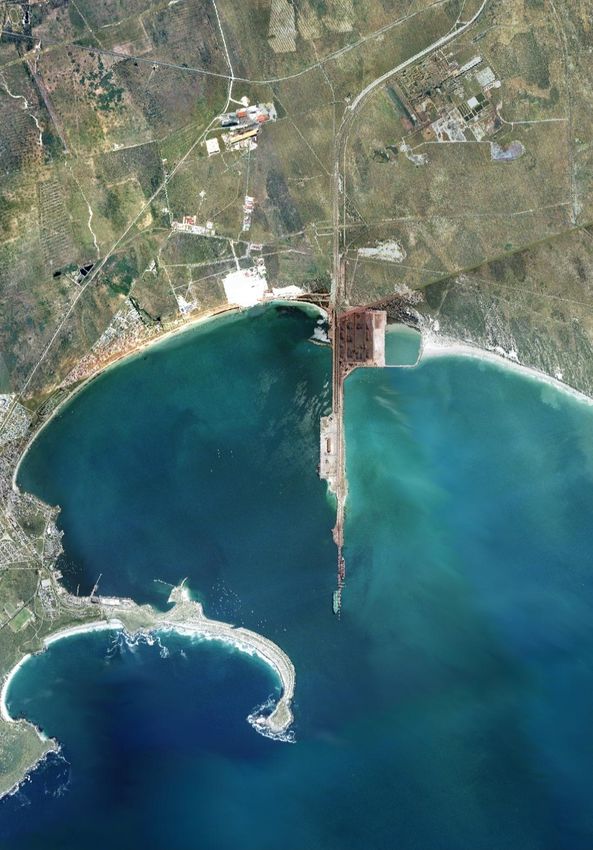
PAGE 30Port of Saldanha Bay
• South Africa‟s deepest
port.
• Iron ore export jetty
provides berthing for
large dry bulk and liquid
bulk vessels.
• Multi-purpose terminal
and facilities for offshore
rig servicing and
fabrication.
• The port has the potential
for expansion to support
the adjacent industrial
development.
• Future port expansion will
require extensive land
acquisition, as well as
limited reclamation.
CARGO TYPE TERMINAL BERTHS USABLE BERTHS TERMINAL CAPACITY BERTH LENGTH BERTH DRAFT
Iron ore Iron ore 101, 102 2 58 000 000 1 260m 23m
Break bulk Multi-purpose 201, 202, 203 4 3 300 000 874m 13m to 15m
Liquid bulk Liquid bulk 103 1 25 000 000 360m 23m
PAGE 31Port of Saldanha Bay: current and short-term plans
3
5
1 1
3
2 2
4
4
5
6
2012 2019
Current layout SHORT TERM layout
Short-term LAYOUT
1. Iron ore export terminal with stockpiles and two 1. Iron ore export terminal capacity expanded to 80mtpa,
berths, endpoint of the Sishen – Saldanha heavy with two new berths and extended stockpiles
haul rail corridor 2. MPT expansion with new berths and extended
quayside, also used for rig repairs
2. Multi-purpose terminal
3. New terminal for LPG imports
3. Liquid bulk berth at end of jetty
4. Extended Mossgas quay
4. Mossgas site oil and gas fabrication
5. Strategic land acquisition in support of the IDZ and
5. Small craft harbour energy cluster
6. Possible site for SBM for liquid bulk imports
PAGE 32Port of Saldanha Bay: medium and long-term plans
1 1
3
2
3 2
4
2042 2042+
Medium-term layout Long-term layout
1. New liquid bulk basin in support of energy 1. Full development of liquid bulk basin with
cluster shoreside energy cluster facilities
2. Developing logistics corridor to IDZ 2. Potential new cut and fill basin with twelve new
3. Potential development of general freight berths and extensive quayside expansion
terminal 3. Extended logistics sites in support of IDZ
4. New drydock for rig fabrication and repair
PAGE 33Saldanha Bay demand forecast and major projects
DEMAND FORECAST
• Saldanha‟s freight volumes are dominated by the iron ore
export volumes through the IOT. These are forecast to
grow from current volumes of 49mtpa to more than
115mtpa over a 30-year period.
• Liquid bulk volumes of both crude and refined products
will grow aggressively from 5,7m cm to 22m cm over the
same period.
• There is forecast to be only slow growth of smaller
volumes of break bulk and dry bulk cargoes handled at
the MPT.
• No container or vehicle volumes are forecast in the 30-
year planning period.
Cargo Project Timeframe Project cost MAJOR PROJECTS
• Major projects in the short-term
Dry bulk Iron ore expansion to 80mtpa Short term R5 375m include the expansion of the
IOT to 80mtpa, and the
Break bulk MPT expansion Short term
expansion of the Multi Purpose
Terminal.
Liquid bulk LPG terminal Short term R1 000m
• It is anticipated that there will
Liquid bulk LNG terminal Short term be significant private sector
investment in both liquid bulk
Ship repair Extension to Mossgas Quay (to 500m) Short term R822m facilities – including LPG and
LNG terminals, as well as in
Ship repair Ship repair expansion and dry dock Short term R6 000m ship repair facilities with a new
drydock in the medium term.
TNPA other Strategic land acquisition (230ha) Short term R690m
Liquid bulk Energy precinct with tank farm (300ha) Short term R900m
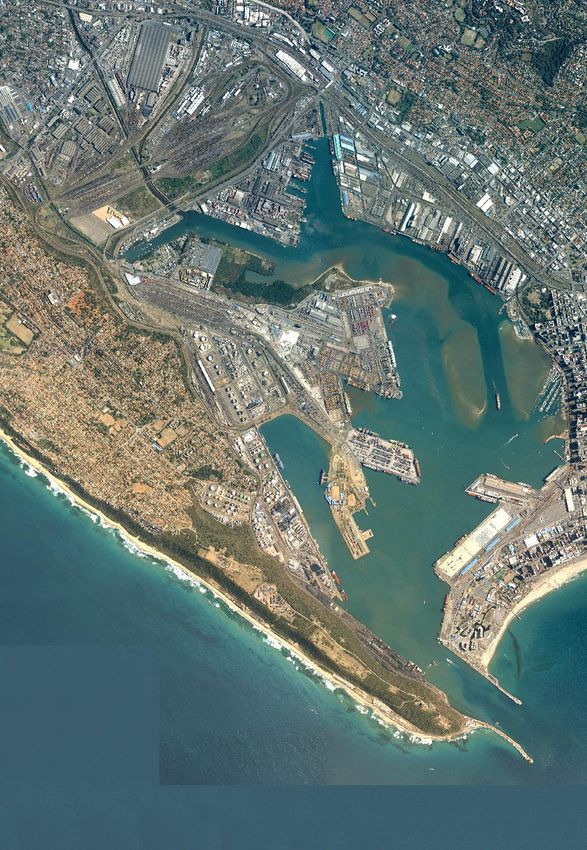
PAGE 34Port of Durban
• The Port of Durban provides a full
range of port services to the local
Durban and KZN hinterland, as
well as serving the Gauteng and
Southern African hinterlands.
• It is South Africa‟s premier
container, vehicle and liquid bulk
port, and also provides break bulk
and MPT, dry bulk, ship repair,
cruise liner, navy, fishing and
recreational facilities.
• The development plans for Durban are
driven by the major container
expansions required to ensure that the
port component of the Durban to
Gauteng Freight Corridor can meet
future demand.
• Short-term port expansions will be
made within the existing port, followed
by the medium-term development of a
complementary new port on the old
airport site, followed by a long-term
expansion in Bayhead.
PAGE 35Durban – status quo
USABLE TERMINAL BERTH
CARGO TYPE TERMINAL BERTHS BERTH DRAFT
BERTHS CAPACITY LENGTH
108, 109, 201,
Containers DCT 202, 203, 204 and 7 2 300 000 1 892m 11,0m to 12,3m
205
Containers Pier 1 105, 106 and 107 3 720 000 686m 8,2m to 12,1m
Cars Cato Creek F, G, M, R and Q 3 330 000 1 149m 10,1m to 10,6m
Dry bulk Bluff Berths 1 to 4 3 4 800 000 739m 8,6m to 10,3m
Dry bulk Maydon Wharf MW 1 and 2 1 1 700 000 305m 9,1m to 9,6m
Dry bulk Island View IV3 1 1 300 000 165m 10,8m
Dry bulk Maydon Wharf MW 5 1 1 100 000 200m 9,6m
Dry bulk Maydon Wharf MW 8 1 700 000 172m 9,2m
MW 9, 10, 11 and 5,1m (MW 12) to
Break bulk Maydon Wharf 3 3 800 000 871m
12 9,9m
Break bulk Point B, C, D, E 3 3 718 750 1 070m 9,9m to 13,7m
Break bulk Maydon Wharf MW 6 and 15 2 1 860 000 367m 9,6m
Break bulk T-Jetty O and P 2 700 000 620m 10,6m to 11,6m
Break bulk Maydon Wharf MW 7 1 32 000 244m 9,2m
Break bulk Maydon Wharf MW 14 1 280 000 173m 9,6m
Break bulk Island View IV6 1 220 000 175m 8,9m
Break bulk Maydon Wharf MW 13 1 n/a 172m 9,6m
Liquid bulk Island View IV7, 8, 9 3 12 000 000 705m 11,9m to 12,2m
Liquid bulk Island View IV2, 4, 5 3 3 400 000 525m 9,4m to 10,6m
Liquid bulk Island View IV1 1 1 700 000 230m 12,5m
Liquid bulk Maydon Wharf MW 3 and 4 1 900 000 305m 8,7m to 9,1m
PAGE 36Port of Durban: current and short-term plans
2012 2019
1 5
2 3 1
6 2
4
4
5
3
Current layout Short-term layout
1. Point MPT and Ro-Ro terminal 1. North quay berth deepening
2. Maydon Wharf 2. Pier 1 expansion with Salisbury Island infill
3. Bayhead rail yards 3. Maydon Wharf quaywall reconstruction
4. Durban Containers Pier 1 and Pier 2 4. Island View berth reconstruction
5. Island View liquid bulk precinct 5. Point passenger terminal
6. Bluff
PAGE 37Port of Durban: medium and long-term plans
2019 – 2042 2024 – 2042+
5
2
2
3 4 1
1
Medium-term layout Long-term layout
The medium-term expansion of the Port of Durban In the longer term, expansion could take place in the
will be focused on the new dig-out port on the old Bay once sustainability matters have been addressed.
Durban airport site.
1. Bayhead dig-out basin, with ten container berths
1. Breakwater and entrance channel and new terminals
2. 16 berth container basin and terminals 2. Reconfiguration of Durban Container Terminals
3. New automotive terminal with infill and new operating methods
4. Liquid bulk berths and terminal
5. Road and rail connectivity
PAGE 38Durban demand forecast
DEMAND FORECAST
• Durban‟s demand forecast shows
significant growth in container, vehicle,
and bulk volumes. Only break bulk
cargoes show little growth.
• Container volumes are forecast to grow
from the current 2,7m TEU to 4m TEU
in 2018, and then to 12m TEU by
2042.
• Automotive volumes grow from 381000
to 776 000 units over the 30-year
period.
• Dry bulk volumes will grow from 9mt
to 17mt.
• Break bulk volumes stay at around
2,5mt.
• Liquid bulk volumes will grow from 8m
cm to 13m cm over the 30-year period.
PAGE 39Durban – project investment list
Cargo Project Timeframe Project cost (millions)
Containers DCT Pier 2 North Quay deepening Short term R4 500
Containers Straddle carrier replacement Short term R1 489
Containers Pier 1 phase 2 CT Short term R9 000
Break bulk Maydon Wharf berth deepening (Sheetpiles) Short term R1 594
Liquid bulk Island View berth 1 upgrade Short term R400
Liquid bulk Island View berth 4 upgrade Short term R350
TNPA other Maydon road upgrade Short term R1 200
TNPA other Edwin Swales link road Short term R760
TNPA other Acquisition of 2 replacement tugs Short term R1 373
TNPA other Permanent sand supply system Short term R436
Maritime commercial Cruise liner terminal, berth A&B Short term R670
Containers Infill between Pier 1 and 2 Medium term R7 600
Containers Pier 2 stack reconfiguration Medium term R7 400
Containers Airport site CT: Phase 1 Medium term R40 397
Containers Airport site CT: Phase 2 Medium term R14 757
Containers Airport site CT: Phase 3 Medium term R11 954
Containers Airport site CT: Phase 4 Medium term R11 195
Vehicles Relocate car terminal to airport site Medium term R3 000
Break bulk Maydon Wharf berth deepening (5-11 and 15) Medium term R3 000
Containers Bayhead container terminal Long term
PAGE 40Durban metro context – current layout
CBD
Natcor rail
corridor and
N3 freeway
Existing port of
Durban
N2
freeway
Old Durban
airport site
PAGE 41Durban metro context – long-term layout
Integrated corridor
road and rail, hubs Full development of
and terminals, and Port of Durban with
back-of-port land reconfigured Pier 1
use solutions and 2 and Bayhead
dig-out
Full development of
the new airport site
dig-out port
PAGE 42Durban container terminal reconfiguration
1 2
RECONFIGURATION OPTIONS
1. Existing photo showing outdated Z-shaped
layout.
2. Shows the north quay deepened and
lengthened with the completed Pier 1
expansion with Salisbury Island infill.
3. Infill between Pier 1 and Pier 2, with entire
terminal converted to CRMG operation.
3
PAGE 43Development planning principles 1. Match capacity to demand Provide adequate corridor and terminal capacity at the right place ahead of demand. 2. Align infrastructure to freight type Heavy haul or light industrial standards depending on the freight type 3. Improve operational characteristics Reconfigure line infrastructure and layouts to remove bottlenecks 4. Ensure network connectivity Link complementary ports with inland connections. Support connectivity to SADC/regional railways 5. Standardise infrastructure Use similar technologies across the network to improve safety, maintainability and operational performance 6. Align with PRASA/non-Transnet operator requirements Separate, re-route and enhance services where needed. Consider inter-operability with branch-line services
Options for capacity creation (Principle 1)

                                                                      Reduce throughput time
Run more trains
                                                                      • Equalise demand and scheduling
• Upgrade train control systems
                                                                      • Improve terminal processes
• Improve electrification system
                                                                      • Improve track maintenance planning
• Add trackside monitoring equipment
                                                                      • Improve rolling stock reliability
• Improve asset security systems
                                                                      • Improve average speed (limited)

                                          Increased
Run heavier trains
                                           volumes                    Run longer trains
•   Install higher axle load track                                    • Increase length of passing loops
•   Upgrade structures                                                • Reconfigure terminal infrastructure
•   Match traction type – 25kVA                                       • Increase electrical supply
•   Increase electrical supply                                        • Improve traction force distribution
•   Flatten gradients and ease curves                                 • Improve braking systems

                                             Supporting
                                            technologies

                 Standardisation
                 • Train configuration   Integrated system             Operational planning
                 • Traction type         approach                      • System redundancy
                 • Axle load             • Reliability of rail sub     • Consolidated bulk
                 • ECP/DP                  systems                       loading terminals
                 • Train control         • Terminals, rail and port    • Long-term Planning
                 • Electrification         systems sustainability        Framework
                 • Wagon types
Infrastructure overview
Zimbabwe
Musina
Namibia Mozambique
Lephalale Groenbult
Phalaborwa
Total network : 30 400 track km
: 20 953 route km Hoedspruit
Core network : 12 801 route km Steelpoort
Komatipoort
Network electrification: Botswana
Mahikeng
• 50kV AC (861km)
Lothair
• 25kV AC (2 309km)
Swaziland
• 3kV DC (4 935km)
Hotazel
• Diesel (11 974km)
Vryheid
Sishen
Nakop
Glencoe
Harrismith
Kimberley Richards
Bloemfontein Bay
Lesotho
Durban
De Aar
Noupoort
Umthata
Saldanha
East London
Cape Town Ngqura
Port ElizabethNetwork Plans: core network systems
Zimbabwe
Musina
Namibia
Mozambique
The development plans of the network has Botswana Lephalale Groenbult
been subdivided into five logical Phalaborwa
infrastructure systems:
• Integrated coal system
• Durban – Gauteng system
• Export ore system Mahikeng
• Cape Town – Gauteng system Maputo
• North-eastern system Ermelo
Swaziland
This executive overview only highlights Hotazel
some of the key sections in more detail
Sishen Kroonstad Vryheid
Nakop Glencoe
Kimberley
Richards
Bloemfontein
Bay
Lesotho
Durban
De Aar
Noupoort
Integrated coal system
Durban – Gauteng system
Saldanha Export ore system
East
London Cape Town – Gauting system
Ngqura North-eastern system
Cape Port Elizabeth Other systems
TownIntegrated coal system: status quo
Lephalale Failure rate Notes
(Faults per million ton
kilometre)
• The integrated system is partly heavy haul and light
system
• System 3 is a heavy haul coal export line from Ermelo to
1
Komatipoort Richards Bay
Network average
• The Waterberg (Lephalale-Ogies) and coal backbone
2 (Ogies-Ermelo) section have partly heavy and light axle
Ogies
loading characteristics
Ermelo
4 • Clay soil formation from Thabazimbi to Pendoring inhibits
Perway the ability of axle load increase.
Telecoms
• The section performance of system 3 is good compared to
3 Electrical
the network average. Few number of faults have an impact
on train operations
• The outdated telecoms infrastructure needs to be replaced
Richards Bay Signals in the next seven years
Line properties
Section Line type Axle load Traction Train control Sharpest curve Steepest gradient
1. Lephalale – Ogies Single 20t Diesel and 25kV AC TWS 200m 1:75
2. Ogies – Ermelo Double 20/26t 3kV DC CTC 153m 1:100
3. Ermelo – Richards Bay Double 26t 25kV AC CTC 550m 1:160
4. Komatipoort – Richards Bay Single 20t Diesel CTC 250m 1:120
General condition
Bridges and Electrical Overall
Formation Perway OHTE Signals Telecoms
structures supply conditionErmelo – Richards Bay: demand and current capacity
Ermelo -> Richards Bay
mtpa Top 10 commodities (mtpa)
2012 2019 2041
Coal export 79,69 103,45 107,53
Chrome 2,20 5,68 8,26
Ferrochrome 1,80 3,27 10,43
Demand growth
Wood+ 1,33 2,19 4,14
Coal power 1,89 5,00 0,00
160
Richards Bay -> Ermelo Containers 0,27 0,48 4,83
140
Coal domestic 0,97 1,32 3,96
120
Industrial chemicals 0,38 0,58 2,99
100
Other non Fe min mining 0,05 0,09 276
80
60 Granite 0,36 0,48 0,44
40 Others 0,53 0,96 2,46
20
0 Section demand (2041)
2010 2015 2020 2025 2030 2035 2040 2041 Ermelo -> Richards Bay Richards Bay -> Ermelo mtpa
Section utilisation 0 100 200 0 100 200
Ermelo
85% 96% 103% 106% 116% 130% 138% 150% 155% 161% 170% 173% 180% 187% 195% 204% 213% 220% 227% 234% 241% 245% 252% 260% 267% 277% 286% 295% 303% 312% 321% 331%
85% 94% 102% 105% 114% 126% 133% 145% 149% 156% 166% 168% 175% 181% 189% 198% 206% 213% 220% 226% 233% 236% 243% 250% 257% 266% 275% 283% 290% 298% 306% 316%
85% 94% 102% 105% 114% 126% 133% 145% 149% 156% 166% 168% 175% 181% 189% 198% 206% 213% 220% 226% 233% 236% 243% 250% 257% 266% 275% 283% 290% 298% 306% 316%
Piet Retief 85% 94% 102% 105% 114% 126% 133% 145% 149% 156% 166% 168% 175% 181% 189% 198% 206% 213% 220% 226% 233% 236% 243% 250% 257% 266% 275% 283% 290% 298% 306% 316%
51% 56% 60% 62% 67% 74% 79% 85% 87% 92% 97% 99% 103% 106% 110% 115% 120% 124% 128% 132% 136% 137% 141% 146% 150% 155% 160% 165% 169% 174% 179% 184%
62% 67% 72% 74% 81% 90% 95% 103% 105% 110% 117% 119% 123% 128% 133% 139% 145% 149% 154% 159% 163% 165% 170% 176% 180% 186% 192% 198% 203% 209% 215% 222%
Vryheid
62% 67% 72% 74% 81% 90% 95% 103% 105% 110% 117% 119% 123% 128% 133% 139% 145% 149% 154% 159% 163% 165% 170% 176% 180% 186% 192% 198% 203% 209% 215% 222%
73% 79% 85% 87% 96% 106% 112% 121% 124% 130% 138% 140% 145% 150% 156% 163% 170% 175% 181% 186% 192% 195% 200% 207% 212% 219% 226% 233% 239% 246% 253% 261%
73% 79% 85% 87% 96% 106% 112% 121% 124% 130% 138% 140% 146% 151% 156% 164% 171% 176% 182% 187% 192% 195% 201% 207% 213% 220% 227% 234% 240% 247% 254% 262%
54% 57% 61% 62% 68% 74% 79% 86% 88% 92% 97% 98% 100% 102% 105% 107% 109% 112% 115% 118% 122% 123% 126% 130% 133% 137% 142% 146% 149% 153% 157% 161%
Ulundi 54% 57% 61% 62% 68% 74% 79% 86% 88% 92% 97% 98% 100% 102% 104% 107% 109% 112% 115% 118% 122% 123% 126% 130% 133% 137% 142% 146% 149% 153% 157% 161%
49% 51% 55% 56% 61% 67% 71% 77% 79% 83% 88% 88% 91% 92% 94% 97% 98% 101% 104% 107% 110% 111% 114% 117% 120% 124% 128% 131% 135% 138% 142% 146%
Richards Bay 49% 51% 55% 56% 61% 67% 71% 77% 79% 83% 88% 88% 91% 92% 94% 97% 98% 101% 104% 107% 110% 111% 114% 117% 120% 124% 128% 132% 135% 138% 142% 146%Integrated coal system: development plan
Strategy
Axle Train control Electrical Capacity expansion Alignments
Upgrade to 26t/axle New system Upgrade to 25kV AC Tunnel doubling, Swazi link Ease grades and curves
Expansion and investment
Section Phase Intervention ETC (Rm)
Lephalale to Pyramid 1a Extend Matlabas loop and Thabazimbi Yard, 4 new loops and 2 loop extensions 1 540
Lephalale to Pyramid 2a 7 New loops and 7 loop extensions, electrify Lephalale to Thabazimbi to 25kV AC 1 412
Thabazimbi to Ermelo 3a Complete new single line 26t/axle 200 wagon Thabazimbi to Ermelo 11 245
Ogies to Ermelo 1b Upgrade selected line sections to 26mtpa, conversion to 25kV AC and new block splits. 5 978
Ogies and Ermelo 2b Provide demand flexibility by adding a fourth line between Ogies and Ermelo 4 560
Ermelo to Richards Bay 1c Upgrade electrical supply system and double the Overvaal tunnel. 8 978
Lothair to Swaziland link 2c New link from Lothair to Matsapha, and upgrade the section to Phuzumoya. 11 998
Komatipoort to Phuzumoya 1d Extend the existing crossing loops and add 8 new crossing loops. 978
Phuzumoya to Nsezi 2d Upgrade section to accommodate 34mtpa , doubling, grade flattening and curve easing 6 002
Development plan
Phase
2010
2011
2012
2013
2014
2015
2016
2017
2018
2019
2020
2021
2022
2023
2024
2025
2026
2027
2028
2029
2030
2031
2032
Section
Lephalale to Pyramid 1a 1 1 5 231 536 536 231
Lephalale to Pyramid 2a 1 1 9 212 326 326 326 212 Research
Thabazimbi to Ermelo 3a 4 15 1 123 1 123 1 347 1 347 1 347 1 347 1 347 1 123 1 123 FEL – 1: Concept study
Ogies to Ermelo 1b 60 1 196 1 793 2 391 538 FEL – 2: Feasibility
Ogies and Ermelo 2b 75 1 785 2 190 510 Construction
Ermelo to Richards Bay 1c 60 1 196 1 793 2 391 538
Lothair to Swaziland link 2c 80 1 998 2 110 2 500 2 500 2 810
Komatipoort to Phuzumoya 1d 450 528
Phuzumoya to Nsezi 2d 60 980 1 110 1 500 1 500 852
Total cash flow (Rm) 2 512 1 722 5 947 8 073 10 767 6 108 4 369 1 347 1 347 1 422 3 132 3 313 1 633 0 0 0 0 0 0 0 0 0Gauteng – Durban system: status quo
Pyramid Failure rate Notes
(Faults per million ton
2
Rietvallei kilometre) • The system consist of the Gauteng Freight Ring (Pyramid –
Houtheuwel Houtheuwel), Natcor (Gauteng to Durban) and the North
and South coast lines (Richards Bay – Port Shepstone)
Perway
• System capacity utilisation largely dominated by the Natcor
Telecoms and Freight Ring operations.
1 Glencoe Electrical • Natcor infrastructure heavily utilised but constrained by
Network average
Richards Bay
poor alignment design. Poor formation and tunnel design
infringe capacity development opportunities.
• Gauteng freight ring capacity constrained on single line
3 sections. OHTE theft and obsolete train control technology
Durban impacts severely on train operations.
• North and South coast signalling equipment obsolete.
Signals
Port Shepstone
Line properties
Section Line type Axle load Traction Train control Sharpest curve Steepest gradient
1. Gauteng to Durban Double 20t 3kV DC CTC 250m 1:66
2. Pyramid to Houtheuwel Single/Double 20t 3kV DC CTC 305m 1:75
3. R. Bay to Port Shepstone Single/Double 20t 3kV DC CTC/RTO 250m 1:66
General condition
Bridges and Electrical Overall
Formation Perway OHTE Signals Telecoms
structures supply conditionGauteng – Durban: demand and current capacity
mtpa
Gauteng -> Durban Top 10 commodities (mtpa)
2012 2019 2041
Containers 1,45 3,38 29,07
Processed foods 0,30 0,86 14,03
Other chemicals 0,00 0,22 4,68
Demand growth
Domestic coal 0,94 3,50 3,56
Beverages 0,00 0,01 3,06
Other agriculture 0,00 0,01 2,84
Durban -> Gauteng Avtur 0,44 0,84 2,01
Wheat 0,29 0,52 1,74
Fuel 0,76 1,43 1,53
Paper and paper products 0,00 0,11 1,51
Other 0,83 1,37 4,94
Section demand (2041)
Gauteng -> Durban mtpa
Durban -> Gauteng
Section utilisation 0 50 100
Gauteng
18% 32% 37% 41% 49% 58% 64% 69% 73% 76% 79% 83% 88% 96% 106% 118% 133% 138% 143% 149% 156% 163% 169% 176% 184% 192% 200% 208% 215% 223% 231% 240%
25% 44% 53% 57% 69% 81% 90% 97% 102% 106% 111% 116% 123% 135% 149% 165% 185% 193% 200% 209% 218% 227% 237% 246% 257% 268% 280% 290% 301% 312% 323% 335%
25% 44% 53% 55% 66% 77% 86% 93% 98% 102% 106% 111% 118% 130% 143% 160% 180% 187% 194% 203% 211% 221% 230% 239% 250% 261% 272% 282% 292% 303% 314% 326%
Newcastle 28% 44% 51% 53% 63% 73% 80% 86% 90% 93% 97% 102% 109% 120% 134% 150% 170% 177% 184% 192% 200% 210% 218% 228% 237% 248% 260% 269% 279% 289% 300% 311%
18% 36% 42% 45% 51% 57% 63% 69% 72% 76% 80% 84% 91% 102% 115% 131% 150% 157% 164% 171% 179% 188% 196% 205% 214% 225% 236% 244% 254% 263% 273% 284%
16% 32% 38% 40% 46% 51% 57% 61% 65% 68% 71% 75% 81% 91% 103% 118% 135% 141% 147% 154% 161% 169% 176% 184% 192% 201% 211% 219% 227% 235% 244% 253%
19% 40% 47% 50% 58% 65% 71% 77% 81% 85% 89% 95% 102% 112% 126% 144% 165% 172% 180% 187% 196% 205% 214% 223% 233% 244% 256% 265% 275% 285% 296% 307%
19% 39% 45% 49% 56% 62% 68% 74% 78% 82% 86% 91% 98% 107% 121% 137% 157% 164% 171% 178% 186% 195% 203% 212% 222% 232% 243% 252% 261% 271% 281% 291%
23% 48% 55% 59% 68% 76% 83% 90% 95% 99% 104% 111% 119% 130% 147% 167% 191% 199% 207% 216% 226% 236% 246% 257% 269% 281% 295% 305% 317% 329% 341% 354%
Pietermaritzburg 23% 47% 55% 59% 67% 75% 82% 89% 94% 98% 103% 110% 118% 129% 145% 165% 190% 197% 206% 215% 224% 234% 245% 255% 267% 279% 292% 303% 314% 326% 338% 351%
14% 28% 32% 34% 39% 44% 48% 52% 55% 58% 61% 64% 69% 76% 85% 97% 111% 115% 120% 125% 130% 135% 141% 146% 152% 158% 165% 171% 178% 185% 192% 199%
Durban
32% 48% 53% 56% 62% 67% 72% 77% 80% 83% 87% 91% 96% 104% 115% 128% 144% 149% 154% 160% 166% 172% 179% 185% 192% 199% 207% 214% 222% 230% 238% 247%Gauteng – Durban system: development plan
Strategy
Axle Train control Electrical Capacity expansion Alignments
Natcor north: upgrade to 26t/a Signal infill scheme Upgrade to 25kV AC Reduce headway Gradients, curves, bypass/links
Expansion and investment
Section Phase Intervention ETC (Rm)
Rietvallei to Booth 1a Transformer replacement 638
Rietvallei to Booth 2a Implement CTC signal infill scheme to reduce headway 112
Glencoe to Cato Ridge 3a Relieve gradients and curves 13 733
Rietvallei to Booth 4a Upgrade to 25kV AC and voltage changeover at all DC traction intersections 5 330
Rietvallei to Booth 5a Train control system – ETCS (Level 3) 2 849
Cato Ridge to Durban 6a Cato Ridge bypass 20 375
Pyramid to Sentrarand 1c Double remainder of Gauteng freight ring lines and implement signal infill 1 565
Durban to Stanger 1b PRASA interface within eThekwini area 300
Durban to Richards Bay 2b Double single line between Stanger Richards Bay, 3kV DC, and CTC signalling 3 600
Sentrarand to Skansdam 2c Implement CTC signal infill scheme to reduce headway 350
Skansdam to Houtheuwel 3c New double track, 3kV DC, CTC signalling (PRASA bypass) 1 600
Donkerhoek – Pienaarsrivier 4c New single track chord from South to East (Sentrarand to Maputo) 60
Development plan
Phase
2032
2010
2011
2012
2013
2014
2015
2016
2017
2018
2019
2020
2021
2022
2023
2024
2025
2026
2027
2028
2029
2030
2031
Section
Rietvallei to Booth 1a 4 6 8 195 262 164
Rietvallei to Booth 2a 2 2 3 27 34 27 17 Research
Glencoe to Cato Ridge 3a 21 34 45 2 126 3 571 3 488 2 115 1 236 1 099 FEL – 1: Concept study
FEL – 2: Feasibility
Rietvallei to Booth 4a 8 16 32 1 333 1 706 1 439 797
Construction
Rietvallei to Booth 5a 5 28 43 627 712 712 427 293
Cato Ridge to Durban 6a 39 82 122 4 483 5 298 4 995 3 260 2 099
Pyramid to Sentrarand 1c 1 3 6 75 200 156 55
Durban to Stanger 1b 4 7 14 360 720 1 080 725 360 342
Durban to Richards Bay 2b 3 6 9 157 345 438 388 220
Sentrarand to Skansdam 2c 1 1 3 70 193 82
Skansdam to Houtheuwel 3c 3 6 10 160 353 448 396 224
Donkerhoek – Pienaarsrivier 4c 1 3 6 9 24 17
Total cash flow (Rm) 0 8 18 29 460 883 878 2 790 4 202 5 307 4 383 4 161 3 532 6 275 6 450 5 648 3 602 2 099 0 0 0 0 0Hubs and terminals: status quo
Zimbabwe
Musina
Namibia Mozambique
Botswana Waterberg Groenbult
Lephalale Coalfields
Phalaborwa
Rustenburg
Pretcon
Mahikeng Coalfields
Kascon/City Deep
Ermelo
Vaalcon Swaziland
Hotazel
Sishen Kroonstad Vryheid
Nakop
Lohatla
Glencoe
Kimberley
Richards
Bay
Bloemfontein Lesotho
Durban
De Aar
Noupoort
Intermodal terminal
General freight terminal
Saldanha
East London Mineral nodes
Cape Town Ngqura
Port ElizabethHubs and terminals: proposed locations 2041
Musina
Waterberg
Coalfields
Phalaborwa
Polokwane
Mahikeng Pyramid Maputo
Coalfields
Kascon/City Deep Sentrarand
Vaal Tambo Springs
Hotazel Koppies
Sishen
Lohatla
Harrismith
Super-terminal
Bloemfontein Richards Bay
Intermodal terminal Cato Ridge/Umlaas Rd
DCT (New)
Freight nodes Airport dig out
Mineral nodes
General freight terminal
Saldanha
Cape Town Belcon Ngqura
Port Elizabeth
The indicated freight nodes are not necessarily informed by demand but are proposed by public sector in support of
economic developmentGauteng container terminals: status quo
Roscon Pretcon
Sentrarand
Kaalfontein
Existing terminals
unable to meet
Kascon forecasted demand
beyond 2017
City Deep
Vaalcon
Gauteng currently has four intermodal terminals in operation. Together they have a maximum handling capacity of
650 000 TEUs per annum. The majority of destuffing activities occur at the ports. The demand for container transportation
will increase rapidly over the next 30 years and TFR aims to significantly increase its market share.
The graph reveals rail‟s planned increase in container TEU volumes over the next 30 years.Gauteng hubs and terminals: development plan
Pyramid
Roscon Pretcon
Kaalfontein
Sentrarand
Kascon
City
Deep
Tambo
Springs
Vaal Logistics
Development plan
2010
2011
2012
2013
2014
2015
2016
2017
2018
2019
2020
2021
2022
2023
2024
2025
2026
2027
2028
2029
2030
2031
2032
2033
2034
2035
2036
2037
2038
2039
Terminal Capacity ETC
Location
type created (Rm)
Tambo Springs CD
Container 400 000 800 4 34 68 175 369 149
Container 500 000 2 902 14 29 286 715 1 001 572 286
Palletised 4 500 000 313 2 3 31 77 108 62 31
Container 500 000 1 723 8 17 340 849 509
FEL – 1: Concept study
Palletised 4 500 000 1 695 8 17 167 417 584 334 167
FEL – 2: Feasibility
Container 500 000 1 702 8 17 168 419 587 335 168
Construction
Sentrarand
Container 500 000 1 905 9 19 375 938 563
Container 500 000 2 552 13 25 503 1 257 754
Container 500 000 1 695 8 17 334 835 501
Palletised 4 500 000 414 2 4 81 204 122
Automotive 558 000 449 2 4 44 111 155 89 44
Pyramid
Container 500 000 1 832 9 18 181 451 632 361 181
Palletised 4 500 000 487 2 5 48 120 168 96 48
Total cash flow (Rm) 18 471 18 65 358 934 1489 893 551 479 765 787 810 409 425 527 649 375 187 344 906 648 556 1060 1122 1274 1088 837 505 81 204 122Durban container terminals: status quo
`
Millions
Pier
Existing terminals
2 unable to meet
Pier forecasted demand
1 beyond 2013
TEU
Buffer
Stack
Bayhead Kings Rest
Yard Yard
Tank Wash Out
Facility
The port of Durban has two rail container terminals at pier 1 and DCT with 150 000 and 250 000 TEUs capacity respectively.
A buffer stack exists at Kings Rest yard which increases the overall capacity to about 450 000 TEUs.
Both Bayhead and Kings Rest yards can accommodate 50 wagon container trains which present a problem for the current
75 wagon Anaconda trains running along the corridor. With the increase in container traffic forecasted over the next
30 years it is vital to increase the port‟s current rail intermodal capacity to match the corridor and inland capacities.Durban hubs and terminals: development plan
Bayhead terminals
New DCT
terminals
Race course yard
Airport terminals Clairwood terminal
Wentworth yard
Development plan
Capacity
2012
2013
2014
2015
2016
2017
2018
2019
2020
2021
2022
2023
2024
2025
2026
2027
2028
2029
2030
2031
2032
2033
2034
2035
2036
2037
Terminal ETC
Location created
type (Rm)
(TEUs)
Bayhead 100 W yard N/A 677 406 271
Kings Rest Container 600 000 1 641 985 656
FEL – 1: Concept study
Bayhead Container 600 000 1 515 15 29 441 735 294
Race course 100 W yard N/A 574 6 11 56 139 195 111 56 FEL – 2: Feasibility
Airport Container 600 000 1 282 12 25 125 311 436 249 125 Construction
Airport Container 600 000 1 010 10 20 294 491 196
DCT Container 600 000 1 929 19 37 187 468 656 375 187
DCT Container 600 000 1 065 10 21 310 517 207
Airport Container 600 000 1 002 10 19 292 486 195
Airport Container 600 000 969 9 19 282 470 188
Bayhead Container 600 000 4 173 41 81 405 1 013 1 418 810 405
Total cash flow (Rm) 2 400 000 15 837 1 406 974 477 916 744 650 407 388 762 1 157 592 497 517 207 10 19 292 486 195 50 100 687 1 483 1 606 810 405Planned network (30 years)
TYPICAL PROFILE
Axle load Speed Train length Use
General freight line 20t per axle 60-100km/h 30-100 wagons General freight
Heavy haul line 26-30t per axle 40-80km/h 100-342 wagons Heavy bulk
Botswana link
Waterberg link
Swazi link
Cato Ridge
bypassLong-term network potential
TYPICAL PROFILE
Axle load Speed Train length Use
General freight line 20t per axle 60-100km/h 30-100 wagons General freight
Heavy haul line 26-30t per axle 40-80km/h 100-342 wagons Heavy bulk
High grade line 18-20t per axle 120-160km/h 20-50 wagons Passenger and intermodal Botswana link
Trans Kalahari
Waterberg link
Swazi link
Sishen
link
High
speed
Bypass
link Cato Ridge
bypass
Coastal
rail
Coastal
railNetwork future state: 2041
Axle load Electrification
Musina The bulk mineral export Musina
lines and feeder lines will
Lephalale
be upgraded to heavy haul Lephalale
status.
Ermelo Ermelo
Sishen Sishen
Kimberley Bloemfontein Richards
Conversion of 3kV DC old Kimberley Bloemfontein Richards
Bay
technology to 25kV AC is Bay
Durban Durban
preferred. Some sections
to retain 3kV DC with low
capacity being de-
Saldanha East London
electrified. Saldanha East London
Cape Town Cape Town
Port Elizabeth Port Elizabeth
Train control
Musina
Lephalale
In-cab signalling to be rolled out
Ermelo
firstly on heavy haul lines to
maximise throughput and improve
Sishen system safety.
Kimberley Bloemfontein Richards
Bay
Durban
Saldanha East London
Cape Town
Port ElizabethLocomotives future classification strategy Status Quo
Locomotive type Locomotive application Sample
Electric heavy haul – 50kV Specifically used on the ore line 15E
Electric heavy haul – 3kV/25kV Operations on coal line or GFB corridor where
19E
Dual voltage 26 ton per axle this axle load is permitted
Electric general purpose – 3kV/25kV
To be used on all GFB corridors 20E
Dual voltage 21 ton per axle
General Purpose Diesel – 300kN/350kN To be used across all corridors including the
43D
21 tons per axle with AC traction motors coal and ore export lines
Trip and shunting loco – Dual voltage Light hauler and shunt locomotive on branch
Still to be procured
25kV/3kV, diesel 750 kW, double cab lines and in yards: 18 ton axle loadRolling stock – locomotives future required fleet Status Quo
Locomotives: Future Required Fleet New locomotive committed investment
Coal Line New 110 dual
10 000
voltage Locomotives
9 000
43 x 43D -Diesel
8 000 Locomotives - GFB
7 000 GFB Locomotives x 95
Rm
6 000
5 000 19E Additional 108
Locomotives
4 000
Locomotives (Export
3 000 Iron Ore)-80 Mtpa
2 000 599 Locomotives GFB
1 000 176mt Electrics
0 465 Locomotives GFB
2012 2013 2014 2015 2016 2017 2018 176mt Diesels
Run-out fleet replaced with new locomotives annually
Locomotive investment – 30 years
Rm
New 19E locomotive (AC 25kV/DC 3kV)You can also read