Prevalence of commonly diagnosed disorders in UK dogs under primary veterinary care: results and applications
←
→
Page content transcription
If your browser does not render page correctly, please read the page content below
O’Neill et al. BMC Veterinary Research   (2021) 17:69
https://doi.org/10.1186/s12917-021-02775-3

 RESEARCH ARTICLE                                                                                                                                    Open Access

Prevalence of commonly diagnosed
disorders in UK dogs under primary
veterinary care: results and applications
Dan G. O’Neill1*, Hannah James2, Dave C. Brodbelt1, David B. Church3 and Camilla Pegram1

  Abstract
  Background: Although dogs are a commonly owned companion animal in the UK, the species experiences many
  health problems that are predictable from demographic information. This study aimed to use anonymised
  veterinary clinical data from the VetCompass™ Programme to report the frequency of common disorders of dogs
  under primary veterinary care in the UK during 2016 and to explore effects associated with age, sex and neuter
  status.
  Results: From an available population of 905,543 dogs under veterinary care at 886 veterinary clinics during 2016,
  the current study included a random sample of 22,333 (2.47 %) dogs from 784 clinics. Prevalence for each disorder
  was calculated at the most refined level of diagnostic certainty (precise-level precision) and after grouping to a
  more general level of diagnostic precision (grouped-level precision). The most prevalent precise-level precision
  disorders recorded were periodontal disease (prevalence 12.52 %, 95 % CI: 12.09–12.97), otitis externa (7.30 %, 95 %
  CI: 6.97–7.65) and obesity (7.07 %, 95 % CI: 6.74–7.42). The most prevalent grouped-level disorders were dental
  disorder (14.10 %, 95 % CI: 13.64–14.56), skin disorder (12.58 %, 95 % CI: 12.15–13.02) and enteropathy (10.43 %, 95 %
  CI: 10.04–10.84). Associations were identified for many common disorders with age, sex and neuter.
  Conclusions: The overall findings can assist veterinarians and owners to prioritise preventive care and to
  understand demographic risk factors in order to facilitate earlier diagnosis of common disorders in dogs. The
  information on associations with age, sex and neuter status provides additional contextual background to the
  complexity of disorder occurrence and supports targeted health controls for demographic subsets of dogs.
  Keywords: VetCompass, Electronic patient record, EPR, Breed, Dog, Epidemiology, Primary‐care, Veterinary,
  Pedigree, Purebred

Background                                                                              health problems that are not random events but may be
Dogs are a common companion animal species in the                                       associated with various risk factors including age, sex,
UK, with 26 % of the UK adult population owning a dog                                   neuter status and breed [6–8]. Whilst progress towards
and an estimated 9.9 million dogs owned in the UK [1].                                  improved dog health and welfare requires collaboration
Dog ownership has many reported benefits for both the                                   between all those working in dog health, science and
humans and the dogs involved [2–5]. However, a grow-                                    welfare [6, 9], the generation of reliable evidence on the
ing body of evidence suggests that dogs experience many                                 breadth of health conditions across the wider dog popu-
                                                                                        lation is a recurring and key constraint that limits effect-
* Correspondence: doneill@rvc.ac.uk                                                     ive welfare reforms and improvement [10].
1
 Pathobiology and Population Sciences, The Royal Veterinary College,
Hawkshead Lane, North Mymms, AL9 7TA Hatfield, Herts, UK
                                                                                          Access to large data resources holding both demo-
Full list of author information is available at the end of the article                  graphic and health information on the general
                                         © The Author(s). 2021 Open Access This article is licensed under a Creative Commons Attribution 4.0 International License,
                                         which permits use, sharing, adaptation, distribution and reproduction in any medium or format, as long as you give
                                         appropriate credit to the original author(s) and the source, provide a link to the Creative Commons licence, and indicate if
                                         changes were made. The images or other third party material in this article are included in the article's Creative Commons
                                         licence, unless indicated otherwise in a credit line to the material. If material is not included in the article's Creative Commons
                                         licence and your intended use is not permitted by statutory regulation or exceeds the permitted use, you will need to obtain
                                         permission directly from the copyright holder. To view a copy of this licence, visit http://creativecommons.org/licenses/by/4.0/.
                                         The Creative Commons Public Domain Dedication waiver (http://creativecommons.org/publicdomain/zero/1.0/) applies to the
                                         data made available in this article, unless otherwise stated in a credit line to the data.
O’Neill et al. BMC Veterinary Research (2021) 17:69 Page 2 of 14 population of dogs is critical to provide reliable disorder using broad evidence bases that consider disorder preva- prevalence information on dogs [11, 12]. National pro- lence, severity and duration along with other factors in- jects that hold anonymised veterinary clinical records cluding predisposition, amenability to change and owner from a diversity of primary-care practices have been relevance [9, 36, 37]. To date, however, the applications identified as key resources for high quality health infor- of such targeted welfare strategies have been constrained mation relating to the wider population of dogs [10, 11, by limited availability of published evidence on disorder 13]. Over the past decade, several epidemiological pro- risk within age, sex and neuter strata [16, 38]. jects housing large health databases on companion ani- Association between age and disorder occurrence was mals have been established including VetCompass reported in a recent study of dogs presenting to veterin- (VetCompass 2020) and SAVSNET (SAVSNET 2019) in ary clinics in the Republic of Korea that showed distinct the UK, PETscan in the Netherlands (PETscan 2019), disorder profiles across age groups [39]. Young dogs (< 1 BARK in the US [14] and VetCompass Australia in year) had higher risk of presenting with diarrhoea, Australia (VetCompass 2020). There are also plans to vomiting and infectious diseases, whilst older dogs (> 10 develop similar projects in other countries including years) were more likely to present with disorders such as New Zealand [15]. Epidemiological analyses of primary heart disease, kidney disease, Cushing’s disease, and care veterinary data offer many advantages, including ac- mammary tumours. Substantial variation in disorder cess to large volumes of clinical data that are contem- risks between age strata was also reported using ques- poraneously recorded at the time of the clinical events tionnaire health datactions to address these concerns [a by veterinary professionals and where diagnoses are up- collected on 43,005 dogs registered with the Kennel dated over time as new information comes available Club (KC) in the UK [40]. Other studies of specific dis- [13]. The pace of publication of research based on these orders have also highlighted age, sex and neuter status primary care clinical data is currently accelerating [16– as key risk factors to consider during evaluations for dis- 19] and is contributing substantially to improved clinical order occurrence [16, 38, 41–43]. practice activities [20, 21] and breed health reforms An enhanced evidence base on the overall disorder [22, 23]. burden of dogs broken down by breed, age and sex An early study published in 2014 used primary-care could support the development of targeted health strat- clinical data to provide information on the overall dis- egies for dogs by a range of stakeholders. For example, order burden in dogs by reporting the prevalence of the the UK KC has designed its breed health strategies to 20 most common disorders recorded in dogs in England prioritise key health concerns in order to achieve max- [7]. That paper placed particular focus on the effect of imum health improvement overall [44]. Within this breed as a risk factor for common disorders and overall plan, the KC implemented its ‘Breed Health and highlighted wide prevalence variation between breeds for Conservation Plans’ programme in 2016 to collate data common disorders. That study included 3,884 dogs from from mutliple sources and provide breeds with an 89 clinics and identified the most frequently recorded evidence-based overview of current health concerns disorders as otitis externa, periodontal disease and anal within their population as well as providing a series of sac impaction. Following that original report on dogs useful recommended actions to address these concerns overall, subsequent publications have reported the most [37]. However, the limited evidence base that was avail- common disorders within individual dog breeds and able on the frequency and risk factors for disorder oc- highlighted clearly differing disorder profiles between currence in the earlier days of these Breed Health and breeds: Border Terrier [24], Bulldog [25], Cavalier King Conservation Plans was a critical limitation to their util- Charles Spaniel [26], Chihuahua [27], French Bulldog ity at that time, particularly in respect of prioritisation of [28], German Shepherd Dog [29], Greyhound [30], Lab- health concerns. Increased information on disorder fre- rador Retriever [31], Miniature Schnauzer [32], Pug [33], quency along with age, sex and breed risk effects would Rottweiler [34] and West Highland White Terrier [35]. strengthen the Breed Health and Conservation Plans, as These breed-specific studies also began to explore dis- well as many other health strategies, to optimise delega- order associations with age, sex and neuter, and exposed tion of resources in a targeted fashion and improve as- the substantial complexity behind disorder occurrence in pects such as owner awareness, assisting veterinarians dogs. Identification of age, sex and neuter strata with working in practice and funding of further research in higher risk for disorder occurrence suggests that health under-investigated areas [10]. and welfare strategies to mitigate welfare harms from in- With a perspective of providing reliable information dividual disorders may additionally benefit from targeted on common disorders in the wider population of dogs, focus on predisposed age, sex or neuter strata to opti- this study aimed to use anonymised veterinary clinical mise outcomes [35]. There are currently aspirations to data from the VetCompass™ Programme (VetCompass move towards greater targeting of welfare approaches 2020) to report the frequencies of common disorders of
O’Neill et al. BMC Veterinary Research (2021) 17:69 Page 3 of 14
dogs under primary veterinary care in the UK during animals (6.12 years, IQR 3.58–9.28, range 0.17–20.46)
2016. Prevalence was calculated at the most refined level (P < 0.001). Females were more likely to be neutered (4,
of diagnostic certainty (precise-level precision) for each 856/10,540, 46.07 %) than males (5,241/11,718, 44.73 %)
disorder and also following grouping to a more general (P = 0.044). Data completeness for each variable was: sex
level of diagnostic precision (grouped-level precision). 99.7 %, neuter 99.7 % and age 98.8 %.
Given the value of deeper understanding of specific risk
factors for disease, the study placed special focus on ex- Summary disorder occurrence
ploring effects associated with age, sex and neuter status. From the random sample of 22,333 dogs whose EPRs
These results could assist veterinary practitioners, were manually examined to extract all recorded disorder
breeders and owners with an evidence base to under- data for 2016, there were 14,704 (65.84 %) dogs with at
stand and predict likely disorder occurrence and to least one disorder recorded during 2016. The EPRs of
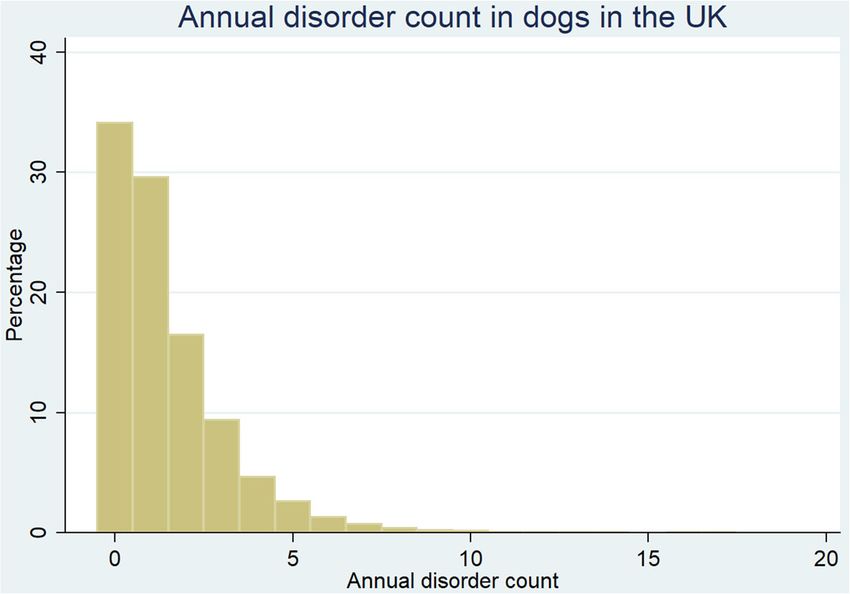
identify key health and welfare opportunities for dogs. the remaining 7,629 (34.16 %) dogs had no disorder re-
The overall results reported from this study could also corded and either presented for prophylactic manage-
act as a benchmark baseline for wider comparison in ment only or did not present at all during 2016. The
other studies that elect to focus on specific breeds, ages, median annual disorder count per dog during 2016 was
sexes or neuter status. 1 disorder (IQR 0–2, range 0–17) (Fig. 1).
The proportion of females (65.51 %) with at least one dis-
Results order recorded did not differ to males (66.31 %) (P = 0.211).
Demography Neutered animals (71.66 %) had a higher probability of hav-
From an available population of 905,543 dogs under vet- ing at least one disorder recorded that entire animals
erinary care at 886 veterinary clinics during 2016, the (61.17 %) (P < 0.001). There was some evidence that the
current study included a random sample of 22,333 median annual disorder count was higher in males (1, IQR
(2.47 %) dogs from 784 clinics. The median age of this 0–2, range 0–14) than in females (1, IQR 0–1, range 0–17)
sample of dogs was 4.40 years (interquartile range [IQR] (P = 0.049). The median age of dogs with at least one
1.87–8.05, range 0.01–20.46). Of sample dogs with infor- disorder recorded (5.15 years, IQR 2.24–8.84, range 0.16–
mation available, there were 10,540 (47.35 %) females 20.46) was older than for dogs that did not have any
and 10,097 (45.36 %) neutered animals. The median age disorder recorded (3.33 years, IQR 1.42–6.28, 0.01–19.54)
of females (4.46 years, IQR 1.93–8.11, range 0.01–20.46) (P < 0.001). The median annual disorder count was higher
did not differ significantly to males (4.34 years, IQR in neutered (1, IQR 0–2, range 0–17) than in entire (1, IQR
1.84–7.99, range 0.01–19.54) (P = 0.087). The median 0–2, range 0–16) (P < 0.001). There was a positive correl-
age of entire animals (2.79 years, IQR 1.20–6.40, range ation between age and disorder count (Spearman’s rho
0.01–19.83) was significantly younger than for neutered 0.24, P < 0.001).
Fig. 1 Annual disorder count for dogs (n = 22,333) under UK primary veterinary care from January 1st 2016 to December 31st, 2016 at practices
participating in the VetCompass™ ProgrammeO’Neill et al. BMC Veterinary Research (2021) 17:69 Page 4 of 14
Precise‐level disorder occurrence between entire and neutered animals. Neutered animals
The study included 32,243 unique disorder events re- had higher odds than entire animals for 5 disorders:
corded during 2016 that encompassed 678 precise-level obesity, dental disorder, musculoskeletal disorder, incon-
disorder terms. The most prevalent precise-level preci- tinence and behaviour disorder. There were 4 disorders
sion disorders recorded were periodontal disease (n = 2, with higher odds in entire animals compared with neu-
797, prevalence 12.52 %, 95 % CI: 12.09–12.97), otitis tered animals: female reproductive disorder, male repro-
externa (1,631, 7.30 %, 95 % CI: 6.97–7.65), obesity (1, ductive system disorder, underweight and parasite
580, 7.07 %, 95 % CI: 6.74–7.42), overgrown nail(s) (1, infestation (Table 2).
233, 5.52 %, 95 % CI: 5.23–5.83), anal sac impaction (1,
071, 4.80 %, 95 % CI 4.52–5.08) and diarrhoea (852, Discussion
3.81 %, 95 % CI 3.57–4.07) (Table 1). This is the largest study to date using primary-care vet-
Among the 70 most common precise-level disorders, erinary data that reports on the common disorders in
the odds for 14 (20.0 %) disorders differed between the UK dogs. The study placed specific focus on exploring
sexes after accounting for confounding. Males had age, sex and neuter associations with disorder occur-
higher odds than females for 10 disorders: otitis externa, rence. At a precise level of diagnostic precision, the most
aggression, coughing, seizure disorder, foreign body, ad- commonly recorded disorders were periodontal disease,
verse reaction to drug, moist dermatitis, wound, lacer- otitis externa, obesity, overgrown nail(s) and anal sac im-
ation, osteoarthritis. Females had higher odds than paction. Whilst at a grouped level of diagnostic preci-
males for 4 disorders: urinary incontinence, urinary tract sion, the most common groups were dental disorder,
infection, mammary mass and overgrown nail(s). After skin disorder, enteropathy and musculoskeletal disorder.
accounting for confounding, there were 11/70 (15.7 %) Awareness of the most common disorders of dogs can
precise-level disorders with differing odds between entire assist efforts to prioritise health reforms in dogs at a spe-
and neutered animals. Neutered animals had higher cies level [45, 46]. Differing associations between cat-
odds than entire animals for 8 disorders: obesity, peri- egories of sex, neuter and age were reported for many
odontal disease, lipoma, urinary incontinence, urinary common disorders, suggesting that these demographic
tract infection, osteoarthritis, atopic dermatitis, lacer- features are important factors that need to be considered
ation. There were 3 disorders with higher odds in entire when exploring the epidemiology of these disorders and
animals compared with neutered animals: mammary during the application of epidemiological information
mass, flea infestation and weight loss. The median age of into health reforms. The overall findings can assist veter-
dogs recorded with each of the 70 most common inarians and owners to prioritise preventive care and to
precise-level disorders varied from 1.03 years for umbil- facilitate earlier diagnosis of common disorders within
ical hernia to 12.71 years for disorder unspecified dogs. The information on associations with age, sex and
(Table 1). neuter provides additional contextual background to the
complex world of disorder occurrence and can support
Grouped‐level disorder occurrence targeted health controls for these subsets of dogs.
There were 68 distinct grouped-level disorder terms re- A smaller previous UK study using primary veterinary
corded. The most prevalent grouped-level disorders were clinical data from 2009 to 2013 reported the most
dental disorder (n = 3,148, prevalence: 14.10 %, 95 % CI: common disorders in dogs as otitis externa, periodontal
13.64–14.56), skin disorder (2,810, 12.58 %, 95 % CI: disease, anal sac impaction, overgrown nail(s) and de-
12.15–13.02), enteropathy (2,330, 10.43 %, 95 % CI: generative joint disease [7]. These findings are largely in
10.04–10.84), musculoskeletal (1,929, 8.64 %, 95 % CI line with the current study, though the current study re-
8.27–9.01), ear disorder (1,825, 8.17 %, 7.82–8.54) and ports a slightly higher prevalence of obesity and lower
obesity (1,580, 7.07 %, 95 % CI: 6.74–7.42) (Table 2). prevalence of osteoarthritis. Although this could indicate
Among the 36 most common grouped-level disorders, a genuine change in disorder prevalence over time, these
the odds for 11 (30.5 %) disorders differed between the differences are more likely to reflect methodological dif-
sexes after accounting for confounding. Males had ferences between the studies. Compared to the 3,998
higher odds than females for 8 disorders: traumatic in- dogs in the earlier report, the larger sample size of 22,
jury, ear disorder, brain disorder, musculoskeletal dis- 333 dogs in the current study offers greater current pre-
order, behaviour disorder, foreign body, upper cision. In addition, the methods used to extract disorder
respiratory tract disorder, and adverse reaction to drug. data from the clinical records have also advanced con-
Females had higher odds than males for 3 disorders: siderably during the intervening years [47], meaning that
urinary system disorder, incontinence and claw/nail dis- the current study was more highly powered and techno-
order. After accounting for confounding, there were 9/ logically enabled than the previous study. The ranking of
36 (25.0 %) grouped-level disorders with differing odds the most common disorders in the current study thatO’Neill et al. BMC Veterinary Research (2021) 17:69 Page 5 of 14
Table 1 Prevalence of the 70 most common disorders (at least 100 events) at a precise-level of diagnostic precision recorded in
dogs (n = 22,333) under primary-care veterinary care at UK practices participating in the VetCompass™ Programme from January 1st
to December 31st, 2016. The odds ratio and P-values reflect the odds in males compared to females, and the odds in neutered dogs
compared to entire dogs. P-values less than 0.05 shown in bold. *CI confidence interval
Precise-level No. Overall 95 % CI* Odds ratio: 95 % P-Value Odds ratio: 95 % P-Value Median
disorder term % male confidence neutered confidence age
compared with interval compared with interval (years)
female entire
Periodontal 2797 12.52 12.09–12.97 1.01 0.92–1.11 0.903 1.22 1.11–1.34 < 0.001 7.54
disease
Otitis externa 1631 7.30 6.97–7.65 1.23 1.09–1.39 0.001 0.99 0.87–1.13 0.881 4.72
Obesity 1580 7.07 6.74–7.42 0.89 0.79-1.00 0.055 1.44 1.27–1.64 < 0.001 5.99
Overgrown nail(s) 1233 5.52 5.23–5.83 0.81 0.70–0.93 0.003 0.91 0.79–1.06 0.229 4.68
Anal sac 1071 4.80 4.52–5.08 0.96 0.83–1.11 0.572 1.15 0.99–1.34 0.069 5.24
impaction
Diarrhoea 852 3.81 3.57–4.07 1.04 0.87–1.23 0.667 1.04 0.87–1.25 0.671 2.93
Vomiting 679 3.04 2.82–3.27 0.97 0.80–1.17 0.749 0.99 0.81–1.21 0.944 3.54
Lameness 591 2.65 2.44–2.87 1.04 0.86–1.27 0.679 1.05 0.85–1.29 0.663 5.50
Osteoarthritis 522 2.34 2.14–2.54 1.24 1.01–1.52 0.045 1.33 1.06–1.67 0.013 11.30
Aggression 501 2.24 2.05–2.45 1.76 1.41–2.21 < 0.001 1.09 0.88–1.37 0.431 5.46
Conjunctivitis 500 2.24 2.05–2.44 1.00 0.81–1.23 0.979 1.04 0.83–1.30 0.739 4.03
Heart murmur 475 2.13 1.94–2.32 1.01 0.80–1.27 0.943 0.80 0.63–1.02 0.071 10.03
Skin mass 463 2.07 1.89–2.27 1.13 0.92–1.40 0.245 1.20 0.96–1.51 0.108 9.11
Flea infestation 458 2.05 1.87–2.25 0.89 0.71–1.12 0.320 0.71 0.56–0.91 0.006 4.18
Pruritus 363 1.63 1.46–1.80 0.94 0.74–1.20 0.617 1.03 0.80–1.33 0.826 4.79
Allergy 350 1.57 1.41–1.74 1.07 0.84–1.36 0.605 1.08 0.84–1.40 0.519 4.97
Undesirable 334 1.50 1.34–1.66 1.07 0.83–1.40 0.594 1.26 0.95–1.66 0.110 3.47
behaviour
Pyoderma 325 1.46 1.30–1.62 0.96 0.75–1.24 0.757 0.85 0.65–1.10 0.209 5.37
Lipoma 322 1.44 1.29–1.61 1.22 0.94–1.58 0.127 1.58 1.18–2.11 0.002 10.10
Claw injury 309 1.38 1.23–1.55 1.08 0.84–1.38 0.558 1.03 0.79–1.33 0.851 4.89
Pododermatitis 303 1.36 1.21–1.52 1.18 0.91–1.53 0.210 1.29 0.98–1.69 0.070 5.58
Gastroenteritis 298 1.33 1.19–1.49 1.23 0.93–1.62 0.153 1.15 0.86–1.54 0.357 3.87
Foreign body 283 1.27 1.12–1.42 1.53 1.13–2.08 0.006 1.20 0.88–1.63 0.262 2.81
Post-operative 265 1.19 1.05–1.34 0.84 0.56–1.26 0.394 0.93 0.60–1.43 0.727 3.33
wound
complication
Atopic dermatitis 256 1.15 1.01–1.29 1.00 0.76–1.32 0.989 1.36 1.02–1.83 0.040 5.75
Wound 250 1.12 1.01–1.29 1.42 1.05–1.92 0.022 0.83 0.61–1.13 0.237 3.84
Skin cyst 246 1.10 0.97–1.25 0.84 0.63–1.12 0.244 0.89 0.66–1.21 0.466 7.63
Patellar luxation 233 1.04 0.91–1.19 0.85 0.64–1.14 0.289 1.07 0.79–1.47 0.655 4.29
Retained 225 1.01 0.88–1.15 1.27 0.86–1.88 0.220 0.99 0.64–1.54 0.964 1.33
deciduous tooth
Coughing 220 0.99 0.86–1.12 1.68 1.21–2.33 0.002 0.93 0.67–1.30 0.685 6.02
Kennel Cough 215 0.96 0.84–1.10 1.13 0.82–1.56 0.462 0.91 0.65–1.29 0.602 3.78
Cataract 209 0.94 0.81–1.07 0.87 0.63–1.21 0.405 1.20 0.84–1.71 0.308 12.00
Umbilical hernia 208 0.93 0.81–1.07 0.76 0.48–1.18 0.225 0.94 0.56–1.59 0.831 1.03
Anal sac infection 200 0.90 0.78–1.03 0.79 0.58–1.08 0.137 0.78 0.57–1.07 0.123 5.96
Moist dermatitis 200 0.90 078-1.03 1.54 1.11–2.13 0.010 0.74 0.53–1.03 0.070 5.11
Alopecia 186 0.83 0.72–0.96 0.89 0.63–1.27 0.530 0.70 0.48–1.01 0.054 5.19O’Neill et al. BMC Veterinary Research (2021) 17:69 Page 6 of 14
Table 1 Prevalence of the 70 most common disorders (at least 100 events) at a precise-level of diagnostic precision recorded in
dogs (n = 22,333) under primary-care veterinary care at UK practices participating in the VetCompass™ Programme from January 1st
to December 31st, 2016. The odds ratio and P-values reflect the odds in males compared to females, and the odds in neutered dogs
compared to entire dogs. P-values less than 0.05 shown in bold. *CI confidence interval (Continued)
Precise-level No. Overall 95 % CI* Odds ratio: 95 % P-Value Odds ratio: 95 % P-Value Median
disorder term % male confidence neutered confidence age
compared with interval compared with interval (years)
female entire
Haircoat disorder 183 0.82 0.71–0.95 1.14 0.80–1.63 0.480 0.90 0.62–1.31 0.586 3.66
Disorder 181 0.81 0.70–0.94 1.05 0.69–1.59 0.819 1.21 0.78–1.88 0.405 12.71
unspecified
Thin 177 0.79 0.68–0.92 0.97 0.64–1.47 0.889 0.77 0.49–1.19 0.236 2.39
Dental disease 177 0.79 0.68–0.92 0.94 0.67–1.32 0.731 1.28 0.89–1.85 1.182 6.37
Urinary 175 0.78 0.67–0.91 0.24 0.16–0.37 < 0.001 1.90 1.23–2.95 0.004 11.60
incontinence
Corneal ulceration 172 0.77 0.66–0.89 0.97 0.67–1.42 0.885 0.94 0.63–1.40 0.759 7.42
Dog bite 166 0.74 0.63–0.86 1.10 0.77–1.59 0.593 0.75 0.51–1.10 0.139 4.07
Ocular discharge 165 0.74 0.63–0.86 0.80 0.56–1.17 0.250 0.79 0.53–1.18 0.255 3.63
Laceration 160 0.72 0.61–0.84 1.50 1.02–2.20 0.037 1.51 1.01–2.57 0.043 3.58
Dermatitis 160 0.72 0.61–0.84 0.87 0.60–1.26 0.475 0.98 0.66–1.44 0.908 4.61
Collapsed 158 0.71 0.60–0.83 1.02 0.70–1.51 0.905 0.87 0.58–1.29 0.480 12.37
Skin lesions 156 0.70 0.59–0.82 1.18 0.79–1.77 0.411 0.88 0.58–1.34 0.562 3.22
Colitis 155 0.69 0.59–0.81 1.41 0.95–2.09 0.088 1.26 0.83–1.90 0.280 4.19
Seizure disorder 151 0.68 0.57–0.79 1.82 1.23–2.76 0.003 0.96 0.65–1.43 0.850 8.16
Tick infestation 151 0.68 0.57–0.79 0.97 0.66–1.42 0.870 0.99 0.66–1.49 0.973 3.84
Papilloma 150 0.67 0.57–0.79 1.01 0.70–1.46 0.947 1.16 0.79–1.71 0.453 10.63
Cruciate disease 149 0.67 0.56–0.78 0.71 0.50–1.01 0.055 1.34 0.91–1.97 0.138 7.57
Post-operative 148 0.66 0.56–0.78 0.84 0.56–1.26 0.394 0.93 0.60–1.43 0.727 2.42
complication (not
wound-related)
Anorexia 146 0.65 0.55–0.77 1.06 0.72–1.58 0.755 0.90 0.60–1.36 0.617 7.43
Stiffness 142 0.64 0.55–0.75 1.08 0.75–1.57 0.665 1.16 0.78–1.72 0.467 10.72
Urinary tract 131 0.59 0.49–0.70 0.33 0.21–0.50 < 0.001 1.85 1.17–2.92 0.008 8.50
infection
Anxious/distressed 130 0.58 0.49–0.69 1.11 0.74–1.67 0.617 1.03 0.67–1.57 0.894 4.65
Cryptorchidism 127 0.57 0.47–0.68 ~ ~ ~ ~ ~ ~ 1.34
Lethargy 126 0.56 0.47–0.67 1.20 0.78–1.85 0.410 1.13 0.72–1.77 0.609 5.21
Dietary 125 0.56 0.47–0.67 1.27 0.81–1.98 0.291 1.12 0.70–1.79 0.637 2.04
indiscretion
Weight loss 120 0.54 0.45–0.64 0.78 0.51–1.18 0.240 0.64 0.41–0.99 0.044 11.20
Adverse reaction 117 0.52 0.43–0.63 1.84 1.17–2.87 0.008 1.05 0.67–1.65 0.836 3.54
to drug
Musculoskeletal 115 0.51 0.43–0.62 1.40 0.91–2.14 0.127 1.34 0.85–1.12 0.207 4.74
injury
Ear disorder 113 0.51 0.42–0.61 1.29 0.84–1.98 0.247 1.15 0.73–1.79 0.545 4.33
Polyuria/polydipsia 110 0.49 0.41–0.59 0.84 0.54–1.29 0.426 1.34 0.84–2.14 0.225 10.31
Flea bite 108 0.48 0.40–0.58 0.87 0.55–1.37 0.547 0.64 0.40–1.02 0.061 4.85
hypersensitivity
Gastritis 105 0.47 0.38–0.57 0.78 0.47–1.28 0.328 0.88 0.52–1.48 0.622 4.05
Spinal pain 103 0.46 0.38–0.56 0.85 0.55–1.31 0.463 0.89 0.57–1.40 0.624 7.91
Mammary mass 102 0.46 0.37–0.55 0.01 0.00-0.07 < 0.001 0.41 0.25–0.69 0.001 10.58O’Neill et al. BMC Veterinary Research (2021) 17:69 Page 7 of 14
Table 2 Prevalence of the 36 most common disorders (at least 100 events) at a grouped-level of diagnostic precision recorded in
dogs (n = 22,333) under primary-care veterinary care at UK practices participating in the VetCompass™ Programme from January 1st
to December 31st, 2016. The odds ratio and P-values reflect the odds in males compared to females, and the odds in neutered dogs
compared to entire dogs. *CI confidence interval
Grouped-level No. Overall 95 % CI* Odds ratio: male 95 % P-Value Odds ratio: 95 % P-Value Median
disorder term % compared with confidence neutered confidence age
female interval compared with interval (years)
entire
Dental disorder 3148 14.10 13.64–14.56 1.00 0.91–1.09 0.948 1.22 1.11–1.35 < 0.001 7.12
Skin disorder 2810 12.58 12.15–13.02 1.01 0.92–1.11 0.761 1.00 0.91–1.10 0.991 5.00
Enteropathy 2330 10.43 10.04–10.84 1.07 0.96–1.19 0.233 1.05 0.93–1.18 0.422 3.42
Musculoskeletal 1929 8.64 8.27–9.01 1.18 1.05–1.32 0.004 1.19 1.06–1.34 0.004 7.53
disorder
Ear disorder 1825 8.17 7.82–8.54 1.21 1.07–1.35 0.002 1.03 0.92–1.17 0.584 4.82
Obesity 1580 7.07 6.74–7.42 0.89 0.79-1.00 0.052 1.44 1.27–1.64 < 0.001 5.99
Claw/nail disorder 1577 7.06 6.73–7.41 0.87 0.77–0.99 0.032 0.94 0.82–1.07 0.341 4.74
Ophthalmological 1567 7.02 6.68–7.36 0.93 0.82–1.06 0.287 1.11 0.97–1.27 0.121 6.45
disorder
Anal sac disorder 1248 5.59 5.29–5.90 0.92 0.81–1.05 0.231 1.07 0.93–1.23 0.350 5.39
Mass 1169 5.23 4.95–5.53 0.95 0.82–1.09 0.437 1.02 0.88–1.18 0.760 9.19
Behaviour 1140 5.10 4.82–5.40 1.24 1.07–1.43 0.004 1.19 1.03–1.39 0.023 4.65
disorder
Neoplasia 1140 5.10 4.82–5.40 1.03 0.89–1.19 0.679 1.11 0.96–1.29 0.172 9.19
Parasite 850 3.81 3.56–4.07 0.93 0.78–1.11 0.422 0.77 0.64–0.93 0.006 3.14
infestation
Traumatic injury 822 3.68 3.44–3.94 1.33 1.12–1.58 0.001 1.01 0.84–1.20 0.946 3.68
Upper respiratory 789 3.53 3.29–3.78 1.25 1.05–1.49 0.012 0.90 0.75–1.08 0.257 4.37
tract disorder
Heart disease 633 2.83 2.62–3.06 0.97 0.80–1.19 0.798 0.91 0.74–1.12 0.385 10.17
Complication 417 1.87 1.69–2.05 0.82 0.65–1.04 0.097 0.89 0.70–1.14 0.372 3.09
associated with
clinical care
Female 328 1.47 1.32–1.64 ~ ~ ~ 0.37 0.28–0.50 < 0.001 3.77
reproductive
disorder
Brain disorder 320 1.43 1.28–1.60 1.52 1.16–1.99 0.002 1.15 0.87–1.52 0.318 9.14
Underweight 316 1.41 1.26–1.58 0.93 0.70–1.24 0.625 0.63 0.48–0.90 0.004 6.51
Foreign body 283 1.27 1.12–1.42 1.53 1.13–2.08 0.006 1.20 0.87–1.63 0.262 2.81
Lethargy 273 1.22 1.08–1.38 0.90 0.63–1.20 0.475 0.80 0.59–1.08 0.143 5.65
Urinary system 267 1.20 1.06–1.35 0.44 0.33–0.59 < 0.001 1.32 0.98–1.79 0.072 7.87
disorder
Hernia 255 1.14 1.01–1.29 0.80 0.53–1.17 0.247 0.85 0.55–1.31 0.458 1.09
Spinal cord 216 0.97 0.84–1.10 1.09 0.79–1.51 0.587 1.06 0.75–1.49 0.740 9.56
disorder
Male reproductive 199 0.89 0.77–1.02 ~ ~ ~ 0.31 0.19–0.48 < 0.001 1.72
system disorder
Incontinence 192 0.86 0.74–0.99 0.29 0.20–0.43 < 0.001 1.68 1.12–2.53 0.013 11.70
Endocrine system 191 0.86 0.74–0.98 0.87 0.63–1.20 0.400 1.25 0.88–1.78 0.200 10.84
disorder
Disorder not 181 0.81 0.70–0.94 1.03 0.68–1.56 0.880 1.18 0.76–1.83 0.464 12.71
diagnosed
Collapsed 164 0.73 0.63–0.86 1.06 0.73–1.55 0.750 0.89 0.60–1.32 0.547 12.35
Appetite disorder 156 0.70 0.59–0.82 1.03 0.70–1.51 0.889 1.00 0.67–1.50 0.996 7.43O’Neill et al. BMC Veterinary Research (2021) 17:69 Page 8 of 14
Table 2 Prevalence of the 36 most common disorders (at least 100 events) at a grouped-level of diagnostic precision recorded in
dogs (n = 22,333) under primary-care veterinary care at UK practices participating in the VetCompass™ Programme from January 1st
to December 31st, 2016. The odds ratio and P-values reflect the odds in males compared to females, and the odds in neutered dogs
compared to entire dogs. *CI confidence interval (Continued)
Grouped-level No. Overall 95 % CI* Odds ratio: male 95 % P-Value Odds ratio: 95 % P-Value Median
disorder term % compared with confidence neutered confidence age
female interval compared with interval (years)
entire
Intoxication 154 0.69 0.59–0.81 1.44 0.93–2.22 0.099 0.99 0.63–1.54 0.956 2.36
Lower respiratory 151 0.68 0.57–0.79 1.07 0.73–1.58 0.717 1.09 0.72–1.63 0.692 10.06
tract disorder
Adverse reaction 151 0.68 0.57–0.79 1.55 1.05–2.29 0.026 1.15 0.77–1.72 0.496 3.06
to drug
Liver disorder 128 0.57 0.48–0.68 1.07 0.72–1.58 0.750 0.89 0.60–1.35 0.593 11.40
Polyuria/ 110 0.49 0.41–0.59 0.84 0.54–1.29 0.425 1.34 0.84–2.14 0.222 10.31
polydipsia
relied on veterinary clinical records differs substantially health plans that prioritise common, severe or long dur-
to results based on other data resources. Analyses of pet ation disorders; an example of such breed health plans is
insurance records in Sweden have reported that skin and shown by the UK Kennel Club’s ‘Breed health and con-
gastrointestinal disorders feature highly in dogs [48, 49]. servation plan’ project [37]. Identification of differing
A questionnaire-based survey of UK owners of dogs reg- predisposition and protection profiles for common
istered with the KC reported lipoma (4.3 %), skin cyst disorders within and between breeds can promote
(3.1 %) and allergic skin disorder (2.7 %) as the most improved understanding of the wider impacts from
common disorders in dogs, possibly reflecting the priori- morphological and behavioural diversity selectively in-
tisation of the personal concerns of owners as well as troduced into modern dog breeds. Awareness of these
true prevalence [40]. Based on a telephone survey, the predispositions offers the prospect that co-ordinated
most common disorders in dogs in the US were reported health activities at a breed level may mitigate some of
as musculoskeletal, dental, and gastrointestinal tract or these negative welfare impacts [9, 53]. However, it is
hepatic disease [50]. Differences in the ranking of the worth noting that direct comparison of prevalence
most common disorders between these various data values between breeds risks falling into the trap of uni-
sources suggest that the information resource and data variable comparisons that do not account for confound-
extraction methods can have a substantial impact on the ing effects from other variables that may be associated
results. Comparison between results from series of with the disorder risk and that may differ between the
studies based on standardised core data collection and breeds (e.g. age, sex, neuter status) [54]. The nature of
analysis methods is therefore more likely to offer safer such confounding is explored later in this discussion.
inference between studies. This conclusion suggests the Strategies to improve canine health can be focused on
value of larger research programmes using cohort data dogs overall to reduce the welfare impact of common
collection nationally for more repeatable and compar- disorders such as obesity [55] or can be targeted to the
able study results [13]. specific needs of individual breeds [37]. The diversity of
There are currently concerted efforts to identify key canine breeds, each with its own breed club structure
breed health issues by comparing disorder prevalence that holds their own unique list of perceived priorities,
and risk between individual specific breeds and an ap- makes the breed-focused approach understandable. And,
propriate comparator group such as crossbreds, other indeed, this breed-focused approach is still a major plank
specific breeds [51] or all remaining dogs [52]. An appli- of current health initiatives in dogs [37]. However, this
cation of the results from the current study would be to breed-centric approach often tends to prioritise mitiga-
provide comparator disorder prevalence data on the tion efforts on disorders that are either predisposed or
wider dog population that could act as a baseline for the perceived to have high genetic components within a
generation of breed-specific predispositions and protec- breed above those that are common and modifiable, es-
tions. For comparative inference with the greatest reli- pecially within the lifetime of the affected animals [12,
ability, breed specific data should be extracted from the 36, 56–58]. Especially for disorders that have high sever-
same information resource using the same methods as ity and duration, greater welfare gains may result from
the comparator group [52]. The findings from such even modest reductions in the frequency of common
comparisons can be used to develop breed specific disorders compared with even large proportionalO’Neill et al. BMC Veterinary Research (2021) 17:69 Page 9 of 14 reductions in rare disorders [12, 36]. Although the animal species looks set to become an increasingly valu- current paper does not report on disorder risks within able activity over the coming years as countries becomes individual breeds, the current results could be useful as ever more influenced by activities and events outside a baseline on general health issues in dogs to reframe fu- their own borders [71, 72]. ture health reforms towards mitigation of more common Sample size estimation (power calculation) is a critical disorders. design component for any research project [73]. Failure Veterinary expertise in managing and preventing com- to consider this step could lead to inclusion of too few mon disorders offers many welfare benefits for dogs but animals with an under-powered study that misses signifi- it has always been challenging to prioritise allocation of cant differences that truly exist in the target population teaching time across the breadth of topics needed within or, conversely, inclusion of too many animals can lead to veterinary undergraduate curricula [59]. The findings of wastage of resources and to ethical issues [74]. Paradox- the current study enable visualisation of the majority ically, a major challenge to sample size estimation for component of a veterinarian’s daily workload and could many studies in dogs has been access to reliable assist in refining undergraduate veterinary teaching cur- population-based prevalence data. This may partially ex- ricula to better equip new graduates with the necessary plain the personal experience of the authors over many breadth of day-one skills [60–62]. Assuming that optimal years that a large proportion of otherwise good epi- allocation of undergraduate teaching times should take demiological research has been published without an ac- consideration of overall disorder prevalence, it is pos- companying a priori sample size estimation and sible that the teaching time allocated for common disor- therefore offered limited inference, especially when ders may currently be disproportionately short and that negative findings are reported. As an additional support student education on the clinical management of these to improve future epidemiological study design for dis- common disorders may rely excessively on the hidden order studies in dogs, the current study provides gener- curriculum or on experiences gained during extramural alisable results on disorder prevalence from a large studies [63–66]. There is a risk that this scatter-gun ap- cohort of dogs under UK primary care that can be used proach may generate new graduates with widely varying as the basis for sample size estimation (power calcula- beliefs about what constitures ‘best practice’, while also tion) [75]. potentially allowing some important clinical topics to fall Confounding describes the “mixing of effects” wherein through the educational net with inadequate coverage. effects from an exposure of interest (e.g. breed) on an Similarly, the current findings can provide a picture of outcome (e.g. a disorder) are conflated with the effects the typical clinical workload in primary-care practice for of another factor (e.g. age) that distorts the true relation- persons considering entering the veterinary profession ship between the exposure and the outcome [76, 77]. or even for veterinary undergraduates contemplating the Confounders may mask a true association so that it is directionality of their future careers [67]. missed or, conversely, generate an apparent association Access to reliable overviews of the main disorders between the exposure and outcome even when no real managed in primary care practice can assist logistical ex- association between them exists [78]. There are several ercises aimed at ensuring adequate resources for veterin- approaches to dealing with the confounding problem, in- ary care at a national level. For example, the World cluding randomisation, exclusion, matching and by using Small Animal Veterinary Association has recently pub- appropriate analysis [76]. Although randomisation re- lished a “List of Essential Medicines for Cats and Dogs” duces the necessity for prior consideration of potential [68]. The list aims to support veterinarians in providing confounding, the other three methods are reliant on a acceptable preventive care and treatment for the most priori causal consideration of both measurable and un- frequent and important diseases in dogs and cats by fa- measurable variables as potential confounders [78, 79]. cilitating medicines availability, drug quality, use and The current study placed special focus on exploring pharmacovigilance. Essential medicines were selected associations between age, sex and neuter status with based on consideration of disease prevalence along with common disorders in an effort to assist future research other factors including public/animal health relevance, to better understand and interpret these variables as po- clinical efficacy and safety, and comparative costs and tential confounders. The current results suggest import- cost-effectiveness. The value of such logistic exercises ant confounding effects for age, sex and neuter status in that require access to overall disease prevalence data has many common disorders of dogs. Among the 70 most been especially evident at a national level during the re- common precise-level disorders, male dogs had in- cent UK plans to leave the European Union [69] and at creased odds for traumatic injury, ear disorder, brain dis- an international level during the Covid19 pandemic [70]. order, musculoskeletal disorder, behaviour disorder, Generation of ongoing and more detailed datasets de- foreign body, upper respiratory tract disorder, and ad- scribing the overall disease burdens in companion verse reaction to drug. Conversely, bitches had higher
O’Neill et al. BMC Veterinary Research   (2021) 17:69                                                         Page 10 of 14

odds for urinary system disorder, incontinence and              disorders. These values allow assessment of the typical
claw/nail disorder. Some of these sex associations have         age profile for dogs affected with these disorders. It is
previously been identified whereas the current study pre-       noticeable that disorders diagnosed in dogs aged over 9
sents novel findings for others. It is worth noting that        years largely include degenerative and neoplastic disor-
these latter novel findings should be treated with caution      ders, such as osteoarthritis, heart murmur, skin mass
until supported or refuted by future confirmatory ana-          and lipoma, whilst disorders diagnosed in dogs under six
lyses. Disorders with previously reported associations          years largely include disorders associated with infection,
with sex include otitis externa, aggression and seizure         allergy, behaviour, trauma or dietary indiscretion such as
disorder in males [80–82] and urinary tract infection,          otitis externa, pyoderma, vomiting/diarrhoea, conjunc-
mammary mass, urinary incontinence and cruciate dis-            tivitis and claw injury. To date, there has been limited
ease in females [42, 83–86].                                    published evidence on the age profiles of dogs affected
  To add further complexity to the effects of sex on dis-       with common disorders. However, the current findings
order occurrence, the current study also identified asso-       are in line with a Korean report in which young dogs (<
ciations between neuter status and several disorders.           1 year) most commonly presented for preventive medi-
Neutered animals had increased odds for obesity, dental         cine, diarrhoea, vomiting and infectious diseases while
disorder, musculoskeletal disorder, incontinence and be-        older dogs (over 10 years) presented more commonly
haviour disorder. Conversely, entire animals had higher         with heart disease, kidney disease, Cushing’s disease, and
odds for female reproductive disorder, male reproductive        mammary tumours [39]. Similar to the confounding ef-
system disorder, underweight and parasite infestation.          fects described above, the results of the current study
Some of these associations have been previously re-             suggest that age should routinely be considered as a po-
ported, such as obesity, osteoarthritis and urinary incon-      tential confounder in risk factor analyses for common
tinence in neutered dogs [87–89]. However, it is often          disorders. For example, the median age in the UK varies
stated that ‘association does not imply causation’ and          widely between common dog breeds: French Bulldog 1.3
the dangers of making this leap from association to as-         years [28], Bulldog 2.3 years [25], Chihuahua 2.8 years
suming causality are especially valid when trying to in-        [27], Pug 3.0 years [33], Miniature Schnauzer 3.8 years
terpret the neuter status associations reported in the          [32], Rottweiler 4.5 years [34], German Shepherd Dog
current paper [90]. Neuter status is a time-varying vari-       4.7 years [29] and West Highland White Terrier 7.8
able, with all dogs starting life as entire. Neutering itself   years [35]. A direct comparison of disorder profiles or
is generally irreversible so that the proportion of neu-        prevalence between these breeds that did not account
tered dogs rises with age, assuming neutering does not          for age could spuriously suggest predispositions to typ-
shorten life. Associations between neuter status and dis-       ical disorders of young dogs in breeds such as the
order therefore become heavily confounded by age. For           French Bulldog and Bulldog and predispositions to dis-
example, although neutered dogs had a much higher               orders of older dogs in breeds such as German Shepherd
prevalence of periodontal disease compared to entire            Dog and West Highland White Terrier. The current
dogs (17.34 % versus 8.56 % respectively), the median age       study highlights the complexity that is introduced into
of dogs with periodontal disease was quite old at 7.54          disorder occurrence from their associations with age, sex
years. Since these periodontal disorder cases were, on          and neuter status and emphasises that careful consider-
average, older, they had more time to be neutered, which        ation should be given to confounding variables when
might account in part for this association. In addition,        planning, designing and interpreting disorder studies in
the current study was a cross sectional analysis with           dogs [91].
neuter status recorded at the date of final available rec-         Application of veterinary clinical data for epidemio-
ord and therefore it is unknown whether the disorder            logical analyses have some important limitations that
preceded or followed the neutering event for each indi-         have been previously reported [13, 27, 42, 43]. Add-
vidual dog. To fully explore the effects of neutering on        itional limitations for the current study included a ten-
disease risk, cohort study designs are needed whereby           dency of veterinarians to commonly record presenting
each dog is followed over time from puppyhood, taking           signs in lieu of formal biomedical diagnostic terms e.g.
note of the dates of neutering and disease occurrence           heart murmur rather than degenerative mitral valve dis-
[76]. However, to date, such cohort studies have been           ease, which prevents allocation of these true underlying
rare in veterinary studies on companion animals due to          diagnoses to the relevant specific disorders. Whilst this
their complexity as well as temporal and financial costs,       might underestimate the prevalence of specific disorders,
especially for disorders that may occur many years after        the current results do reflect current primary-care prac-
the neutering event [89].                                       tice more accurately. The process of disorder diagnosis
  The current study reported the median age of affected         and management in primary care practice is complex,
dogs at the end of 2016 for each of the common                  with multiple factors such as client finances and
O’Neill et al. BMC Veterinary Research   (2021) 17:69                                                        Page 11 of 14

expectations affecting the perceived need or importance       neuter status were commonly associated with disorder
for gaining full or precise diagnoses. These factors will     occurrence. The median age of affected dogs varied
therefore also impact the results reported in the current     widely and showed patterns of associations with differing
paper which should be interpreted as the prevalence of        pathophysiological processes. The findings on the preva-
disorders diagnosed as opposed to the true prevalence of      lence of the most common disorders can assist owners
the underlying disorders in this population of dogs. The      and veterinarians to prioritise preventive care and can
disorder prevalence values reported in the current study      enhance diagnosis of common disorders within dogs,
reflect the diagnosis levels in the current population of     and especially with an evidence-based differential focus
dogs. However, differing confounding effects from age,        within differing age and sex categories. In addition, the
sex, neuter and other profiles in alternative populations     sex, neuter and age-specific differences noted between
could result in different prevalence values in these other    common disorders can assist future studies to improve
populations that share the same inherent disorder pro-        their epidemiological study design to ensure higher val-
pensities. The current study shows results from an array      idity of their results. Disorder occurrence in dogs is con-
of association tests with the aim of detecting patterns of    cluded to be highly complex but the patterns identified
overall association. The provision of p-values may assist     in the current study suggest that there are underlying
the reader to interpret these statistical results but it      rules that can offer owners, veterinarians and welfare
should be noted that these p-values did not include ad-       scientists opportunities to better understand and control
justments to account for multiple testing such as the         canine health.
Bonferroni correction [92]. Consequently, this elevates
the possibility of Type I error (false positive findings)     Methods
such that individual test results should be interpreted       The data collection and analysis methods applied in the
with caution [93–95]. Associations between sex and neu-       current study are similar to those recently reported to
ter with the individual disorders from the current study      investigate disease risk in brachycephalic dogs [96]. The
should be treated as exploratory, and as useful hypoth-       current study included dogs receiving primary veterinary
esis generators, rather than as confirmatory. The current     care at practices sharing data with the VetCompass
study reports disorder prevalence (i.e. the proportion of     Programme in 2016. Dogs receiving veterinary care
dogs with the disorder of interest during 2016) rather        had either a) ≥ 1 electronic patient record (EPR)
than incidence (i.e. the proportion of dogs that devel-       (VeNom diagnosis term, free-text clinical note, treat-
oped the disorder of interest for the first time during       ment or bodyweight) recorded in 2016 or b) ≥ 1 EPR
2016). Prevalence studies are biased towards reporting        recorded during 2015 and 2017. VetCompass shares
disorders with longer duration (e.g. generally chronic        anonymised EPR data with UK primary-care veterin-
conditions such as osteoarthritis, obesity) compared with     ary practices for welfare research [97]. Information
disorders of short duration (e.g. generally acute condi-      available for analysis includes an animal and veterin-
tions such as conjunctivitis, otitis externa) [36]. The       ary clinic identifier, date of birth, species, breed, sex
study extracted the first listed presenting sign for disor-   and neuter, and also clinical information from free-
ders that were not ascribed a formal biomedical diagno-       text clinical notes, summary diagnosis terms [98] and
sis. This term was reported in the precise-level diagnosis    treatment along with dates.
results. Given that many underlying pathologies present         The study used a cohort design to estimate a one-year
with multiple common presenting signs (e.g. gastro-           period prevalence (2016) for the most commonly diag-
enteritis may present with vomiting, diarrhoea or             nosed disorders [99]. Power calculation estimated 18,440
malaise), this approach may have segregated these             dogs were needed to report prevalence for a disorder di-
underlying pathologies across several terms at the            agnosed in 2.0 % of dogs with 0.2 % margin of error to a
precise-diagnosis level. The current study aimed to over-     95 % confidence level from a population of 905,544 dogs
come this limitation by merging these terms into higher       [100]. Ethics approval was obtained from the Royal
levels of abstraction in the grouped-level diagnoses.         Veterinary College Ethics and Welfare Committee
                                                              (reference number SR2018-1652). All methods were per-
Conclusions                                                   formed in accordance with the relevant guidelines and
 This study of over 22,000 dogs under primary veterinary      regulations. Consent for use of the clinical data of the
care builds on previous work within VetCompass and            study dogs was obtained from the participating clinics
identifies the most commonly diagnosed disorders at a         and the animal owners.
precise-level as periodontal disease, otitis externa, obes-     The analysis included 22,333 dogs randomly sampled
ity, overgrown nail(s) and anal sac impaction. The most       from the sampling frame of dogs under veterinary care
common disorder groups were dental, skin disorder, en-        in 2016. Following random ordering, the EPRs relating
teropathy, musculoskeletal and ear disorder. Sex and          to 2016 were reviewed manually for all dogs to extract
O’Neill et al. BMC Veterinary Research (2021) 17:69 Page 12 of 14
the most definitive diagnosis terms recorded for all dis- Abbreviations
orders recorded during 2016 [101]. The manual review CI: Confidence interval; EPR: Electronic patient record; IQR: Interquartile
range; KC: The Kennel Club; OR: Odds ratio
process was conducted under the direct supervision of
the lead author (DON) by nine final-year veterinary Acknowledgements
undergraduate students. Disorder events in the cohort Thanks to Noel Kennedy (RVC) for VetCompass™ software and programming
data were followed over time to determine the most de- development. We are grateful to the following researchers who assisted with
data collection during this project: Alice Ashworth, Alison Toetz, Bethany
finitive diagnosis term. Prophylactic (e.g. vaccination) or Allen, Eleanor White, Elizabeth Ainsworth, Jasmine Broomhead, Joanne
elective (e.g. neutering) interventions were excluded. Humphrey, Penelope Crocker and Teresa Soares. We acknowledge the
Both pre-existing and incident disorder presentations Medivet Veterinary Partnership, Vets4Pets/Companion Care, Goddard
Veterinary Group, IVC Evidensia, Linnaeus Group, Beaumont Sainsbury Animal
were included. Disorders that were not recorded with a Hospital, Blue Cross, PDSA, Dogs Trust, Vets Now and the other UK practices
formal biomedical diagnostic term (e.g. ‘lameness’ or who collaborate in VetCompass™. We are grateful to The Kennel Club and
‘lameness and hopping’) were extracted using the first pre- The Kennel Club Charitable Trust and Agria Pet Insurance for supporting
VetCompass™.
senting sign term (e.g. ‘lameness’). All diagnosis terms from
the study were mapped to two levels of abstraction for diag- Authors’ contributions
nostic precision: precise-level precision and grouped-level DON and CP were responsible for the conception and design of the study
precision as previously described [101]. Briefly, precise-level and the acquisition and extraction of data. DON carried out the analysis.
DON, CP and HJ were mainly responsible for drafting the manuscript. DON,
precision terms described extracted terms to the maximal HJ, DC, DB and CP were involved in interpreting the results, revising the
diagnostic precision recorded within the EPR (e.g. periodon- manuscript and gave final approval of the version for publication. DON, HJ,
tal disease would remain as periodontal disease). Grouped- DC, DB and CP agree to be accountable for all aspects of the accuracy and
integrity of the work. All authors have read and approved the manuscript.
level precision terms mapped the extracted diagnosis terms
to a general level of diagnostic precision (e.g. periodontal Funding
disease would map to dental disorder). This study was supported at the RVC by an award from the Kennel Club
Data cleaning and checking for internal validity was Charitable Trust and Agria Pet Insurance. Neither the Kennel Club Charitable
Trust or Agria Pet Insurance had any input in the design of the study, the
carried out in Excel (Microsoft Office Excel 2013, collection, analysis and interpretation of data or in writing the manuscript.
Microsoft Corp.). Statistical analysis used Stata Version
13 (Stata Corporation). Age (years) was defined at De- Availability of data and materials
cember 31, 2016 (latest date for dogs to be classified for The dataset supporting the conclusions of this article is available in the RVC
Research Online repository http://researchonline.rvc.ac.uk/id/eprint/12714 .
each disorder). The one-year period prevalence values
described the percentage probability of diagnosis at least Ethics approval and consent to participate
once during 2016. Estimates for the 95 % confidence in- Ethics approval was granted by the Royal Veterinary College Ethics and
tervals (CI) were derived from standard errors based on Welfare Committee (reference number SR2018-1652). All methods were per-
formed in accordance with the relevant guidelines and regulations. Consent
approximation to the binomial distribution [102]. For for use of the clinical data of the study dogs was obtained from the partici-
each disorder, the median age (years) for cases was re- pating clinics and the animal owners.
ported. Period prevalence was reported overall and also
distinctly for males and females. For univariable analysis, Consent for publication
Not applicable.
categorical variables were compared using the chi-
squared test and continuous variables were compared Competing interests
using the Mann-Whitney U test. Correlation between The authors have no conflicts of interest to declare.
continuous variables was assessed using Spearman’s rank
Author details
correlation coefficient [102]. Statistical significance was 1
Pathobiology and Population Sciences, The Royal Veterinary College,
set at P < 0,0.05. Hawkshead Lane, North Mymms, AL9 7TA Hatfield, Herts, UK. 2The Kennel
Random effects multivariable binary logistic regression Club, Clarges Street, W1J 8AB Mayfair, UK. 3Clinical Sciences and Services, The
Royal Veterinary College, Hawkshead Lane, North Mymms, AL9 7TA Hatfield,
modelling was used to estimate the relative odds for Herts, UK.
males versus females and neutered dogs versus entire
dogs. A separate model was built for each disorder that Received: 22 June 2020 Accepted: 24 January 2021
included a standard bank of covariables to account for
confounding (sex, neuter, breed, bodyweight relative to References
breed/sex mean, age category and insurance). The clinic 1. PDSA. PAW PDSA animal wellbeing report 2019. 2019.
attended was included as a random effect [76]. The authors 2. Payne E, Bennett PC, McGreevy PD. Current perspectives on attachment
and bonding in the dog-human dyad. Psychol Res Behav Manag. 2015;8:
applied an ‘information theory’ approach to decide on 71–9.
which covariables to include in these standard models 3. Westgarth C, Christley RM, Jewell C, German AJ, Boddy LM, Christian HE.
[103]. Results for only sex and neuter status that were Dog owners are more likely to meet physical activity guidelines than
people without a dog: An investigation of the association between dog
of a priori interest were reported from each regression ownership and physical activity levels in a UK community. Sci Rep. 2019;
model. 9(1):5704.You can also read