Primary Networks Power Quality Analysis - NIA_WPD_028 WPD INNOVATION - Western Power ...
←
→
Page content transcription
If your browser does not render page correctly, please read the page content below

WPD INNOVATION

Primary Networks Power Quality Analysis
NIA_WPD_028

Six Monthly Progress Report
Reporting Period: Oct 2019 – Mar 2020

   WPD Innovation                              1
Version Control
Issue                                                 Date
0.1                                                   03/04/2020
0.2                                                   08/04/2020
0.3                                                   09/04/2020
1.0                                                   17/04/2020

Publication Control
Name                                                     Role
James King                                               Author
Steven Pinkerton-Clark                                   Reviewer
Jon Berry                                                Approver

Contact Details
Email
wpdinnovation@westernpower.co.uk

Postal
Innovation Team
Western Power Distribution
Pegasus Business Park
Herald Way
Castle Donington
Derbyshire
DE74 2TU

Disclaimer
Neither WPD, nor any person acting on its behalf, makes any warranty, express or implied, with respect
to the use of any information, method or process disclosed in this document or that such use may not
infringe the rights of any third party or assumes any liabilities with respect to the use of, or for damage
resulting in any way from the use of, any information, apparatus, method or process disclosed in the
document.

© Western Power Distribution 2020
Contains OS data © Crown copyright and database right 2020
No part of this publication may be reproduced, stored in a retrieval system or transmitted, in any form or
by any means electronic, mechanical, photocopying, recording or otherwise, without the written
permission of the Network Strategy and Innovation Manager, who can be contacted at the addresses
given above.

PNPQA Six Monthly Progress Report
Reporting Period: Oct 2019 – Mar 2020
                                                                                                       2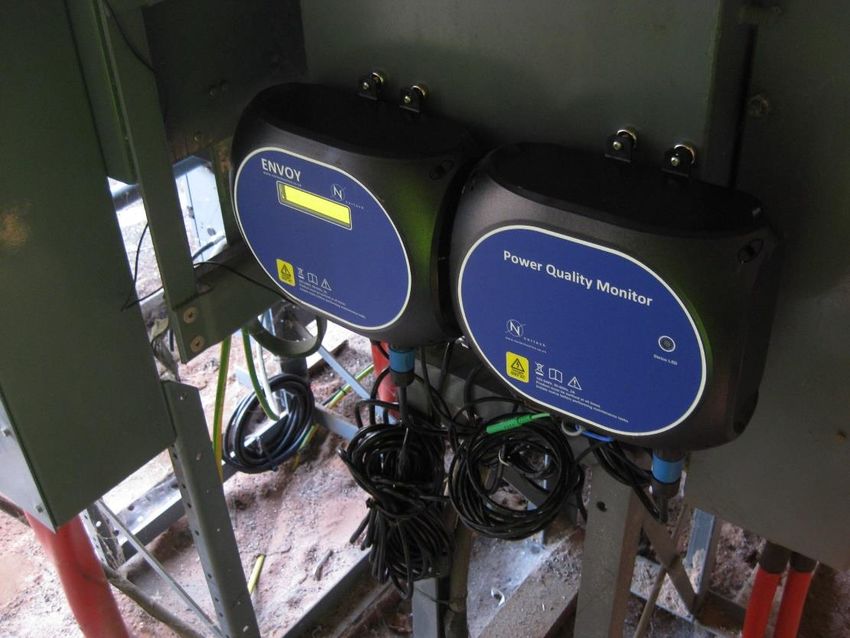
Contents
1    Executive Summary.................................................................................................. 4
2    Project Manager’s Report ......................................................................................... 8
3    Progress Against Budget ........................................................................................ 21
4    Progress Towards Success Criteria ....................................................................... 22
5    Learning Outcomes ................................................................................................ 23
6    Intellectual Property Rights ..................................................................................... 24
7    Risk Management................................................................................................... 25
8    Consistency with Project Registration .................................................................... 28
9    Accuracy Assurance Statement.............................................................................. 29
Glossary ....................................................................................................................... 30

WPD Innovation                                                                                                              3
1 Executive Summary
Primary Networks Power Quality Analysis (PNPQA) is funded through Ofgem’s Network Innovation
Allowance (NIA). PNPQA was registered in March 2018 and will be complete by February 2021.

PNPQA aims to reduce uncertainties around the power quality (PQ) within Primary Networks and
facilitate increased integration levels of low carbon technologies (LCTs). This will be achieved through
implementing a monitoring and analysis system for assessing the PQ and harmonic content of
waveforms in Primary Networks, verifying the accuracy of the Primary Network equipment used for PQ
monitoring, and using modelling to predict the future PQ impacts of increased integration of LCTs.

This report details progress of the project during the period October 2019 to March 2020.

1.1 Business Case
Over recent years there has been a sharp increase in the amount of LCTs connected to the electricity
network as part of the transition to a low carbon economy. Significantly more LCTs will need to connect
in order for the UK to reach its decarbonisation goals. Connections of LCT generators are set to continue
at a pace; for instance, since PNPQA was registered National Grid revised up their estimate of LCT
                                                           1
generation capacity by 2030 from 83 GW to 102 GW , which is nearly double the present capacity.
                                                                  2
Additionally, the UK Government’s Clean Growth Strategy targets electrification of transport and
heating, which indicates there will be a significant increase in LCT demand connections.

LCTs are often connected to the network using power electronic interfaces that have different
characteristics to the types of generators and demands that connected in the past. The impact of LCTs
on power quality (such as harmonics, flicker, voltage sags and swells, and voltage unbalance) within
primary networks is uncertain, particularly the future impacts of increased LCT integration.

In order to facilitate LCT connections, WPD is required to publish PQ information; however, current
business practices would make this labour- and cost- intensive to achieve fully. At present PQ monitoring
is limited in both space and time, typically with a single site being monitored in an area for a week per
year, or less. As a result, worst-case operating conditions may not be captured, and there is little visibility
of PQ away from LCT points of connection. Data retrieval requires site visits and analysis of PQ data is
not automated, making the process labour-intensive. In addition, there is uncertainty that the network
equipment used for PQ monitoring is providing an accurate picture of PQ within the networks. PNPQA
aims to overcome these shortcomings and provide widespread visibility of PQ within Primary Networks in
a much more labour- and cost-efficient way than simply scaling up the present approach.

1.2 Project Progress
This is the fourth progress report, covering progress from the start of October 2019 to the end of
March 2020.

Nortech Management Ltd. is contracted as a Project Partner, responsible for day-to-day project
management and delivery of the project, which is split in to four phases:
    1. Design – this first phase included testing the harmonic performance of Voltage Transformers
       (VTs), selection of trial areas and sites, specifying PQ monitor interfaces and PQ analysis
       software, and PQ monitor connection design;

1
    National Grid, Future Energy Scenarios (2019 and 2017): http://fes.nationalgrid.com/
2
    https://www.gov.uk/government/publications/clean-growth-strategy

PNPQA Six Monthly Progress Report
Reporting Period: Oct 2019 – Mar 2020
                                                                                                         4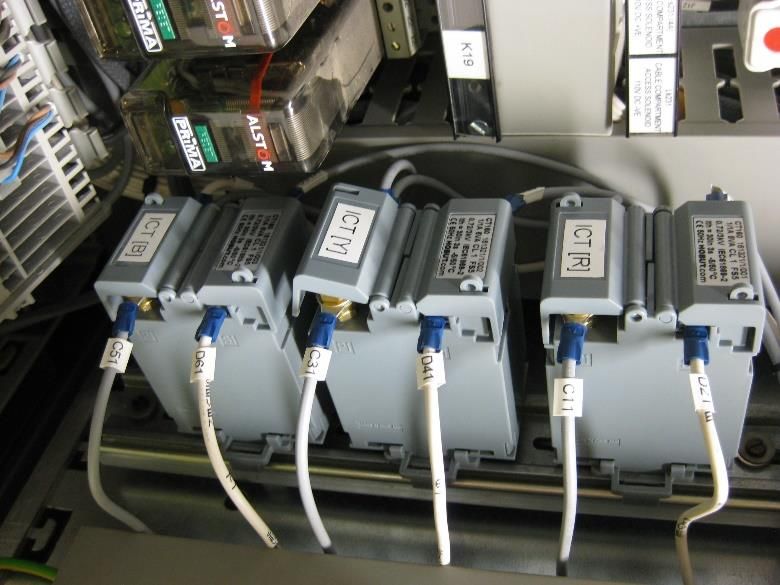
2. Build – this the most recent phase, which included developing interfaces to enable remote
communications from PQ monitors, purchasing and installing PQ monitors, and developing
software to automate the retrieval and analysis of PQ monitor data;
3. Trial – this is the current phase of the project and combines a wide scale trial of communicating
power quality monitors with software to automate the collection and analysis of PQ data, along
with modelling to understand the future impact of increased LCTs on Primary Networks;
4. Report – this is the final phase of the project, and includes dissemination events, drafting policies
for Business-as-Usual adoption, and producing the close down report.
During the previous reporting period (April 2019 to September 2019), communicating PQ monitor
installations took place within the project’s two trial areas: the 33 kV network fed from Meaford C Bulk
Supply Point (BSP), located between Stoke-on-Trent, Stafford, and Market Drayton, which is being used
as the base-case low LCT trial area; and the network fed by Ryeford BSP, centred on Stroud, which has
a high penetration of LCTs and is being used as the high LCT trial area. A total of 24 monitors were
installed and communicating at the end of the previous reporting period. In addition, four of the six main
features of the software to automate the retrieval and analysis of PQ data were implemented, and
objectives and methods had been agreed for the project’s PQ studies.
The project’s PQ monitor installations have now been completed, including sites with fixed PQ monitor
panels and several 11 kV sites. The total number of monitors installed and communicating is 46, and the
PQ monitor trial is now underway. The scope of analysing the monitored PQ data has been defined and
some initial analysis undertaken using the first month of data.
The PQ analysis automation software development has progressed. All functional specifications are
complete for the six main features, and a key element of the fifth main feature has been developed.
Power system and LCT models have been constructed for future-looking power system studies of the
potential PQ impacts of increased LCTs.
The University of Manchester has completed re-testing the harmonic performance of VTs using new
measurement equipment, following on from the tests during previous reporting periods. A second
laboratory has been engaged to perform follow-on testing to confirm and extend the results gained so far.
1.3 Project Delivery Structure
1.3.1 Project Review Group
The PNPQA Project Review Group meets on a bi-annual basis and has the role to:
Ensure the project is aligned with organisational strategy;
Ensure the project makes good use of assets;
Assist with resolving strategic level issues and risks;
Approve or reject changes to the project with a high impact on timelines and budget;
Assess project progress and report on project to senior management and higher authorities;
Provide advice and guidance on business issues facing the project;
Use influence and authority to assist the project in achieving its outcomes;
Review and approve final project deliverables; and
Perform reviews at agreed stage boundaries.
WPD Innovation 5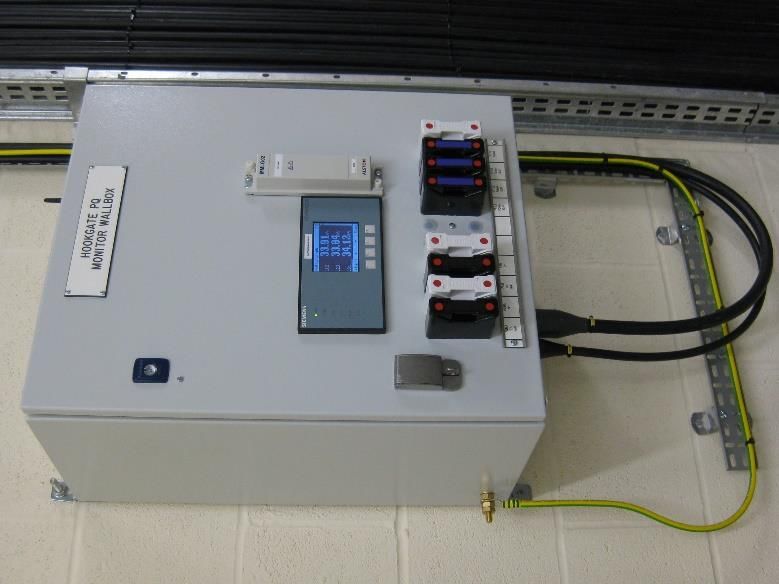
1.3.2 Project Resource
WPD: Steven Pinkerton-Clark (Project Manager for WPD).
Nortech Management Ltd: Project Partner, responsible for day-to-day project management and
delivery of the project:
o Samuel Jupe (Project Executive for Nortech);
o James King (Project Manager for Nortech);
o Sid Hoda (Software Development Manager); and
o Simon Hodgson (Technical Manager).
1.4 Procurement
Table 1-1 below details the current status of procurement for this project.
Table 1-1: Project procurement status
Provider Services/goods Area of project Anticipated
applicable to delivery dates
Nortech Day-to-day project management, PQ All March 2018 –
Management Ltd monitor interface hardware, software February 2021
development
The University of VT harmonic performance testing VT testing Delivered
Manchester June 2018 –
December 2019
National Physical Further VT harmonic performance testing VT testing April 2020 –
Laboratory September 2020
(undisclosed) 33 kV 1-phase VT VT testing Delivered
October 2018
(undisclosed) 33 kV 1-phase VT VT testing Delivered
October 2018
7com Ltd Demo PQ monitor PQ monitor trials Delivered
July 2018
IMH Technologies Demo PQ monitor PQ monitor trials Delivered
Ltd July 2018
Siemens plc Demo PQ monitor PQ monitor trials Delivered
October 2018
7com Ltd PQ monitors for trials PQ monitor trials Delivered
(a-eberle PQI-DA smart) February 2019
IMH Technologies PQ monitors for trials PQ monitor trials Delivered
Ltd (PSL PQube3) February 2019 &
Sept/Oct 2019
Siemens plc PQ monitors for trials PQ monitor trials Delivered
(Siemens SICAM Q200) February 2019
Accutest Ltd Current clamps for PQ monitors PQ monitor trials Delivered
September 2019
PNPQA Six Monthly Progress Report
Reporting Period: Oct 2019 – Mar 2020
6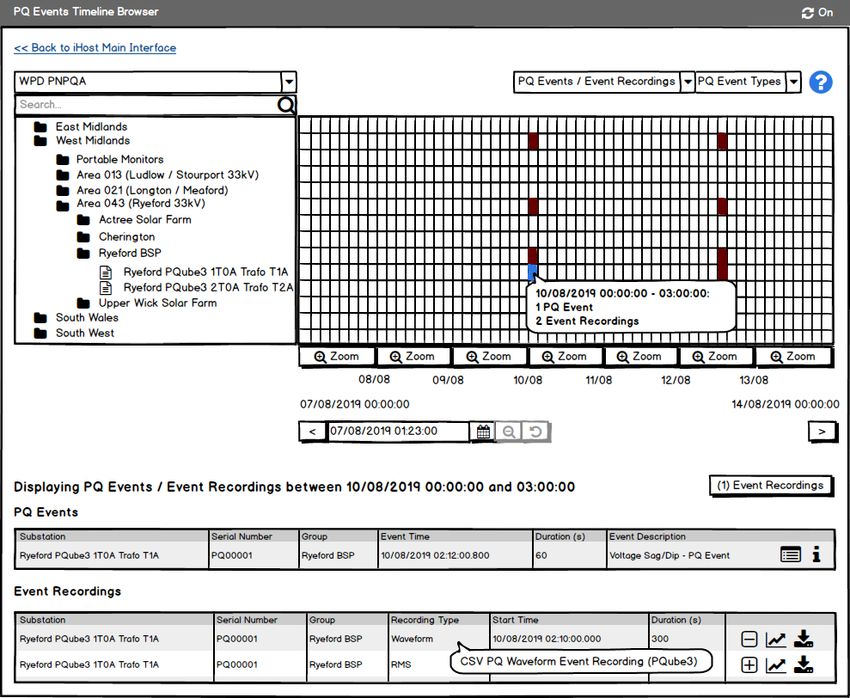
1.5 Project Risks
A proactive role in ensuring effective risk management for PNPQA is taken. This ensures that processes
have been put in place to review whether risks still exist, whether new risks have arisen, whether the
likelihood and impact of risks have changed, reporting of significant changes that will affect risk priorities
and deliver assurance of the effectiveness of control.

Contained within Section 7.1 of this report are the current top risks associated with successfully
delivering PNPQA as captured in the project’s Risk Register.

1.6 Project Learning and Dissemination
Project lessons learned and what worked well are captured throughout the project lifecycle. These are
captured through a series of on-going reviews with stakeholders and project team members, and will be
shared in lessons learned workshops at the end of the project. These are reported in Section 5 of this
report.

Project-specific dissemination events are planned in the later stages of the project once the PQ monitor
trial is nearly complete.

WPD Innovation                                                                                          7
2 Project Manager’s Report
2.1 Project Background
PNPQA is split in to four phases:
Design – this first phase of the project included testing the harmonic performance of VTs,
selection of trial areas and sites, specifying PQ monitor interfaces and PQ analysis software;
Build – this second phase includes developing interfaces to enable remote communications from
PQ monitors, purchasing and installing PQ monitors, developing software to automate the
retrieval and analysis of PQ monitor data, and building power system and LCT models for future-
looking PQ studies;
Trial – this is the current phase and combines a wide scale trial of communicating power quality
monitors with software to automate the collection and analysis of PQ data, along with modelling
and analysis to understand the future impact of increased LCTs on Primary Networks; follow-up
VT harmonic testing has also now been added to this phase; and
Report – this is the final phase of the project, and includes dissemination events, creation of
policies for business-as-usual adoption, and producing the close down report.
2.2 Project Progress
The project is currently in the third phase (Trial), with a single activity from the second phase (Build)
running concurrently. The following progress has been made:
Re-testing the harmonic performance of VTs has been completed at The University of
Manchester (UoM), using a new measurement system that should yield more accurate results;
A second laboratory has been engaged to perform follow-up VT testing, to validate and extend
the earlier testing done by the UoM;
Nortech has completed testing interfaces for their Envoy communications hub that enables
remote communication of PQ data from the three different PQ monitors being used in the trial;
All the power quality monitor installations planned for the project have been completed, with 46
monitors now installed;
The scope for analysing PQ monitor trials data has been defined and agreed;
Initial analysis of the first month of monitoring data has been performed;
Software to automate retrieval and analysis of PQ data has been progressed, with all six main
features specified and most development work for the fifth main feature being completed; and
Power system and LCT models have been constructed for future-looking power system studies
of the potential PQ impacts of increased LCTs.
More detail of the progress within each of these activity areas for phase 1 is provided in the subsections
within section 2.3 below, for phase 2 within section 2.4, for phase 3 within section 2.5, and for phase 4
within section 2.6. Next steps for within the next reporting period are described in section 2.7.
2.3 Phase 1: Design
All activities in Phase 1 were completed in previous reporting periods, with the exception of the VT
testing at The University of Manchester so only that activity is reported on below.
PNPQA Six Monthly Progress Report
Reporting Period: Oct 2019 – Mar 2020
82.3.1 VT Testing
For PQ monitoring, it may only be practical to use existing VTs to obtain voltage measurements;
however, the harmonic performance requirements of these VTs may not have been specified or
guaranteed, and little data is available on their performance. Therefore, to gain a better understanding of
VT performance and their influence on harmonic measurements, several VTs, representative of those
used by WPD, have been laboratory tested as part of PNPQA.
Progress within this reporting period
During the previous reporting period, The University of Manchester (UoM) had upgraded their Data
Acquisition (DAQ) system and the voltage probes on the VT secondary (output) side, to make an overall
measurement system better suited to complement the measurement transducers used for the testing.
The new DAQ system had been used to re-test the harmonic response of one VT (a 3-phase 11 kV cast
th
resin VT from a metering unit) up to the 100 harmonic order (5 kHz).
During the present reporting period, the new DAQ system has been used to re-test two other VTs, both
1-phase 33 kV units.
The magnitude frequency responses from the UoM laboratory testing for the first and second 1-phase
33 kV VTs are shown in Figure 2-1 and Figure 2-2 respectively The figures show the results obtained up
th th
to the 100 harmonic using the new DAQ system, and up to the 50 harmonic using the old DAQ
system. The y-axis scales are in terms of the normalised ratio, which quantifies the relationship between
the actual output of the VT and the expected output based on the nameplate ratio. A value of 1.0
indicates the magnitude of the output is as expected; however, values less than 1.0 – as shown in the
figure for higher frequencies – indicate the output is lower than expected.
The results for the 1-ph 33 kV VTs are consistent with the trends seen in previous results for the 3-phase
33 kV VT. As frequency increases, a reduction of normalised ratio is seen using both the new and old
DAQ system; however, the reduction is less pronounced when measured using the new DAQ system. At
th
the 50 harmonic (2.5 kHz), the normalised ratio is 53.3% of the expected value for VT #1 (compared
with 39.1% when measured using the old DAQ system), whilst for VT #2 the normalised ratio is 53.0% of
the expected value (compared with 28.2% when measured using the old DAQ system).
1.1
1 Old DAQ New DAQ
0.9
0.8
Normalised Ratio
0.7
0.6
0.5
0.4
0.3
0.2
0.1
0
0 500 1000 1500 2000 2500 3000 3500 4000 4500 5000
Frequency (Hz)
Figure 2-1: Magnitude frequency response for 1-ph 33 kV VT #1
WPD Innovation 91.1
1 Old DAQ New DAQ
0.9
0.8
Normalised Ratio
0.7
0.6
0.5
0.4
0.3
0.2
0.1
0
0 500 1000 1500 2000 2500 3000 3500 4000 4500 5000
Frequency (Hz)
Figure 2-2: Magnitude frequency response for 1-ph 33 kV VT #2
As noted in the previous report, the changes seen in the results using the new DAQ system compared
with the results using the old DAQ system are likely due to differences in the input circuitry and may also
be influenced by using different measurement transducers on the secondary side of the VT. However,
the most important finding remains the same: the tests indicate that VTs attenuate the magnitude of
th
higher-frequency harmonics, to the extent where the output at the 50 harmonic could be around 50% of
the value that would be expected from the nominal turns ratio of the VT. The implication of this is that
harmonic voltage measurements from VTs may be under-reporting the actual harmonics on the system.
The VT testing activity by the UoM during the Design phase is complete but follow-up testing at a
separate laboratory is planned – please refer to Section 2.5.4 for more details.
2.4 Phase 2: Build
The Build phase comprises several activities to implement what was developed in the Design phase in
preparation for the Trial phase. Most activities for the Build phase completed during the present reporting
period, except PQ analysis automation software development, which will continue in to the next period.
2.4.1 PQ Monitor Trial
A widescale trial of communicating PQ monitors is a major part of PNPQA and started in December
2019. This activity has been concerned primarily with purchasing and building hardware, and the
physical installation of PQ monitoring equipment in the trial sites.
Progress within this reporting period
Two areas are being used for the PQ monitor trials, which were selected through the trial area and site
selection activity during the Design phase. The two areas are differentiated by their level of LCT
penetration:
“High” LCT: the network fed from Ryeford BSP, centred around Stroud, Gloucestershire, and
extending to the Severn in the west; and
PNPQA Six Monthly Progress Report
Reporting Period: Oct 2019 – Mar 2020
10 “Low” LCT: the network fed from Meaford C BSP, which lies between Market Drayton, Stafford,
and Stoke-on-Trent.
There are two main installation types for the PQ monitors in the PNPQA project. The first type is the
“plug & play” installations where non-fixed monitors are temporarily connected to VT secondary circuits
using test leads and, optionally, currents are monitored via clip-on sensors around CT secondary circuit
wiring. The majority of the PQ monitor installations within the project are the “plug & play” type – totalling
39 monitors across 32 sites. There are six sites where a “plug & play” type installation was not possible
due to the switchgear used, and at these sites a fixed “PQ panel” has been installed, which consist of a
wallbox containing 1 or 2 monitors and fixed wiring to tap in to VT and CT secondary circuits.
During the present reporting period all six PQ panel installations were competed: 4 at sites within the
Ryeford trial area, and 2 at sites within the Meaford C trial area. Short outages of substation equipment
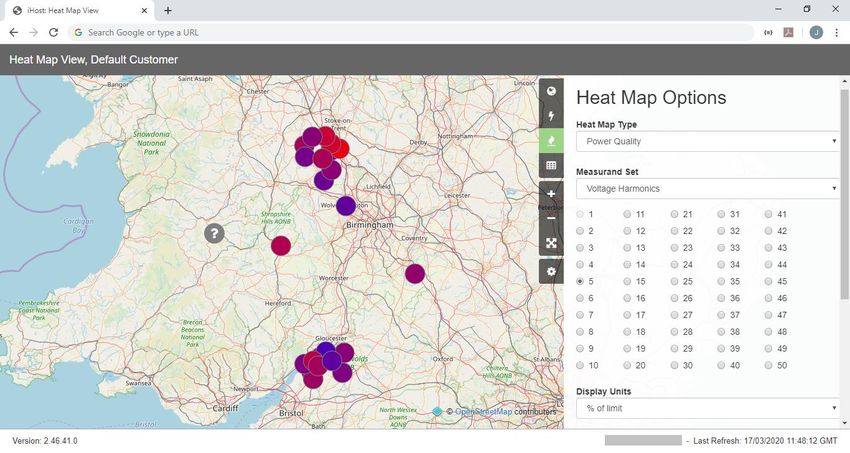
were necessary as existing VT and CT circuits had to be modified to interface with the panels. Figure 2-2
shows an example of an installed PQ panel (in particular, the panel at Hookgate primary in the
Meaford C trial area) and the interposing CTs that sit between existing CT secondary circuits and the CT
secondary circuits running to the PQ panels.
(a) PQ panel with PQ monitor (b) Interposing CTs
Figure 2-3: Example PQ panel and interposing CTs
In addition to the 6 PQ panels, an additional 15 “plug & play” monitors have been installed within the
present reporting period. The majority of these were at 11 kV distribution substations of interest within
the trial areas (9 in the Meaford C area, 3 in the Ryeford area) that add extra visibility and useful data on
LCTs to the project’s trials. Figure 2-3 shows an example of one of these 11 kV installations. Two other
11 kV installations were made outside the main trial areas to capture data from LCTs of interest; in
particular, a battery energy storage unit and a bank of EV rapid chargers. In addition, one 33 kV monitor
install was completed in the Ryeford area that had been delayed from the last reporting period due to
faulty equipment.
WPD Innovation 11Figure 2-4: Plug & play PQ monitor installation at an 11 kV distribution substation
Table 2-1 is a summary of the installation status of the PQ monitors for the project across the different
trial areas and sites, and voltage levels.
Table 2-1: Summary of PQ monitor installation status
Area / Site(s) Plug & Play Monitors PQ Panel Monitors
Installed / Total Installed / Total
Ryeford area (high LCT) 15 / 15 5/5
BSP & Primaries (33 kV)
Ryeford area (high LCT) 3/3 -
Distribution substations (11 kV)
Meaford C area (low LCT) 7/7 2/2
BSP & Primaries (33 kV)
Meaford C area (low LCT) 9/9 -
Distribution substations (11 kV)
Energy storage 3/3 -
Wind farm 1/1 -
EV rapid charger 1/1 -
SUB-TOTALS 39 / 39 7/7
This activity is now complete.
PNPQA Six Monthly Progress Report
Reporting Period: Oct 2019 – Mar 2020
122.4.2 PQ Monitor Integration
For the Build phase of the project, this activity was concerned with developing firmware for Nortech’s
Envoy communications hub allow the PQ monitors to be interfaced with and make the PQ monitor data
available remotely.
Progress within this reporting period
Nortech’s Envoy communications hub is being used to enable remote communications with the three
different PQ monitors being used within the project. New firmware for the Envoy has been developed for
interfacing with the PQ monitors to retrieve PQ data, store that locally, then upload the data to a
centralised monitoring platform (Nortech’s iHost) over the 4G communications network. Development
work was completed in the previous reporting period and during the present reporting period the final
testing of the interface firmware was successfully completed.
This activity is now complete.
2.4.3 PQ Analysis Automation Software
At this phase of the project, this activity is concerned with developing the software to automate analysis
of PQ, which also includes specifying and then developing individual features within the software.
Progress within this reporting period
The PQ analysis automation software is being implemented in to Nortech’s iHost monitoring and control
platform and includes six main features:
PQ Data Ingest: This is a background feature that takes data from different PQ monitors and
puts them in to a common format within the software’s time-series database, making the
data available for the other analysis features;
PQ Trends: This allows a user to plot a variety of PQ data from PQ monitors as time-line and
bar charts;
PQ Dashboard: This allows a user to get a quick overview of any recent PQ issues and the
health of the PQ monitoring system;
PQ Heat Maps: This allows a user to get a geographical and visual summary of PQ health
within the network;
PQ Events Viewer: This will allow a user to find PQ events that have been reported by PQ
monitors, such as interruptions, and view the data associated with those events including
voltage and current waveforms from COMTRADE files; and
PQ Assessment: A tool to perform ER G5/4 harmonic connection assessments using data
gathered from PQ monitors.
During previous reporting periods, detailed functional specifications were completed the first four
features, and the PQ Data Ingest (for PQube3 data) and PQ Trends features were developed and
deployed to the project’s iHost server.
The PQ Dashboard and PQ Heat Maps features were developed in the last reporting period and have
since been deployed to the project’s iHost server.
Figure 2-5 is an example of the PQ Dashboard. The top two rows summarise the state of monitored PQ
in the power system over different time ranges (previous day, previous 7 days, and previous 30 days),
and the bottom two rows summarise the state of the PQ monitoring system.
WPD Innovation 13Figure 2-5: Example of the PQ Dashboard
th
Figure 2-6 is example of a PQ Heat Map, showing variation of 5 harmonic voltages across the trial sites,
for a set time period (in this case, the previous 7 days). The colour of the marker for each site indicates
th th
the 95 percentile value of the 5 harmonic voltage at each site, from blue (low) to red (high).
Figure 2-6: Example PQ Heat Map, showing variation in 5th harmonic voltages across the trial sites
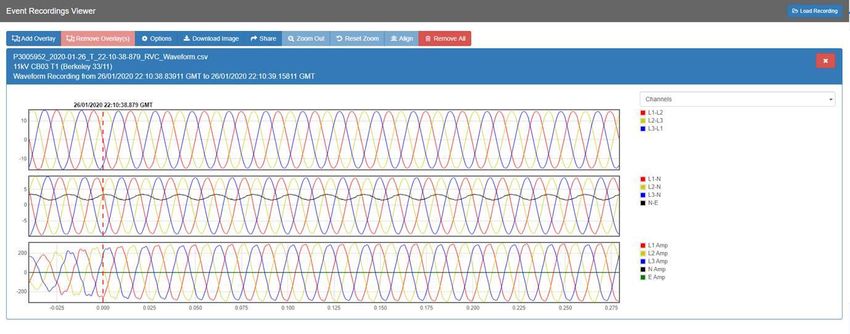
During the present reporting period the PQ Events Viewer has been progressed, with a functional
specification being drafted and finalised, and the events recording viewer element has been developed
and deployed. Figure 2-7 is an example of the events recording viewer in use, displaying voltage and
current waveform data. The events timeline browser element of the PQ Events Viewer will be completed
and deployed during the next reporting period. A mock-up of this feature is shown in Figure 2-8.
PNPQA Six Monthly Progress Report
Reporting Period: Oct 2019 – Mar 2020
14Figure 2-7: Events Recording Viewer displaying a voltage and current waveform data
Figure 2-8: Mock-up of the PQ Events Timeline Browser
The PQ Data Ingest feature has been updated to support ingesting data from the a-eberle PQI-DA smart
and Siemens SICAM Q200 power quality monitors, in addition to the existing support for the PSL
PQube3 monitor. The data ingest has been verified by comparing data from examples of each monitor,
which are installed to monitor the same circuit at Netherhills Primary.
WPD Innovation 15A functional specification has been prepared and agreed for the sixth main feature, the PQ Assessment
Tool. This feature will be developed during the next reporting period. Two additional reporting features
have been added into the scope of the software: 1) an EN 50160 report, and 2) a ER G5/4 background
data report. These reporting features will be specified and developed during the next reporting period.
This activity will continue into the next reporting period.
2.4.4 Modelling & Studies
At this phase of the project, this activity involved building power system models for the project’s PQ
studies, including models of different LCTs.
Progress within this reporting period
Project-specific power system models have been constructed in DIgSILENT PowerFactory to represent
the two main trial areas. The models are focused on the Primary networks (33 kV) but also include
upstream 132 kV and busbars representing the interface points with the transmission system and with
the 11 kV distribution system. The models were constructed by replicating network schematics within
PowerFactory, for example Figure 2-8 is an example of a substation schematic built in PowerFactory, in
this case the 33 kV and 11 kV busbars at Meaford C BSP. Line parameters were set in the model by
interrogating GIS (geographic information system) data for network assets, which yielded per-section
data including conductor type and section length.
Figure 2-9: A section of the power system model for the Meaford C trial area, showing Meaford C BSP 33 kV elements
Data for LCT harmonic current injections have been obtained from publicly available sources such as the
ENA type register and conference publications. These data form the basis of the LCT models to be used
in the studies during the Trial phase of the project.
This activity in the Build phase of the project is now complete.
PNPQA Six Monthly Progress Report
Reporting Period: Oct 2019 – Mar 2020
162.5 Phase 3: Trial
The Trial phase includes several activities that utilise the systems developed and deployed during the
Build phase, including analysis of PQ data from the PQ monitor trial, trials of the PQ analysis automation
software, power system studies, and follow-up VT testing.
2.5.1 PQ Monitor Trial Data Analysis
This activity is concerned with analysing the PQ data collected by the monitors installed during the Build
phase of the project.
Progress within this reporting period
During the present reporting period, a document has been prepared and agreed that defines the scope of
the PQ monitor trial data analysis within the project. The scope is framed by four questions, which are
derived from the project’s registration document:
1. What PQ impacts are LCTs having on networks?
2. Are week-long snapshots sufficient to capture representative PQ data?
3. Do multiple monitors in a network area deliver useful extra visibility?
4. How do the different PQ monitors compare?
The methods and tools for answering these questions have been set out in the scoping document and
will be developed and applied over the coming months.
In addition to setting the scope of the PQ data analysis for the remainder of the project, some initial
analysis of the trial data from the first months of PQ monitoring across all sites has been undertaken.
The subsequent figures summarise voltage harmonics across several 33 kV sites for the 6 week period
rd nd
23 December 2019 to 2 February 2020: Figure 2-10 is for 5 sites within the Meaford C (low LCT) area;
Figure 2-1 and Figure 2-12 are for sites fed from GT1A and GT1B, respectively, within the Ryeford (high
LCT) area; and Figure 2-23 compares data from 3 BSPs monitored as part of the project (note, Ryeford
th
BSP is normally run split at 33 kV). For each harmonic order at a site, the 95 percentile value of the L1-
L2 harmonic voltage data from the 6 week period is presented, with the y-axis scale being the
percentage of the ER G5/4 planning limit for each harmonic order.
The sites in the high LCT area fed by Ryeford GT1B (Figure 2-12) exhibit significant differences in the
th
voltage harmonic magnitudes. For instance, the aggregate of the 15 harmonic varies between 11.85%
st
(Coaley) and 45.60% (Solar #3 site), whilst the 21 is as high as 52.94% (Solar #1) and as low as
16.05% (at Ryeford BSP). This is an early indication that monitoring of remote nodes is needed in order
to give full visibility of PQ across a network area.
In the low LCT area fed by Meaford C (Figure 2-10), there is some variation in the harmonic aggregate
values across the sites; however, the variations are smaller in magnitude than for the high LCT area fed
th
by Ryeford GT1B. Some are the largest differences are for the 5 harmonic (from 57.73% at Market
th
Drayton up to 78.19% at Meaford C BSP) and the 15 (from 2.29% at Meaford C BSP up to 18.70% at
Hookgate). There is a similar limited amount of variation across the sites fed by Ryeford GT1A (Figure
2-1), which is separate at 33 kV to the GT1B side and does not feature any LCTs at 33 kV.
WPD Innovation 1780
Voltage Harmonics, 95th percentile,
70
60
50
% of limit
40
30
20
10
0
Meaford C Hill Chorlton Hookgate High Offley Market Drayton
Figure 2-10: Summary of voltage harmonics across the Meaford C trial area, 23 Dec 2019 – 2 Feb 2020
80
Voltage Harmonics, 95th percentile,
70
60
50
% of limit
40
30
20
10
0
Ryeford GT1A Cherington Dudbridge T3
Figure 2-11: Summary of voltage harmonics across the Ryeford (GT1A) trial area, 23 Dec 2019 – 2 Feb 2020
80
Voltage Harmonics, 95th percentile,
70
60
50
% of limit
40
30
20
10
0
Ryeford GT1B Netherhills Coaley Solar #1 Solar #2 Solar #3
Figure 2-12: Summary of voltage harmonics across the Ryeford (GT1B) trial area, 23 Dec 2019 – 2 Feb 2020
PNPQA Six Monthly Progress Report
Reporting Period: Oct 2019 – Mar 2020
1880
Voltage Harmonics, 95th percentile,
70
60
50
% of limit
40
30
20
10
0
Meaford C Ryeford GT1A Ryeford GT1B Ludlow
Figure 2-23: Summary of voltage harmonics across monitored 132/33 kV BSPs, 23 Dec 2019 – 2 Feb 2020
This activity will continue into the next reporting period and beyond.
2.5.2 PQ Analysis Automation Software
During the Trial phase of the project, this activity involves WPD staff trialling the PQ analysis automation
software features that have been developed during the Build phase.
Progress within this reporting period
A limited number of WPD staff have been trialling the software features as they have been released. A
PQ working group is in the early stages of being set up to trial the features more extensively, and this will
be running in the next reporting period.
2.5.3 Modelling & Studies
This activity follows on from the construction of power system and LCT models during the Build phase,
and uses the models and data collected from the project to perform future-looking power system studies
to help understand the future PQ impacts of LCTs.
Progress within this reporting period
The majority of the work for this activity will be in the next reporting period; however, some progress has
been made in the present reporting period in setting up and tweaking the models in readiness for studies.
2.5.4 Follow-up VT Testing at NPL
The VT testing during the Design phase found that VTs may significantly attenuate higher-order
harmonics between their inputs and outputs. Due to the potential significance of the findings, a separate
laboratory (the National Physical Laboratory, NPL) have been engaged to perform follow-up VT testing to
confirm the results. This follow-up testing also adds some additional useful features that enhance the
potential learning for the project, including testing the influence of other factors such as the burden on the
VT secondary circuits and the type of wiring used.
Progress within this reporting period
During the present reporting period, the scope of the testing to be performed by NPL has been agreed
and a contract put in place for delivery. A kick-off meeting with NPL is scheduled early in the next
reporting period, and the testing should take place throughout the next reporting period.
WPD Innovation 192.6 Phase 4: Report
The Report phase is the last phase of the project and includes developing policies for Business-as-Usual
(BaU) adoption of the project’s findings, dissemination of findings through events, and preparation of the
close-down report. Only progress on the policies have been made, so only that activity is reported on
below.
2.6.1 Policies for Business-as-Usual Adoption
This activity involves drafting WPD policies to allow the project’s methods and findings to be adopted in
BaU operations. Two policies are planned to be developed: 1) a Standard Technique on PQ monitor
installations, and 2) a Standard Technique on PQ data analysis.
Progress within this reporting period
A Standard Technique on PQ monitor installations has been drafted.
2.7 Next Steps
The activities described below are planned for the next reporting period, which is in phase 3 (Trial) of the
project. Phase 4 (Report) will run concurrently, whilst the software development activity of phase 2
(Build) will continue into the next reporting period.
The PQ monitor trial will continue throughout the next reporting period. Analysis tools will continue to be
developed and will be applied to the first sixth months of data to produce an interim data analysis report.
Development of the PQ analysis automation software will continue. The remaining two main features (the
events timeline browser element of the PQ Events Viewer and PQ Assessment Tool) will be developed
and deployed. The two reporting features that have been recently added to the software scope will be
specified and developed. All features will be trialled by WPD staff.
The modelling and studies aspect of PNPQA will continue, with studies using existing PQ data and data
from the PQ monitor trials taking place.
The follow-up VT testing at NPL will be kicked off, the testing equipment set up, and some, if not all, of
the testing should be completed.
PNPQA Six Monthly Progress Report
Reporting Period: Oct 2019 – Mar 2020
203 Progress Against Budget
Table 3-1 summarises the details of the progress that has been made with respect to the project budget.
Table 3-1: Project progress against budget
Spend Area Budget Expected Spend Actual Spend Variance to Variance to
(£k) to Date (£k) to Date (£k) Expected (£k) expected (%)
Nortech Delivery 635.4 540.6 540.6 0.0 0.0%
WPD Project 45.7 29.4 45.2 +15.8 +53.7%
Management
Technology and 553.8 492.7 394.7 -98.0 -19.9%
Installation
Contingency 123.6 0.0 0.0 0.0 0.0%
TOTAL 1358.5 1062.7 980.6 -82.1 -7.7%
WPD Project Management
This spend is higher than expected due to change of project managers early on in the project, extra
project management days have been required for the current project manager to be able to deliver this
project successfully.
Technology and Installation
This is underspent due to a delay in VT (Voltage Transformer) testing carried out by National Physical
Laboratory (NPL), the start of this testing has been delayed due to current UK wide restrictions on travel
and work as a result of the COVID-19 pandemic.
WPD Innovation 214 Progress Towards Success Criteria
Table 4-1 presents the progress the project has made towards the Success Criteria.
Table 4-1: Progress towards success criteria
Success Criteria Progress
Impact of LCTs on power quality and harmonics All PQ monitors for the widescale trial of
within primary networks better understood. communicating PQ monitors have been
installed. These monitors shall provide detailed
data on the power quality within primary
networks including the impact of LCTs.
Further VT testing to validate the accuracy of
equipment used for PQ measurements has
been completed at The University of
Manchester.
NPL have been engaged to perform follow-up
VT testing to validate and extend the findings
from the testing done by the UoM.
Power system and LCT models have been
constructed, which will be used for future-
looking power system studies to better
understand the potential future PQ impacts of
increasing LCT penetrations.
The scope for PQ monitor data analysis has
been defined and some analysis of the initial
month of data has been performed.
Power quality monitors installed at trial locations All 46 PQ monitors for the project’s trial have
and remote retrieval of data successfully been installed.
demonstrated. Interfaces for remote retrieval of data from the
three types of PQ monitors being used in the
trial have been completed, including final
testing.
Data has successfully been remotely retrieved
from all installed PQ monitors.
Tools for automating power quality data retrieval All six main features of the PQ analysis
and analysis demonstrated. automation software have been specified.
Four of the six main software features have
been developed and deployed to the project’s
data server.
A key aspect of the fifth main software feature
(an events recording viewer) has been
developed and deployed to the project’s data
server.
Policies created to implement project outputs in A Standard Technique on PQ monitoring
WPD’s business. installs has been drafted.
PNPQA Six Monthly Progress Report
Reporting Period: Oct 2019 – Mar 2020
225 Learning Outcomes
The learning across different areas of Phases 1 (Design), 2 (Build), and 3 (Trial) during the current
reporting period is summarised below:
VTs for harmonic monitoring
Following re-testing with improved equipment, the previous finding still holds that VTs pass through
signals at the harmonic frequencies typically measured (up to the 50th) but introduce attenuation in the
output magnitude at higher frequencies.
PQ monitor installations
Installation of a plug & play PQ monitor with voltage and current (clamp CT) inputs takes between 1-2
hours with 2-3 personnel, including sourcing power and post-install checks. There is no significant time
saving if current monitoring is skipped.
PQ impacts of LCTs
Initial analysis of the PQ data collected so far indicates there are significant variations in harmonic levels
across network areas featuring LCTs.
WPD Innovation 236 Intellectual Property Rights
New foreground IPR has been generated by PNPQA in the following areas:
Methodology and results of VT harmonic response testing;
Development and application of a methodology for trial area and site selection;
Implementation of interfaces for retrieving PQ data off PQ monitors;
Requirements and designs for PQ analysis automation software; and
Implementation of PQ analysis automation software.
PNPQA Six Monthly Progress Report
Reporting Period: Oct 2019 – Mar 2020
247 Risk Management
Our risk management objectives are to:
Ensure that risk management is clearly and consistently integrated into the project management
activities and evidenced through the project documentation;
Comply with WPD’s risk management processes and any governance requirements as specified
by Ofgem; and
Anticipate and respond to changing project requirements.
These objectives will be achieved by:
Defining the roles, responsibilities and reporting lines within the Project Delivery Team for risk
management;
Including risk management issues when writing reports and considering decisions;
Maintaining a risk register;
Communicating risks and ensuring suitable training and supervision is provided;
Preparing mitigation action plans;
Preparing contingency action plans; and
Monitoring and updating of risks and the risk controls.
7.1 Current Risks
The PNPQA risk register is a live document and is updated regularly. There are currently 20 live project
related risks. Mitigation action plans are identified when raising a risk and the appropriate steps then
taken to ensure risks do not become issues wherever possible. In Table 7-1, we give details of our top
five current risk by category. For each of these risks, a mitigation action plan has been identified and the
progress of these are tracked and reported.
Table 7-1: Summary of top five current risks (by rating)
Details of the Risk Mitigation Action Plan Progress
Risk Rating
Nortech resources Moderate 1. Follow government COVID-19 advice Nortech staff working from
are unavailable and Nortech policy (working from home, home and only visiting the
avoid physical meetings) office if essential (e.g. to do
2. Nortech to assign dedicated resources hardware testing or
3. Stand-in resources to be identified to configuration)
cover staff absences
4. Re-arrange programme around staff
availability
WPD resources Moderate 1. Follow government COVID-19 and WPD PM working from home
are unavailable WPD advice (e.g. working from home,
avoid physical meetings, etc.)
2. Close working relationship between
WPD and Nortech
3. Nortech empowered to contact
alternative WPD staff for assistance
Nortech does not Moderate Nortech appointed based on past record -
deliver required
performance
Delays in VT Minor 1. Plan in for delays, 2-3 months slack PO raised with NPL; NPL
testing available programme has 2-3 months
WPD Innovation 25Details of the Risk Mitigation Action Plan Progress
Risk Rating
2. Regular updates with NPL slack at end to stay within
overall project end date
Quality of VT Minor 1. Clearly define and agree testing NPL kick off meeting being
testing insufficent deliverables arranged
2. Witness testing
3. Regular calls to track progress /
issues
Table 7-2 provides a snapshot of the risk register, detailed graphically, to provide an on-going
understanding of the projects’ risks.
Table 7-2: Graphical view of Risk Register
Certain/Im
not/Likely minent
to be near (21-25)
0 0 0 0 0
Likelihood = Probability x Proximity
More likely
to occur
(16-20)
future
than
0 0 0 0 0
future (1- term (6- short term
occur/Far occur/Mid occuring/
chance of
(11-15)
Mid to
50/50
0 0 0 0 0
Less likely
to long
10)
to
0 1 2 0 0
unlikely to
in the
Very
5)
1 7 8 1 0
4. Substantial 5.
3.
1. Insignificant 2. Small Delay, key Inability to
Delay,
changes, re- Delay, small deliverables not deliver,
increased cost
planning may increased cost met, significant business
in excess of
be required but absorbable increase in case/objective
tolerance
time/cost not viable
20
Impact
Minor Moderate Major Severe
Legend 17 3 0 0 No of instances
Total 20 No of live risks
PNPQA Six Monthly Progress Report
Reporting Period: Oct 2019 – Mar 2020
26% of risks by category
Figure 7-1 provides an overview of the risks by category, minor, moderate, major and severe. This
information is used to understand the complete risk level of the project.
Major
0% Severe
0%
Moderate
15%
Minor
85%
Figure 7-1: Percentage of risks by category
WPD Innovation 278 Consistency with Project Registration
The scale, cost and timeframe of the project has remained consistent with the registration document, a
copy of which can be found here: https://www.westernpower.co.uk/downloads/2039
PNPQA Six Monthly Progress Report
Reporting Period: Oct 2019 – Mar 2020
289 Accuracy Assurance Statement All efforts have been made to ensure that the information contained within this report is accurate. WPD confirms that this report has been produced, reviewed and approved following our quality assurance process for external documents and reports. WPD Innovation 29
Glossary

 Term           Definition
 BaU            Business-as-Usual
 BSP            Bulk Supply Point
 CT             Current Transformer
 DAQ            Data Acquisition
 EV             Electric Vehicle
 GIS            Geographic Information Systems
 IPR            Intellectual Property Rights
 LCT            Low Carbon Technology
 NIA            Network Innovation Allowance
 NPL            National Physical Laboratory
 PNPQA          Primary Networks Power Quality Analysis
 VT             Voltage Transformer
 UoM            University of Manchester
 WPD            Western Power Distribution

PNPQA Six Monthly Progress Report
Reporting Period: Oct 2019 – Mar 2020
                                                          30
Western Power Distribution (East Midlands) plc, No2366923
Western Power Distribution (West Midlands) plc, No3600574
Western Power Distribution (South West) plc, No2366894
Western Power Distribution (South Wales) plc, No2366985
Registered in England and Wales
Registered Office: Avonbank, Feeder Road, Bristol BS2 0TB
wpdinnovation@westernpower.co.uk
www.westernpower.co.uk/innovation
@wpduk
WPD Innovation 31You can also read