PRIMED FOR PAIN: Amazon's Epidemic of Workplace Injuries - Strategic ...
←
→
Page content transcription
If your browser does not render page correctly, please read the page content below
PRIMED
  FOR PAIN:
  Amazon’s Epidemic of Workplace Injuries

May 2021
ABOUT THE SOC

The Strategic Organizing Center (SOC) is a dem-
ocratic coalition of four labor unions representing
more than 4 million workers. We are a labor union
innovation center dedicated to improving the lives of
working people, partnering with our affiliates to de-
velop effective strategies to support workers orga-
nizing for better lives for themselves and their fami-
lies. We stand against structural racism in all its forms
and fight not only for jobs, but good jobs: safe, equi-
table workplaces where all employees are respect-
ed, paid living wages and have real power at work.

thesoc.org
   @thesoc

1900 L Street, NW Suite 900
Washington, DC 20036
CONTENTS

INTRODUCTION                         1-2

OVERVIEW OF INJURY DATA              2-3

COMPARING AMAZON INJURY RATES        3-4
WITH OTHER EMPLOYERS

SAFETY AT AMAZON WAREHOUSES
GOT WORSE UNTIL COVID FORCED         4-5
A TEMPORARY CHANGE

INJURY RATES HIGHER AT
ROBOTIC FACILITIES –                 6-8
A WARNING SIGN FOR
THE FUTURE

INJURY RATES INCREASE AS
                                     8-11
PRODUCTS MOVE CLOSER
TO CUSTOMERS’ HOMES

AMAZON MANAGEMENT CHOOSES            11
GROWTH OVER SAFETY

APPENDIX A: AMAZON’S COVID-RELATED
                                     12-13
CHANGES TO WORKPLACE POLICIES

APPENDIX B: SOC SURVEY OF AMAZON
WORKERS — ANALYSIS OF RESPONSES      14
RELATED TO WORKPLACE INJURIES
Primed for Pain: Amazon’s Epidemic of Workplace Injuries                       01.

                              As the largest e-commerce retailer in the US, Amazon            standardized records of worker injuries maintained
                              took advantage of the massive shift to online shopping          at Amazon facilities. They found that Amazon’s inju-
                              during the COVID-19 pandemic and saw its US sales in-           ry rates were more than double the injury rate in the
                              crease 39 percent during 2020.1 The company’s size and          notoriously hazardous general warehousing industry.6
                              influence has expanded at an extraordinary pace. In the
                              ten years between 2010 and 2020, Amazon’s workforce
                              grew from 33,700 to nearly 1.3 million and its annual
                              net income increased from $1.1 billion to $21.3 billion.2

                              Amazon’s obsession with speed in every part of its
                              business has been a key element of its growth strate-
                              gy. Amazon’s founder, Jeff Bezos, has personally tout-
                              ed his focus on speed going back to the company’s
                              first job posting in 1994.3 Speed is at the core of the
                              company’s brand promise dating back to 2005 when
                              Amazon introduced its Prime program, with free, two-
                              day shipping guaranteed on most items. Most recent-             The Strategic Organizing Center (SOC) analyzed recent-
                              ly, in 2019, the company raced to introduce one-day             ly-released data reported by Amazon and its competi-
                              shipping and even same-day shipping on many items.4             tors to OSHA to compare the experiences of Amazon
                                                                                              workers to the experience of other workers in the ware-
                                                                                              housing and last mile delivery sectors during the most
                                                                                              recent period for which data are available – 2017 to 2020.

                                                                                              SOC’s analysis found that workers at Amazon ex-
                                                                                              perienced substantially higher rates of workplace
                                                                                              injuries than non-Amazon workers in the same in-
© iStockphoto.com | kupicoo

                                                                                              dustries during these four years. Amazon work-
                                                                                              ers continued to suffer these higher rates of inju-
                                                                                              ry despite years of protests against the company’s
                                                                                              high-pressure environment and production quotas.

                                “Fast and low cost delivery to the                            In 2020, in response to the COVID-19 pandemic, protests
                                                                                              from workers forced Amazon to finally make massive
                                customer is our obsession, and
                                                                                              operational changes to its warehouse operations that
                                we want to keep going faster and                              temporarily reduced production pressure on workers.
                                faster and faster”                                            [See Appendix A for a detailed discussion of Amazon’s
                                                                                              COVID-related changes to productivity rates and work-
                                – Philippe Hémard, Vice President for Amazon Logistics
                                                                                              place policies]. As a likely result of these COVID-re-
                                Europe5
                                                                                              lated changes, the injury rate in Amazon warehouses
                              But the company’s obsession with speed has come at              for 2020 was lower than in previous years, although it
                              a huge cost for Amazon’s workforce. For more than a             still remained substantially higher than the injury rates
                              decade, Amazon has made headlines for dangerous                 for other warehouse employers. Further, Amazon’s
                              health and safety conditions in its facilities.5 In 2019,       internal data demonstrate that the poor safety per-
                              multiple groups of researchers and journalists analyzed         formance is present across the entire Amazon system
Primed for Pain: Amazon’s Epidemic of Workplace Injuries                       02.

                                      and is not driven by a few outlier facilities. In addition,       New Jersey.9 Of the Amazon workers who responded,
                                      SOC’s analysis found that Amazon’s injury rates in fa-            4 in 10 (42%) reported experiencing pain or injury from
                                      cilities that use robots and automation are even higher           their job that caused them to miss work, and 8 in 10 of
                                      than in non-automated facilities, suggesting that the             the workers who reported being injured further report-
                                      way Amazon uses automation to maximize speed may                  ed that their pain or injury was related to production
                                      be contributing to its worsening injury rates overall.            pressure or speed. These results are consistent with
                                                                                                        the analysis of Amazon’s injury data. Further results
                                                                                                        from this survey are included later in this report. (For a
                                                                                                        full summary of survey results, see Appendix B, page 14).

                                                                                                        OVERVIEW OF INJURY DATA
© iStockphoto.com | Jaroslaw Kilian

                                                                                                        Our findings are based on data that Amazon and oth-
                                                                                                        er employers provided to OSHA annually from 2017 to
                                                                                                        2020 within the General Warehouse and Storage in-
                                                                                                        dustry (NAICS: 493110) and the last mile delivery indus-
                                                                                                        tries (NAICS 492110 & 492210).10 Amazon reported inju-
                                                                                                        ry and illness information for 191 facilities in 2017, 287
                                                                                                        facilities in 2018, 366 in 2019, and 658 in 2020. Those
                                      Lastly, an examination of the injury data at vari-
                                                                                                        reports covered an average annual workforce that
                                      ous points along a package’s trajectory from ware-
                                                                                                        grew from 208,764 workers in 2017 to 581,624 in 2020.11
                                      house to customer reveals that workers are injured
                                      far more frequently as packages get closer to ar-
                                      riving at customers’ homes. This suggests that the
                                      pressure associated with rapid delivery is especially
                                      dangerous to delivery workers. In 2020, Amazon did
                                      not implement changes to reduce pressures on its
                                      delivery workers during COVID as it did in its ware-
                                      houses, and the severity of injuries among deliv-
                                      ery workers actually increased during the pandemic.

                                      To supplement the analysis of Amazon’s injury data,
                                      the SOC conducted an online survey of Amazon work-
                                      ers related to health and safety issues at their Ama-
                                      zon workplaces between February 12 and February 18,
                                      2021.7 Of the 996 Amazon workers who responded to
                                      the survey, virtually all reported working in one of four
                                      segments of Amazon’s operations: fulfillment centers
                                                                                                                                                                     © iStockphoto.com | Fertnig

                                      (52%), last mile delivery (24%), delivery stations (9%),
                                      and sortation centers (8%).8 Workers reported working
                                      at facilities in forty-two different states, with the largest
                                      concentrations in Florida, California, Texas, Ohio and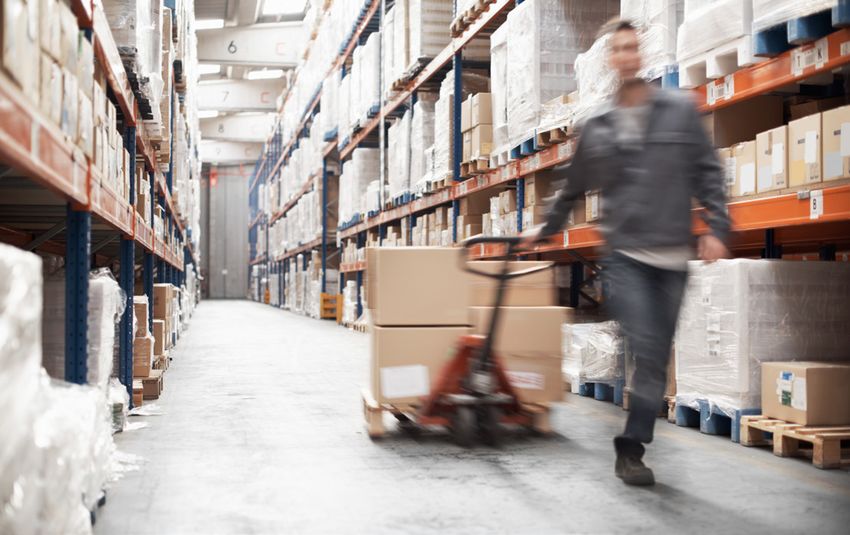
Primed for Pain: Amazon’s Epidemic of Workplace Injuries                                                    03.

All employers are legally required to submit annu-                   In 2020 alone, there were 27,178 total recordable inju-
al injury and illness reports to OSHA for any ware-                  ries – defined as injuries requiring medical treatment
house, delivery, grocery, or wholesale trade fa-                     beyond first aid, or restricting or eliminating a worker’s
cility with 20 or more employees annually, so                        ability to continue at the worker’s regular job – at Am-
these records should include every significant-                      azon facilities. The vast majority of these injuries were
ly-sized facility in Amazon’s US logistics network.                  serious: in 2020, 24,505, or 90 percent, of the injuries
                                                                     were categorized as either light duty or lost time injuries,
These reports show that each year, tens of thousands                 that is, injuries where workers were hurt so badly that
of Amazon workers are injured on the job. Table 1 dis-               they were unable to perform their regular job functions
plays the number and types of injuries that Amazon                   (light duty) or forced to miss work entirely (lost time).
reported to OSHA for the years 2017 through 2020.

                  TABLE 1: Injuries at Amazon Facilities by Injury Type, 2017-2020
  Year Filing    Annual       Full Time      Lost Time      Lost Time                          Light Duty      Light          Total          Total
     For         Average     Equivalents       Cases          Days                               Cases         Duty           Other          Cases
                Employees                                                                                      Days           Cases
     2017        208,764       159,233          8,037           500,964                          2,284        211,160         1,562          11,883

     2018        227,650       175,787          9,526             498,740                        2,521        242,669         1,675          13,722
     2019        643,789       242,475         12,053             633,562                        6,475       468,859          2,850          21,378
    2020         581,624       416,376         10,829             502,783                        13,676      890,484          2,673          27,178

                                                                     cent higher than the serious injury rate for all other
                                                                     employers in the warehousing industry in 2020 (3.3).
COMPARING AMAZON INJURY
RATES WITH OTHER EMPLOYERS                                           Amazon workers who were injured at work also took
                                                                     longer than other workers in the warehousing industry
In all four years for which data are available, Am-                  to recover. In 2020 Amazon workers who experienced
azon’s rate of injuries per 100 warehouse work-                      lost time injuries were forced off work for an average
ers is substantially higher than it is for non-Ama-
zon employers in the general warehouse industry.12                                  FIGURE 1: Injury Rates at Amazon and Other
                                                                                       Employers, by Injury Category, 2020
For example, even in 2020, (when Amazon’s injury                                     8
rates were likely lower due to major COVID-related
operational changes), there were 6.5 injuries per 100                                           6.5
                                                                                     6          0.6
Amazon warehouse workers as compared to 4.0 inju-
                                                            Injuries per 100 FTEs

ries per 100 at all other warehouses (See FIGURE 1).
                                                                                                3.3                 4.0
                                                                                     4
                                                                                                                    0.7
Workers at Amazon warehouses are not only injured                                                                                          2.8
more frequently than in non-Amazon warehouses,                                                                      1.6
                                                                                     2                                                     1.2
they are also injured more severely. In 2020, for ev-
                                                                                                2.6                                        0.7
ery 100 Amazon warehouse workers there were 5.9                                                                     1.7
                                                                                                                                           0.9
serious injuries requiring the worker to either miss                                 0
                                                                                         Amazon Warehouses   All Non-Amazon           All Employers
work entirely (lost time) or be placed on light or re-                                   (2020)              Warehouses (2020)        (BLS 2019)
stricted duty (light duty). This rate is nearly 80 per-                                          Lost Time       Light Duty      Other
Primed for Pain: Amazon’s Epidemic of Workplace Injuries                                       04.

                        of 46.3 days – more than a month and a half. That
                        is a week longer than the average recovery time for
                                                                                        To keep me safe at work, Amazon should:
                        workers injured in the general warehouse industry and
                        more than two weeks longer than the recovery time
                                                                                          “Understand that we are humans,
                        for the average worker who suffered a lost time injury.           not robots. . . Look at the people
                                                                                          who form your team as individuals
                        In addition to comparing Amazon’s injury rates with               with different strengths and
                        those of the general warehouse industry, SOC’s                    ambitions instead of an army of
                        analysis looked at Amazon’s injury rates in compar-
                        ison with Walmart, Amazon’s strongest competitor
                                                                                          faceless numbers to manipulate
                        in retail e-commerce.13 In all four years covered by              into improving your metrics.”
                        this report, SOC’s analysis found that Amazon ware-
                                                                                          – Fulfillment Center Worker, Ohio
                        houses were far more dangerous than Walmart’s.
                        In 2020, Amazon’s overall warehouse injury rate
                                                                                          “Do not demand so much
                        (6.5/100 FTEs) was over twice that of Walmart (3.0),
                        while Amazon’s severe injury rate (2.6) was more
                                                                                          production, since we are people,
                        than two-and-a-half times Walmart’s (1.0).14 Fig-                 not machines.”
                        ure 2, below, breaks down the overall injury rates
                                                                                          – Fulfillment Center Worker, Kentucky (translated from
                        at each company’s warehouses by injury type.
                                                                                          Spanish)
                                                                                                                     *Source: SOC Survey of Amazon Workers, February 2021
                        This analysis of Amazon’s injury data is support-
                        ed by Amazon workers’ response to the SOC’s on-
                        line survey. More than 4 in 10 (42%) respondents
                        reported having experienced pain or injury from
                        their job that caused them to miss work. More-
                        over, this suggests that the injury reports which
                        Amazon submits to OSHA may be undercounting
                        the number of injuries affecting Amazon workers.15

                                 FIGURE 2: Warehouse injury rates by type, Walmart and Amazon, 2017-2020
                                                                                                            9.0
                        9                                                                                                                                Other
                                                                                                             1.2                                         Light Duty
                                                                             7.9
                        8                        7.5                                                                                                     Lost Time
                                                                             1.0
                        7                        1.0                                                                                                     6.5
                                                                                                             2.7
                                                                             1.4                                                                         0.6
                        6
Injuries per 100 FTEs

                                                 1.4

                        5

                        4                                                                                                                                3.3
                                 3.5                         3.4
                                                                                             3.1                             3.0
                        3        0.5                         0.5             5.5
                                                 5.1                                        0.5              5.1             0.4
                        2
                                 2.1                          2.1                            1.9                              1.6
                                                                                                                                                         2.6
                        1

                        0        0.9                         0.8                             0.7                              1.0

                              WALMART          AMAZON     WALMART          AMAZON        WALMART           AMAZON       WALMART                     AMAZON
                                        2017                        2018                            2019                                   2020
Primed for Pain: Amazon’s Epidemic of Workplace Injuries                                            05.

                                                                         when workers fail to keep up with Amazon’s required
                                                                         production speed or “rate,” Amazon imposed severe
SAFETY AT                                                                consequences. More than 5 in 10 (52%) of Amazon
AMAZON WAREHOUSES GOT                                                    workers who responded to the online survey reported
WORSE UNTIL COVID FORCED A                                               that, since the beginning of the COVID-19 pandemic,
TEMPORARY CHANGE                                                         Amazon has terminated, disciplined or threatened to
                                                                         discipline workers for failing to keep up with the pace
                                                                         of work.20 Thus, workers’ accounts of extreme pro-
The data Amazon submitted to OSHA show that, even
                                                                         duction pressure in 2021 suggest that Amazon’s re-
as public awareness of safety issues at Amazon in-
                                                                         duced injury rates during COVID may not be sustained
creased, injury rates at Amazon warehouse facilities
                                                                         as the company returns to its previous practices.
got substantially worse between 2017 and 2019, until
Amazon made major temporary changes to warehouse
operations in response to the COVID-19 pandemic. In-                                       FIGURE 3: Injury Rates at Amazon
                                                                                          Warehouses by Injury Type 2017-2020
deed, it seems likely that these changes caused the
decreased injury rates at Amazon warehouses in 2020,                                                                       9.0
                                                                                      9
the only decrease observed throughout this 2017-2020                                                         7.9           1.2
                                                                                              7.5
period. As shown in Figure 3, from 2017 to 2019, the to-                                                     1.0
                                                                                              1.0                                        6.5
tal recordable injury rate climbed 21 percent from 7.5                                7
                                                                                                                           2.7
                                                                                                                                         0.6
                                                              Injuries per 100 FTEs

                                                                                                             1.4
injuries per 100 workers to 9.0 injuries per 100 work-                                        1.4

ers, and then decreased 28 percent to 6.5 injuries per
                                                                                      5                                                  3.3
100 workers in 2020. According to Amazon’s own le-
gal filings, in March 2020, in response to the COVID-19                                       5.1            5.5           5.1
                                                                                      3
pandemic, the company suspended warnings and
                                                                                                                                         2.6
disciplinary action against workers for under-perfor-
mance on productivity metrics, temporarily easing                                     0
                                                                                              2017          2018          2019           2020
some of the immense pressures Amazon places on
                                                                                                     Lost Time     Light Duty    Other
warehouse workers.16 These changes to work-speed
quotas and “time off task” are ones that workers and
outside health and safety experts had been been rec-
ommending for years in order to reduce the rates of
injury.17 Nevertheless, In October 2020, Amazon insti-
tuted a “revised” version of productivity rates in its
warehouses that it claimed takes into account time
for COVID-related safety protocols but that apparent-
ly reinstated many of the old pressures on workers.18

Indeed, workers who responded to the SOC survey
in February 2021, reported that many of the negative
consequences of Amazon’s focus on production speed
had returned. Of the Amazon workers who reported
                                                                                                                                                © iStockphoto.com | tomazl

serious pain or injuries in the online survey, 8 in 10 re-
ported that their pain or injury was related to produc-
tion pressure or speed.19 Respondents reported that
Primed for Pain: Amazon’s Epidemic of Workplace Injuries                                     06.

SOC’s analysis of the data that Amazon submitted to
OSHA also found a shift in the way that Amazon re-
sponded to workplace injuries. Between 2018 and
2020 the rate of injuries classified as light duty more
than doubled while the rate of lost time injuries fell.
This shift coincides with the rollout of Amazon’s “tem-
porary light duty” policy, which created positions for
workers who were hurt too badly to perform their
normal jobs. This program did not reduce the overall
number of serious injuries that workers experienced,
but offering more light duty work did cause more in-
jured workers to return to work rather than receiv-
ing workers compensation, which could reduce Am-
azon’s costs for workers compensation insurance.21

                                                                                                                                              © iStockphoto.com | RiverNorthPhotography
More than one third (37%) of injured Amazon work-
ers who responded to SOC’s online survey report-
ed that management pressured them to return to
work before they felt ready to do so.22 For most in-
jured workers in the SOC survey, the pain and inju-
ry continued after they returned to work at Amazon.
Almost three-quarters (74%) of injured workers re-
ported that after they returned to work at Amazon,
they continued to experience pain or further injury
                                                                                    INJURY RATES HIGHER AT
at work.23 Being pressured to continue working after                                ROBOTIC FACILITIES –
being injured, especially for workers who continue                                  A WARNING SIGN FOR
to experience pain while working, clearly puts work-                                THE FUTURE
ers at greater risk of repeated injury, and thus could
be contributing to Amazon’s high overall injury rates.                              Not only are injury rates increasing generally at Ama-
                                                                                    zon warehouses, but the company’s newest automa-
                                                                                    tion technologies may make working conditions even
To keep me safe at work, Amazon should:
                                                                                    more dangerous. Over the past two decades Amazon
                                                                                    has made significant investments in warehouse auto-
  “Think of their employees as                                                      mation, and in 2012 it made a major step in this direc-
  human beings that have mental                                                     tion by purchasing the robotics company Kiva for $775
  needs and physical needs.”                                                        million.24 Kiva was an attractive acquisition because
                                                                                    the company had developed a new robot that could
  – Fulfillment Center Worker, Oklahoma                                             move around a warehouse floor to automate the labo-
                                                                                    rious task of stowing new merchandise on shelves and
  “Actually care about our safety                                                   picking merchandise for assembling customer orders.
  over production rate and blue                                                     The production advantage is that the robots can move
  lights.”                                                                          quickly throughout the warehouse and, unlike humans,
                                                                                    they do not experience fatigue. The downside for work-
  – Fulfillment Center Worker, Wisconsin                                            ers is that they are not being assisted by equipment
                             *Source: SOC Survey of Amazon Workers, February 2021
Primed for Pain: Amazon’s Epidemic of Workplace Injuries                        07.

to make their jobs easier and more efficient. Instead,          “time off task” policies for the majority of the year. This
Amazon’s robots drive the workers’ production speed.            appears to have reduced the differential between the
                                                                total injury rate at robotic and non-robotic facilities.
Kiva robots are used in some, but not all of Amazon’s           This result is consistent with the theory that the work-
fulfillment centers. This analysis focuses on sortable          er surveillance and speed-up capabilities of the robots
warehouses, which ship small-and-medium-sized                   is a key driver of higher injury rates in these facilities.
items and are both the most common type of Amazon               It is remarkable that even in a year with substantial-
fulfillment center and the type of facility which most          ly adjusted production quotas, injury rates at robotic
frequently includes robotic technology.25 In each of            facilities still exceeded those of non-robotic facilities
the four years covered by this analysis, the serious in-        by 14 percent. As the company reinstated productivity
jury rate at sortable Amazon fulfillment centers with           quotas and “time off task” in late 2020, the company’s
robotic technology was higher than the serious injury           consistent drive for greater worker production raises
rate at the sortable Amazon fulfillment centers with-           an urgent question: Will Amazon’s managers at robotic
out robotic technology. In 2019, the last year of in-           facilities return to their prior production practices --
jury data available prior to the COVID-19 pandemic,             and the much higher worker injury rates that resulted?
Amazon’s sortable facilities with robotic technology
had a serious injury rate of 7.9 per 100 workers, more
than 54 percent higher than the serious injury rate at
non-robotic sortable facilities in the same year (5.1).26

The higher rates of injury in these robotic warehouses
are not a surprise given the ways in which the technol-
ogy interacts with workers. For example, this technol-
ogy also allows management to more closely monitor
workers to make sure that they are keeping up with
the robots. When a worker picks or stows an item, a
timer starts counting down, tracking the seconds un-
til the worker picks or stows the next item. If the lag
between tasks is too long, the time is logged as “time
off task.” Amazon’s computer systems track both the
number of items workers pick each shift and their time
off task, alerting managers to discipline, or even fire,
workers who are not able to keep up with the robots.27

The robotic system also forces workers to perform
the same movements over and over again. These re-
petitive motions can increase the risk of injury, which
becomes even more acute if workstations are not
designed to properly fit individual workers or if the
                                                                                                                              © iStockphoto.com | Vanit Janthra

movements require excessive twisting, bending and
awkward postures. The risk of injury related to these
motions dramatically increases with the pace of work.28
In 2020, as discussed earlier in this report, Amazon
suspended enforcement of its production rate and
Primed for Pain: Amazon’s Epidemic of Workplace Injuries 08.
FIGURE 4: Injury Rates at Amazon Robotic and Non-Robotic Facilities 2017-2020
10
8.9 8.9 Other
9 8.7
Light Duty
1.0 1.0 Lost Time
1.1
8
7 1.5
1.5
6.2 6.1
5.8 3.3
6
Injuries per 100 FTEs
5.5 1.0 0.6
0.7 5.3
5 0.5
0.5
1.4 1.0 1.5
4
2.5 3.8
3 6.1 6.4
2 4.6
4.0 3.7
3.7
1 2.3
1.7
0
Non-Robotic Robotic Non-Robotic Robotic Non-Robotic Robotic Non-Robotic Robotic
2017 2018 2019 2020
workers prepare packages that have already been
assembled and labeled for delivery and help drivers
INJURY RATES INCREASE AS load them into their vehicles. From there, delivery
PRODUCTS MOVE CLOSER TO drivers transport the packages directly to custom-
CUSTOMERS’ HOMES ers’ homes. The majority of delivery drivers work for
one of Amazon’s last mile delivery contractors, which
Amazon’s relentless drive to provide fast deliveries the company calls Delivery Service Partners (DSPs).
at low cost has created dangerous workplace con-
ditions and even higher injury rates in the final seg- Amazon advertises its DSP program as a low-cap-
ments of its delivery operations. SOC’s analysis of ital start-up opportunity, inviting aspiring entre-
OSHA injury data from Amazon delivery stations and preneurs to apply to launch a delivery company to
delivery contractors has found that these work- provide last mile delivery services exclusively for
ers experience injuries at a rate that is even high- Amazon.29 Amazon reports that there are more than
er than workers in Amazon’s fulfillment centers. 1,300 DSPs operating across the US, Canada, UK, Spain
and Germany, employing a total of 85,000 drivers.30
After an embarrassing 2013 holiday shopping season
when Amazon’s delivery network failed to meet delivery While DSP owners are the employer of record for de-
time promises at Christmas, Amazon began shifting away livery service drivers, Amazon maintains near-total
from its legacy carriers — USPS, UPS and FedEx — and control over every aspect of the delivery work. Each
investing heavily in building out its own last mile delivery shift, drivers report to an Amazon delivery station to
network. To facilitate this shift, Amazon built a network pick up packages for their route that have been set
of smaller warehouses that it calls delivery stations to out for them by Amazon employees.31 Most DSP driv-
augment its network of massive fulfillment centers. ers wear Amazon uniforms and drive Amazon-branded
vehicles. Throughout their shifts, drivers follow turn-
Delivery stations are generally smaller facilities locat- by-turn instructions on a device called a “Rabbit,”
ed near major population centers. At delivery stations, navigating from drop-off location to drop-off location.Primed for Pain: Amazon’s Epidemic of Workplace Injuries 09.
The company uses Mentor, an app installed on each Another driver described driving a van overloaded
Rabbit navigation device as well as many of the new- with packages, “packages are [jammed] so tightly into
er Amazon branded vehicles, to track drivers’ speed, your van that you can’t even see. You have packages
braking, swerving around corners, rapid acceleration in the front seat, and you have packages sliding from
and other behaviors.32 Based on those behaviors, the the back to the front, smacking you in the face.”36
Mentor app provides each worker with a FICO Safe
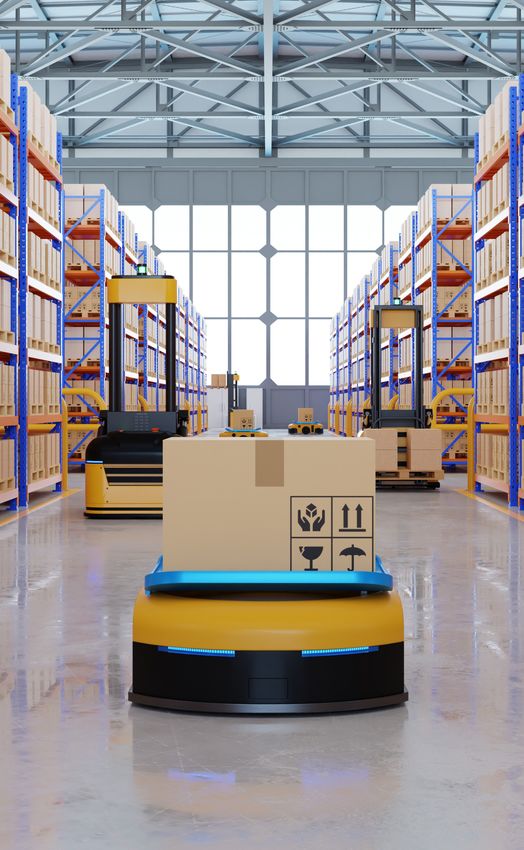
Driving Score, utilizing FICO’s proprietary predictive This fast-growing final segment of Amazon’s logis-
analytics platform.33 More recently, Amazon has an- tics chain has injury rates even higher than in Am-
nounced plans to install AI-powered cameras in DSP azon’s fulfillment centers. As shown in Figure 5, in
vehicles that capture the road, the driver and both 2020, the recordable injury rate for Amazon’s net-
sides of the vehicle.34 A privacy policy provided to work of fulfillment centers was already high, at 6.3 in-
drivers notes that footage from cameras is available to juries per 100 workers. The same year the injury rate
Amazon management as well as to DSP management. among the company’s network of delivery stations
was 51 percent higher at 9.5 injuries per 100 workers.
This last mile delivery network has grown rapidly in
a very short period of time. In 2017, Amazon report- FIGURE 5: Injury Rates Across Amazon’s
Logistics Chain by Injury Category, 2020
ed injury data to OSHA for 31 delivery stations with
14 13.3
a combined workforce of 11,147 employees. By 2019
the number of Amazon delivery stations had in- 12
3.7
creased to 137, and the average annual workforce 10 9.5
Injuries per 100 FTEs
employed at delivery stations had increased near- 0.9 1.8
8
ly twenty-fold to 199,447. By the end of 2020 there
6.3 2.9
were more than 300 delivery stations across the US. 6
0.6
4 3.6 7.9
Delivery drivers working in Amazon’s DSP net- 2.8
5.7
work report that they are under intense pressure 2 1.2
0.7 2.1
to rush to meet the company’s ambitious delivery 0 0.9
timetables. One driver told the publication Busi- All Employers Fulfillment Amazon Amazon Delivery
(BLS 2019) Centers Delivery Service Partners
ness Insider that he was forced to “park illegal- Station (DSPs)
ly, stuff a backpack full of packages, and then phys- Lost Time Light Duty Other
ically sprint to complete deliveries on time.”35
To keep me safe at work, Amazon should:
“Be more understanding about rate
of delivery of packages and not
reprimand you when you [are] not
delivering fast enough for them.”
© iStockphoto.com | Vanit Janthra
– DSP Driver, Indiana
“Care for the workers and drivers
without threats of punishment.”
– DSP Driver, Texas
*Source: SOC Survey of Amazon Workers, February 2021Primed for Pain: Amazon’s Epidemic of Workplace Injuries 10.
Because Amazon does not treat the drivers that deliv-
FIGURE 7: Last Mile Delivery Injury Rates by
er packages to customers’ homes as employees, the Category, UPS and Amazon DSP, 2019-2020
company does not report injury rates among drivers. 16
In addition, it appears that many of Amazon’s DSPs 7.9 14.0
14 13.3
have not complied with the requirement to sub-
12 3.2
mit injury data to OSHA, but in 2019 and 2020 at 3.6
Injuries per 100 FTEs
least 129 DSPs did submit injury records cover- 10
9.0
ing more than six thousand workers.37 Across all 8.3
4.5 1.8
8
DSPs reporting injury data in 2020, the record- 2.4
2.5
6
able injury rate was 13.3 injuries per 100 workers.
4 3.8
3.5
7.9
Amazon DSP drivers were injured at a similar rate 2
6.3
in 2019 and 2020 (13.9/100 FTEs vs. 13.3/100 FTEs) 2.4 2.7
0
but the nature of these injuries changed. As seen
UPS DSP UPS DSP
in Figure 6, the rate of severe injuries that re- 2019 2020
quired employees to take time off of work in or- Lost Time Light Duty Other
der to recover (lost time), increased by 25 percent.
In SOC’s online survey, nearly half (49%) of delivery
FIGURE 6: Amazon DSP injury rates by type, workers reported experiencing pain or injuries that
2019-2020 caused them to miss work, and nearly nine in ten
14.0 (89%) injured delivery workers reported that their in-
14 13.3
3.2
juries were related to production pressure or speed.38
12 3.6
10 To keep me safe at work, Amazon should:
Injuries per 100 FTEs
4.5 1.8
8
6
“Give us more time to load our
7.9
vans so that we can do it safely
4 6.3
and organize our vans in a way so
2
that packages don’t fall and hurt
0 us. Also give us more time to do
2019 2020
deliveries safely.”
Lost Time Light Duty Other
To better understand the high injury rates among Am- – DSP Driver, California
azon DSP drivers, the SOC analyzed data from one of
Amazon’s major last mile delivery competitors, UPS. “To understand that not everyone
In 2020, Amazon DSPs reported total injury rates that can keep pace with others. That
were nearly 50 percent higher than the rates of UPS’
last mile operations (13.3/100 FTEs vs. 9.0/100 FTEs).
sometimes a worker may need to
As illustrated in Figure 7, the lost time rate, which is the stop due to stress or injury and
most severe injury metric, constituted the bulk of the they should slow down.”
difference in performance. Amazon DSP workers expe-
rienced severe, lost time injuries at nearly three times
– Delivery Station Worker, Michigan
the UPS rate in 2020 (7.9/100 FTEs vs. 2.7/100 FTEs). *Source: SOC Survey of Amazon Workers, February 2021Primed for Pain: Amazon’s Epidemic of Workplace Injuries 11.
Not until 2020, amid a rising chorus of demands from
“When the weather is bad we workers and their supporters for radical changes, did
shouldn’t have to drive and Amazon begin to institute safety improvements that
deliver in 9 inches of snow.” made a dent in its warehouse injury rates. However,
even during this period of unprecedented global public
– DSP Driver, Illinois health emergency, Amazon failed to make any improve-
*Source: SOC Survey of Amazon Workers, February 2021
ments to safety for its last mile delivery drivers, whose
work pace, volume and real-time surveillance are en-
tirely under Amazon’s control. At the company’s earli-
est opportunity, in advance of the 2020 “peak” e-com-
merce shopping season, Amazon reinstated substantial
AMAZON MANAGEMENT
production pressure in its warehouses, suggesting
CHOOSES GROWTH OVER that the modest decrease in injury rates during the
SAFETY COVID period will prove to be a fleeting improvement.
Amazon’s own records show that, year after year, The online survey of Amazon workers confirms that
workers are injured in its operations at alarming rates workers’ experiences are consistent with the analysis
and that Amazon is not taking meaningful and consis- of Amazon’s injury data. Among workers responding to
tent steps to improve occupational health and safety. the survey, serious pain and injuries were widespread,
as well as injuries connected to production pressure
In 2017, Amazon reported that 7.5 out of every 100 and speed. Amazon workers’ survey responses also
workers in its logistics network suffered recordable suggest these injuries are connected to an atmosphere
injuries at work. That year 7,945 Amazon workers of fear in which workers see co-workers being fired,
were injured so badly that they were forced to miss disciplined and threatened if they do not keep up with
work while they recovered. The next year, Amazon Amazon’s speed quotas, and injured workers are pres-
management could have made a decision to imple- sured by their managers to return to work before they
ment safety procedures and protocols that would are ready. The fact that a vast majority of injured work-
make the company’s workplaces safer. Amazon man- ers who responded to the survey reported further pain
agement could have reduced the grueling rate and or injury after returning to work further suggests that
time off task quotas that they subject workers to. workers feel tremendous pressure to work through pain.
Management could have hired ergonomists to im-
plement effective improvements to the design of Amazon’s abysmal health and safety record is not
workstations. But it chose not to. And it chose not to an accident. Rather, it is the predictable outcome
make these improvements despite protests and cries of a company that prioritizes speed, growth and
for help from Amazon workers across the country. profits over the health and safety of its employees.
Unfortunately, this alarming rate of serious work-
Instead, Amazon chose to expand its empire, add- place injuries is likely to continue unless Amazon
ing 70 new facilities in 2018. That year, the company is forced by workers and others to take long-term
generated $10 billion in profits and CEO Jeff Bezos meaningful action to make its workplaces safer.
increased his net worth to $123 billion, becoming
the richest person in the world.39 Also in 2018, 9,448
Amazon workers were injured so badly that they
were forced to miss work while they recovered. By
2019, the number of severe injuries grew to 12,053.Primed for Pain: Amazon’s Epidemic of Workplace Injuries 12.
APPENDIX A: AMAZON’S COVID-RELATED CHANGES TO
WORKPLACE POLICIES
Changes regarding productivity rates
Since the start of the pandemic, Amazon has claimed that it implemented over 150 process changes to “pro-
mote social distancing, hygiene, and the safety of its associates.” In a lawsuit filed against the New York Attorney
General in February 2021, Amazon claimed to have made the following process changes that impacted produc-
tivity in its warehouses:
• “On March 18, Amazon ceased providing feedback to associates based on their productivity rates, as mea-
sured by the units per hour that the associate processed, and ceased taking any action against employees as
a result of extremely low productivity rates.”40
• “On April 29, Amazon indefinitely extended the cessation of productivity rate feedback to associates and
stopped taking any action against employees as a result of extremely low productivity rates.”41
• According to the company, its revised productivity goals allowed enough time for associates to wash their
hands, sanitize their stations, and maintain social distancing. Time spent by associates using the bathroom
and washing their hands would not count as time spent off an assigned task. The company reduced the
number of associates eligible for feedback based on productivity to the bottom three percent of perform-
ers.42
© iStockphoto.com | Lawrence GlassPrimed for Pain: Amazon’s Epidemic of Workplace Injuries 13.
Other temporary changes
In March 2020, Amazon temporarily expanded its paid and unpaid leave programs. In the lawsuit against the NY
AG, Amazon claimed to have made the following changes:
• “On March 6, 2020, Amazon temporarily modified its unpaid time off policy to provide associates with un-
limited unpaid time off to ease pandemic-related burdens such as school closures, short absences, or other
exigencies. While Amazon has now returned to its ordinary unpaid time off program, it continues to offer
many other forms of paid and unpaid leave for associates.”43 Amazon terminated this unlimited unpaid time
off policy on May 1, 2020.44
• “On March 11, Amazon also established a COVID-19 paid leave program through which associates placed into
quarantine or diagnosed with COVID-19 receive up to two weeks of additional paid time off so they can focus
on their health and not lost income. This COVID-related paid time off does not count against the associates’
paid and unpaid time off accruals.”45
• “Associates are paid for time spent on testing. Taking time to get tested does not count towards productivity,
and associates do not need to schedule testing during their breaks.”46 Amazon Reinstates Productivity Rate
in October 2020
• According to Amazon’s own legal filings, “Amazon suspended this part of its performance management pro-
cess in order to determine what, if any, changes were needed in light of COVID-19. In October 2020, Amazon
implemented revised measures that take into account the amount of time necessary to engage in the health
and safety practices that Amazon has put in place since the onset of the pandemic.”47 According to court
filing in a lawsuit filed by three employees at Amazon’s Staten Island facility, Amazon reinstated its productivi-
ty feedback policies regarding “rates” and “time off task” at least in this facility on October 7, 2020, in antic-
ipation of peak season.48 In response, an Amazon spokesperson said, “We have reinstated a portion of our
process where a fraction of employees, less than 5% on average, may receive coaching for improvement as a
result of extreme outliers in performance.”49Primed for Pain: Amazon’s Epidemic of Workplace Injuries 14.
APPENDIX B: SOC SURVEY OF AMAZON WORKERS — ANALYSIS OF
RESPONSES RELATED TO WORKPLACE INJURIES
From February 12 to February 18, 2021, the Strategic Organizing Center (SOC) conducted an online survey of Am-
azon workers related to health and safety issues at their Amazon workplaces.50 996 Amazon workers responded
to the survey.51 Virtually all of the workers who responded reported working in one of four segments of Amazon’s
operations: fulfillment centers (52%), last mile delivery (24%), delivery stations (9%), and sortation centers (8%).
Respondents reported working at facilities in forty-two different states, with the largest concentrations in Flori-
da, California, Texas, Ohio and New Jersey.
INJURIES ON THE JOB
Of the workers who had serious pain or injuries, 8 IN 10
MORE THAN 4 IN 10 (42%) reported that their pain or injury was related to production
of Amazon workers reported having experienced pain or
pressure or speed.
injury from their job that caused them to miss work.
Among delivery workers, NEARLY NINE OF TEN (89%)
Among delivery workers reported that their pain or injury was related to production pressure
or speed.
49% (delivery stations and drivers),
NEARLY HALF (49%) of workers
reported missing work for pain or injury.
MORE THAN A THIRD (37%) ALMOST THREE-QUARTERS MORE THAN HALF (52%)
(74%)
PRODUCTION PRESSURE
of injured workers reported that management of workers reported that, since the
pressured them to return to work before they beginning of the COVID-19 pandemic,
of injured workers reported that after they
felt ready to do so. Amazon has terminated, disciplined or
returned to work, they continued to
threatened to discipline workers in their
experience pain or further injury at work.
workplace for failing to keep up with the
pace of work, also known as the rate.
37% 74%
52%
*SOC Survey of Amazon Workers, February 12 to 18, 2021.Primed for Pain: Amazon’s Epidemic of Workplace Injuries 15.
1
Fareeha Ali, “US Ecommerce Grows 44.0% in 2020,” Digital Commerce 360, January 29, 2021, https://www.digitalcommerce360.com/article/us-ecommerce-sales/.
2
Amazon: Number of Employees 2006-2020 | AMZN,” Macrotrends, 2021, https://www.macrotrends.net/stocks/charts/AMZN/amazon/number-of-employees. “Amazon
Financial Statements 2005-2020,” Macrotrends, 2021, https://www.macrotrends.net/stocks/charts/AMZN/amazon/financial-statements
3
Isobel Asher Hamilton, “A Single Line from Jeff Bezos’ First Amazon Job Ad, Posted 27 Years Ago, Tells You Everything about His Obsession with Speed,” Business Insider,
February 3, 2021, https://www.businessinsider.com/jeff-bezos-first-amazon-job-ad-reveals-obsession-with-speed-2019-7.
4
Ben Fox Rubin, “Amazon Prime Two-Day Shipping Drops down to One Day,” CNET, April 26, 2021, https://www.cnet.com/news/amazon-prime-two-day-shipping-drops-
down-to-one-day/.
5
See, for instance; Spencer Soper, “Inside Amazon’s Warehouse,” The Morning Call, September 18, 2011, https://www.mcall.com/business/mc-xpm-2011-09-18-mc-allen-
town-amazon-complaints-20110917-story.html.
6
Awood Center et al., “Packaging Pain: Workplace Injuries in Amazon’s Empire,” Packaging Pain, 2019, https://www.amazonpackagingpain.org., Will Evans, “Behind the
Smiles,” Reveal (blog), November 25, 2019, https://www.revealnews.org/article/behind-the-smiles/.
7
SOC Survey of Amazon Workers, February 12-18 2021; the survey was conducted in Spanish and English and was advertised via Facebook and Google.
8
SOC Survey of Amazon Workers, February 12-18 2021. This total includes workers who currently work at Amazon and those who no longer work there, but who worked at
Amazon during the past six months. This total also includes workers who work for Amazon sub-contractors, including delivery service providers (DSPs).
9
SOC Survey of Amazon Workers, February 12-18 2021.
10
Unless otherwise noted, all data on hours worked, injury numbers, and injury types are based on records submitted by Amazon to OSHA through OSHA’s Injury Tracking Ap-
plication (“ITA”). They are available in full at https://www.osha.gov/Establishment-Specific-Injury-and-Illness-Data. Injury rates including Total Recordable Injury Rate (“TRIR”
or “Case Rate”) and Serious Injury Rate, were calculated as aggregates, not simple averages, of the various rates at individual locations. Injury counts and hours worked were
summed before calculating rates to ensure that rates were properly weighted and not skewed by smaller facilities. We use the term “injuries” to include both those cases re-
corded by Amazon as “injuries” and those recorded by Amazon as meeting OSHA’s definition of work-related “illnesses”. Work-related “Illnesses” account for less than three
percent of cases during the period covered by this analysis and could include heat-related conditions, skin diseases, respiratory conditions and poisoning, among others.]In
the 2016 data set, only three Amazon facilities reported injury information through the OSHA’s public Injury Tracking Application (ITA). Based on a database compiled by the
supply chain consulting firm MWPVL, there appear to have been as many as 176 Amazon facilities in operation that year (https://www.mwpvl.com/html/amazon_com.html).
Because Amazon failed to report for the vast majority of its facilities in 2016, we are unable to include that data in this analysis. Amazon’s reports for 2017-2019, however,
appear to be largely consistent with the list maintained by MWPVL.
11
SOC Analysis of Amazon injury data submitted to OSHA for 2017-2020. OSHA assumes that 2,000 employee-hours equals one full-time annual employee. There are some
inconsistencies in the NAICS codes reported for Amazon facilities in the ITA data. For the purposes of this analysis we included facilities that are categorized as Fulfillment
Centers, Sortation Centers, Delivery Stations, and Redistribution/Inbound Cross Docks. For purposes of consistency, all Amazon Pantry/Fresh and PrimeNow locations are
omitted from this analysis, as many of these are categorized under the NAICS for Supermarkets and Other Grocery Stores (445110) or are reported by Amazon as a separate
business (Prime Now LLC).
12
SOC Analysis of Amazon injury data submitted to OSHA for 2017-2020. Benchmark injury rates are typically calculated per 100 “Full-Time Employee” equivalents, based on
the total number of hours worked, which accounts for part-time schedules and turnover. For the purposes of this analysis, 2,000 hours worked is equivalent to one full-time
employee.
13
In 2020, Amazon remained the top e-commerce giant by market share (38.7%) while Walmart climbed up to second place (5.3%) and E-Bay took third place (4.7%). https://
www.emarketer.com/content/top-10-us-ecommerce-companies-2020
14
SOC Analysis of Amazon and Walmart warehouse injury data submitted to OSHA for 2017-2020.
15
SOC Survey of Amazon Workers, February 12-18 2021.
16
AMAZON.COM, INC. v. ATTORNEY GENERAL LETITIA JAMES, Case 1:21-cv-00767, Complaint, paragraphs 87-88.
17
Shapiro, Nina. “Under pressure, afraid to take bathroom breaks? Inside Amazon’s fast-paced warehouse world.” Seattle Times, July 2, 2018. Accessed via https://www.seattle-
times.com/business/amazon/under-pressure-afraid-to-take-bathroom-breaks-inside-amazons-fast-paced-warehouse-world/
18
AMAZON.COM, INC. v. ATTORNEY GENERAL LETITIA JAMES, Case 1:21-cv-00767, Complaint, paragraph 92, see also: https://www.cnbc.com/2020/10/14/amazon-resumes-
policy-that-dings-workers-for-taking-too-many-breaks.html
19
SOC Survey of Amazon Workers, February 12-18 2021.
20
SOC Survey of Amazon Workers, February 12-18 2021.
21
Will Evans, “How Amazon Hid Its Safety Crisis,” Reveal (blog), September 29, 2020, https://revealnews.org/article/how-amazon-hid-its-safety-crisis/
22
SOC Survey of Amazon Workers, February 12-18 2021.
23
SOC Survey of Amazon Workers, February 12-18 2021
24
Eugene Kim, “Amazon’s $775 Million Deal for Robotics Company Kiva Is Starting to Look Really Smart,” Business Insider, June 15, 2016, https://www.businessinsider.com/
kiva-robots-save-money-for-amazon-2016-6.
25
Non-sortable fulfillment centers and facilities that are not fulfillment centers are excluded from this analysis. Data on the presence of Kiva Robots at different fulfillment
centers comes from “How Amazon Hid Its Safety Crisis,” Reveal (blog), September 29, 2020, https://revealnews.org/article/how-amazon-hid-its-safety-crisis/. For sortable
facilities not included in the Reveal report, local news reports regarding the opening of each facility were consulted to note the presence or lack of Kiva robots. This analysis
includes Forty-six sortable fulfillment centers that are equipped with robotic technology, twenty sortable fulfillment centers that are not equipped with robotic technology,
and excludes 34 facilities for which the presence (or lack) of robotic technology could not be determined along with six robotic non-sortable facilities.
26
SOC Analysis of Amazon injury data submitted to OSHA for 2019.
27
Colin Lecher, “How Amazon Automatically Tracks and Fires Warehouse Workers for ‘Productivity,’” The Verge, April 25, 2019, https://www.theverge.
com/2019/4/25/18516004/amazon-warehouse-fulfillment-centers-productivity-firing-terminations.
28
Occupational Safety and Health Administration, “Ergonomics - Solutions to Control Hazards” (US Department of Labor, n.d.), https://www.osha.gov/SLTC/ergonomics/con-
trolhazards.html.
29
Amazon.com, Inc., “Amazon Delivery Service Provider Program Brochure,” https://d3a8hw3k243rpe.cloudfront.net/static-assets/Download_Brochure.pdf.
30
“Two Years of Empowering Entrepreneurs, with More to Come,” About Amazon, August 7, 2020, https://www.aboutamazon.com/news/transportation/two-years-of-empow-
ering-entrepreneurs-with-more-to-come.
31
Details on the business relationship between Amazon and various DSPs are made available in “Work Orders” obtained by BuzzFeed News and posted on DocumentCloud.
https://www.documentcloud.org/documents/6368697-Amazon-Work-Order-Tenet.html
32
Hayley Peterson, “Amazon Is Tracking Delivery Workers’ Every Move with an App That Assigns Them Scores Based on Their Driving,” Business Insider, December 18, 2019,
https://www.businessinsider.com/amazon-scores-delivery-workers-driving-skills-using-tracking-app-2019-12.
33
“FICO® Safe Driving Score” (Fair Isaac Corporation (FICO), 2017), https://www.fico.com/sites/default/files/2018-06/FICO_Safe_Driving_Score_PS_4459PS_EN.pdf.
34
Annie Palmer, “Amazon Is Using AI-Equipped Cameras in Delivery Vans and Some Drivers Are Concerned about Privacy,” CNBC, February 4, 2021, https://www.cnbc.
com/2021/02/03/amazon-using-ai-equipped-cameras-in-delivery-vans.html.
35
Hayley Peterson, “Missing Wages, Grueling Shifts, and Bottles of Urine: The Disturbing Accounts of Amazon Delivery Drivers May Reveal the True Human Cost of ‘free’ Ship-
ping,” Business Insider, September 11, 2018, https://www.businessinsider.com/amazon-delivery-drivers-reveal-claims-of-disturbing-work-conditions-2018-8.
36
Ibid.
37
It appears that the vast majority of Amazon DSPs did not submit reports through OSHA’s ITA system in 2019 or 2020, either because they were not required to report (em-
ployers with fewer than 20 employees are not required to report) or because they failed to comply with the reporting requirement.
38
SOC Survey of Amazon Workers, February 12-18 2021
39
Paige Leskin, “The Richest Person in the World, Amazon CEO Jeff Bezos, Added More Money to His Fortune in 2018 than Any Other Billionaire,” Business Insider, December
31, 2018, https://www.businessinsider.com/jeff-bezos-amazon-ceo-123-billion-net-worth-2018-12.Primed for Pain: Amazon’s Epidemic of Workplace Injuries 16.
40
AMAZON.COM, INC. v. ATTORNEY GENERAL LETITIA JAMES, Case 1:21-cv-00767, Complaint, paragraph 87.
41
AMAZON.COM, INC. v. ATTORNEY GENERAL LETITIA JAMES, Case 1:21-cv-00767, Complaint, paragraph 88.
42
AMAZON.COM, INC. v. ATTORNEY GENERAL LETITIA JAMES, Case 1:21-cv-00767, Complaint, paragraph 93.
43
AMAZON.COM, INC. v. ATTORNEY GENERAL LETITIA JAMES, Case 1:21-cv-00767, Complaint, paragraph 51.
44
https://www.businessinsider.com/amazon-set-to-end-unlimited-unpaid-time-off-policy-2020-4
45
AMAZON.COM, INC. v. ATTORNEY GENERAL LETITIA JAMES, Case 1:21-cv-00767, Complaint, paragraph 52.
46
AMAZON.COM, INC. v. ATTORNEY GENERAL LETITIA JAMES, Case 1:21-cv-00767, Complaint, paragraph 101.
47
AMAZON.COM, INC. v. ATTORNEY GENERAL LETITIA JAMES, Case 1:21-cv-00767, Complaint, paragraph 92.
48
https://www.cnbc.com/2020/10/14/amazon-resumes-policy-that-dings-workers-for-taking-too-many-breaks.html
49
https://www.cnbc.com/2020/10/14/amazon-resumes-policy-that-dings-workers-for-taking-too-many-breaks.html
50
The survey was conducted in Spanish and English and was advertised via Facebook and Google.
51
This total includes workers who currently work at Amazon and those who no longer work there, but who worked at Amazon during the past six months. This
total also includes workers who work for Amazon subcontractors, including delivery service providers (DSPs).You can also read