Pro-Pac Packaging Limited Half-year Results 2021 - Tim Welsh CEO & Managing Director Iona MacPherson - AFR
←
→
Page content transcription
If your browser does not render page correctly, please read the page content below

Pro-Pac Packaging Limited
Half-year Results 2021
Tim Welsh
CEO & Managing Director
Iona MacPherson
CFO

25 February 2021
1   Pro-Pac Packaging Limited: Half-Year Results

    Important Information
    This Presentation contains the summary information about the current activities of Pro-Pac Packaging              Any forecasts or other forward-looking statements contained in this Presentation are subject to known
    Limited and its controlled entities (Pro-Pac Packaging or the Group). It should be read in conjunction            and unknown risks and uncertainties and may involve significant elements of subjective judgement and
    with the Group’s other periodic and continuous disclosure announcements lodged with the Australian                assumptions as to future events which may or may not be correct. Such forward-looking statements are
    Securities Exchange (ASX), including the Interim Financial Report for the half-year ended 31 December             not guarantees of future performance and involve known and unknown risks, uncertainties and other
    2020 and associated Media Release released today, which are available at www.asx.com.au.                          factors, many of which are beyond the control of the Group and they may cause actual results to differ
    No member of Pro-Pac Packaging gives any warranties in relation to the statements or information                  materially from those expressed or implied in such statements. There can be no assurance that actual
    contained in this Presentation. The information contained in this Presentation is of a general nature             outcomes will not differ materially from these statements. You are cautioned not to place undue
    and has been prepared by the Group in good faith and with due care but no representation or warranty,             reliance on forward-looking statements. Except as required by law or regulation (including the ASX
    express or implied, is provided in relation to the accuracy or completeness of the information.                   Listing Rules), Pro-Pac Packaging undertakes no obligation to update these forward-looking statements.
    This Presentation is for information purposes only and is not a prospectus, product disclosure statement          Past performance information given in this Presentation is given for illustrative purposes only and
    or other disclosure or offering document under Australian or any other law. This Presentation does not            should not be relied upon as (and is not) an indication of future performance.
    constitute an offer, invitation or recommendation to subscribe for or purchase any security and neither           All dollar values are in Australian dollars (A$) unless otherwise stated.
    this Presentation nor anything contained in it shall form the basis of any contract or commitment.
    This Presentation is not a recommendation to acquire Pro-Pac Packaging shares. The information                    Non-IFRS Financial Information
    provided in this Presentation is not financial product advice and has been prepared without taking into           This presentation uses Non-IFRS financial information including capital expenditure, PBT, PBT margin,
    account any recipient’s investment objectives, financial circumstances or particular needs, and should            gearing, net debt, operating cash flow, operating cash flow conversion and working capital. This
    not be considered to be comprehensive or to comprise all the information which a recipient may                    information represents Non-IFRS measures used by the Group, the investment community and Pro-Pac
    require in order to make an investment decision regarding Pro-Pac Packaging’s shares.                             Packaging’s Australian peers with similar business portfolios. Pro-Pac Packaging discloses these
    Neither Pro-Pac Packaging nor any other person warrants or guarantees the future performance of Pro-              measures where it better reflects what the company considers to be the underlying performance of the
    Pac Packaging shares nor any return on any investment made in Pro-Pac Packaging shares. This                      Group.
    Presentation may contain certain forward-looking statements. The words ‘anticipate’, ‘believe’,                   Certain Non-IFRS financial information has not been subject to review by the Group's external auditor;
    ‘expect’, ‘project’, ‘forecast’, ‘estimate’, ‘likely’, ‘intend’, ‘should’, ‘could’, ‘may’, ‘target’, ‘plan’ and   however, reconciliations have been provided to balances contained in the interim financial report.
    other similar expressions are intended to identify forward-looking statements. Indications of, and
    guidance on, financial position and performance are also forward-looking statements.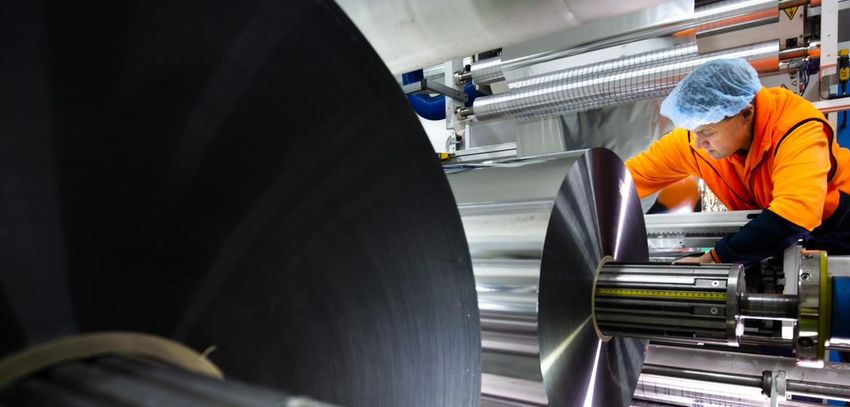
2   Pro-Pac Packaging Limited: Half-Year Results

    About Pro-Pac Packaging
    Pro-Pac Packaging is an innovative Flexibles, Industrial and Rigid packaging company with a diversified
    distribution and manufacturing network throughout Australia and New Zealand

                            Flexibles                                                Industrial                                              Rigid
      • Manufacturing and distribution of bespoke flexible       • Manufactures, sources and distributes high         • A solutions oriented bottle and closures business
        packaging solutions tailored for the industrial,           performance packaging and combines this with         that focusses on partnering with small to medium
        food and beverage, health and agriculture sectors          personalised service from its national footprint     sized customers seeking technical and business
        throughout Australia and New Zealand                     • Pro-Pac Packaging's key focus is to deliver          support with tailored, personalised product and
      • Products include stretch and shrink wrap,                  innovative solutions to the manufacturing and        supply chain services
        agricultural silage packaging, fresh produce bags,         industrial industries                              • National distribution network and comprehensive
        barrier and lidding films, industrial protective films   • A sourcing partner to global supermarkets            product range offers agile and superior service to
        and complementary machinery                                                                                     our customers
      • High value added laminated films and pouches for
        the FMCG market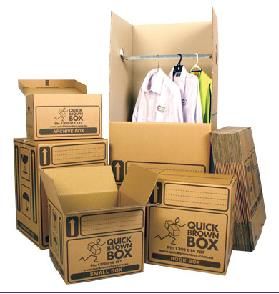
3   Pro-Pac Packaging Limited: Half-Year Results

    1H21 Results & Highlights
    1H21 has seen management drive considerable improvement in key operating & financial metrics, with investment to
    deliver further improvement and future growth

                             Zero Harm Journey                 Underlying Profit Growth               Statutory Profit Stable                              PBT* Performance (A$m)
                          TRIFR at 10.3 down 29%              PBT* of $11.7m up 33.4%                  Profit after tax $6.2m                              30% PBT* CAGR (pre-AASB 16)
                                   (Jun 20: 14.5)                                                                                         $15.0
                                                                        (1H20: $8.8m)                         (1H20: $6.4m)                                                                 $13.1
                             LTIFR at 7.4 (Jun-20: 6.9)                                                $2.8m (1H20: nil) spend on
                                                              Improved PBT margin* at 5.0% up                                                                                                       $11.7
                                                                                                                                                                                                     $1.4
                                                                                                     budgeted significant items incl.     $12.0
                         Group wide focus on health and         150 bps (1H20: 3.5%) driven by                                                                               $10.6
                           safety built on best practice       operational efficiencies, portfolio    Chester Hill facility transition,                           $9.3
                                                                                                                                                                                     $8.8
                                                                                                                                                                                     $1.8
      31 DECEMBER 2020

                            systems, experienced and           improvements and lower cost of            Kewdale fire costs, and           $9.0
                              committed leadership                                                            restructuring
                                                          ✓                  debt
                                                                                              ✓                                     ✓               $5.9
                                                                                                                                           $6.0

                                                                                                                                           $3.0
                          Transformation Projects                Balance Sheet Health                Continuation of Dividends
                                  on Track                        Low gearing* at 1.6x                  0.25 cents per share               $0.0
                         Group wide focus to streamline             before AASB 16                          (FY20: 0.40 cents)                      1H18          1H19           1H20           1H21
                         our operations and lower cost of               (Jun-20: 1.4x)                        Fully franked               Compound Annual Growth Rate in PBT* (pre-AASB 16) of 30% since 1H18
                          goods and services delivered
                                                                Net debt* of $54.2m (Jun-20:
                             ● Chester Hill transition         $46.1m) before AASB 16, with                                                          PBT* Pre-AASB 16
                             ● ERP implementation              $8.3m in capital expenditure &
                                                          ✓         $3.2m dividends paid
                                                                                              ✓                                     ✓                PBT* Post-AASB 16

     * Non-IFRS measure as defined in the Appendices (page 20), post-AASB 16
4      Pro-Pac Packaging Limited: Half-Year Results

          A Zero Harm Focus
                       TRIFR at 10.3 reduced by 29%                                                      FY20 COVID-19 Impacts
                                   Targeting Zero Harm                               •   Strict protocols continue to protect the safety, health & wellbeing of our
                      Driving a culture of safety through leadership,                    people in Australia, New Zealand and Malaysia, whilst ensuring
                           systems, education and compliance                             continuity of operations to support our customers in the supply of
                                                                                         essential products and services
                                                                                     •   Rigorous protocols of our COVID Safe Plan embedded within on-site
                                                                                         teams, including social distancing, hygiene, sanitation, separation of
                                                                                         teams working on site and restricted access to visiting third parties
                                                                                     •   Global shipping delays causing supply chain disruptions
 Management Systems                                             Health, Safety &
   Best Practice Health &                                      Environment Team      •   Demand variability for products in the food, beverage, grocery, personal
Safety Management system                                      Continued investment       care, health and household segments has eased in 1H21
         deployed                                               in HSE capability    •   Nimble, domestic manufacturing capability in Australia and New Zealand
                                                                                         continued to ensure security of supply to customers
       Our leadership is committed to building a disciplined safety                  •   Minimal bad debt write-offs, with continued improvement in the aging
       culture that protects our people and sustainably enhances                         of amounts due for collection
                        operational performance                                      •   No Government JobKeeper assistance or rent relief received

                LTIFR at 7.4 (Jun 20: 6.9)
       LTIFR increased to 7.4 (June 2020: 6.9) and remains a key focus for Pro-Pac
5   Pro-Pac Packaging Limited: Half-Year Results

    Financial Results Summary
    Continual improvement in profitability delivered (before significant items), planned increase in working capital

                                         Post AASB-16                  Pre AASB-16            1H21 Review (post AASB 16)
    A$ million                      1H21       1H20     Change     1H21     1H20     Change   •   Revenue of $234.4m (down 6.6% on pcp) due to:
    Statutory results:                                                                            – targeted and successful focus on shifting business mix towards higher
    Revenue                        234.4      251.0      (16.6)    234.4    251.0    (16.6)         margin products, partially offset by new business and combined with rise
    Profit after tax                 6.2        6.4       (0.2)      7.2      7.6     (0.4)         and fall resin input price reductions and the divestment and exit of non-
                                                                                                    core businesses
    Operating results:
    PBT*                            11.7         8.8         2.9   13.1      10.6       2.6   •   Profit after tax is $6.2m (down $0.2m on pcp) due to:
    PBT Margin*                     5.0%       3.5%        1.5%    5.6%      4.2%     1.4%        – $2.0m of significant items after tax (1H20: nil) for budgeted costs
                                                                                                    predominantly relating to the Chester Hill project, additional operating
                                                                                                    costs associated with the Kewdale fire and restructuring costs
                                         Post AASB-16                  Pre AASB-16            •   Increased PBT* to $11.7m (up $2.9m on pcp) due to:
    A$ million                   DEC-20      JUN-20     Change DEC-20      JUN-20    Change       – PBT margin* expansion of 150 bps from improved business mix, the
    Balance sheet:                                                                                  completion of several operational initiatives to streamline costs, increased
    Working capital*                91.6       82.3         9.3     91.6     82.3       9.3         corporate costs and a decrease in finance costs
    Net debt*                      110.7      103.8         6.9     54.2     46.1       8.1   •   Net debt* of $54.2m before AASB 16 (up $8.1m on pcp) following capital
    Gearing*                        2.4x       2.2x        0.2x     1.6x     1.4x      0.2x
                                                                                                  investment of $8.3m, payment of a final dividend of $3.2m and an increase in
                                                                                                  working capital of $9.3m
                                                                                              •   Interim dividend declared of 0.25 cents per share fully franked
    * Non-IFRS measure as defined in the Appendices (page 20)
6   Pro-Pac Packaging Limited: Half-Year Results

    Disciplined Cash Flow Management
    A disciplined focus on cash flow management continues

                                                                                          Cash Management
    1H21 Review (post AASB 16)
                                                                                          A$ millions                                    1H21               1H20          Change
    Embedded cash management discipline delivered:
                                                                                          Operating cash flow*                               16.5            17.3           (0.8)
    •   65.1% operating cash flow conversion* (1H20: 69.3%) influenced by the
        increases in working capital* required to proactively manage the COVID-19         Capital expenditure*                               (8.3)           (0.7)          (7.6)
        supply chain challenges and the implementation of major projects                  Free cash flow*                                     8.2            16.6           (8.4)
    •   Disciplined focus on planned capital expenditure* relating to plant and           Operating cash flow conversion*               65.1%               69.3% (420) Bps
        equipment ($6.3m) and ERP software ($2.0m)
    •   Seasonal cash cycle driven by the Agriculture sector in Australia and New                        Operating Cash Flow Conversion* (%)
        Zealand positively skews operating cash flow conversion* to second half            100.0

                                                                                                                                      69.3
    Key Priorities                                                                                                      56.0
                                                                                                                                                                   65.1
                                                                                                                                                     52.2
    •   Continuous improvements in cash flow management and disciplines                     50.0           38.0

    •   Disciplined capital investment focused on superior ROI projects, supported by
        well managed delivery and governance oversight
                                                                                              -    56%
                                                                                    37%                   1H19                 1H20                         1H21

                                                                                                         Pre-AASB 16

                                                                                                         Post-AASB 16
    * Non-IFRS measure as defined in the Appendices (page 20), post-AASB 16
7 Pro-Pac Packaging Limited: Half-Year Results
Improving the Balance Sheet
Our capital management priorities are to maintain a strong balance sheet, and provide financial flexibility for growth
and shareholder returns
Balance Sheet
1H21 Review A$ millions DEC-20 JUN-20 Change
Strong balance sheet: Working capital* 91.6 82.3 9.3
• Total facilities of $100m ($90m senior debt and $10m overdraft) enabling Net debt* 54.2 46.1 8.1
capacity to fund growth Net debt* (post-AASB 16) 110.7 103.8 6.9
• Working capital* increase of $9.3m in part required to proactively manage the Gearing* 1.6x 1.4x 0.2x
COVID-19 disruption to supply chain and the implementation of major projects
Gearing* (post-AASB 16) 2.4x 2.2x 0.2x
• Net debt* increased by $8.1m, with $8.3m capital expenditure* in 1H21 and
payment of final dividend of $3.2m
Working capital* (A$m)
• Low gearing* maintained at 1.6x $110.0
• All banking covenants comfortably met $102.1
$90.0 $98.4
Key Priorities $91.6
$82.3
Further working capital improvement opportunities to be pursued in inventory and $70.0
payables $101.8m $102.1m
$98.4m
$50.0
JUN-19 DEC-19 JUN-20 DEC-20
* Non-IFRS measure as defined in the Appendices (page 20)8 Pro-Pac Packaging Limited: Half-Year Results
Flexibles Packaging
Manufacturing and distribution of bespoke flexible packaging solutions tailored for the industrial, food and beverage, health and agriculture
sectors throughout Australia and New Zealand
1H21 Review (post AASB 16)
• The Flexibles business has performed strongly compared to pcp with:
– Revenue down 11.2%; and
A$ millions 1H21 1H20 Change
– PBT* up 9.9%.
Revenue 135.7 152.8 (11.2)%
• The exit of less profitable business continued which reduced revenue. The exit from less
profitable and non-core business is now complete, with revenue rebased for future growth PBT* 9.7 8.8 9.9%
• New business of $9.7m annualised was won in 1H21, which contributed $2.3m revenue to
1H21 and will convert progressively through 2H21 and early FY22
PBT margin* 7.1% 5.8% 137 bps
• Contracted rise and fall provisions relating to resin input costs resulted in a revenue drop of
$0.9m but had no material impact on earnings
• Revenue reduced from the divestment of the forage business ($5.1m), exit of Canadian Revenue PBT
operations ($2.7m), and a decline in global textiles demand combined with a stronger AUD Contribution to Contribution to
reducing cotton export sales ($2.5m) Group in 1H21 Group in 1H21
• PBT* and PBT margin* continued to improve due to the repositioning of the portfolio and
the delivery of profit improvement initiatives
• A key priority for Flexibles in 2H21 and FY22 will be organic top line growth supported by:
58% 70%
– an increasingly strong pipeline, with opportunities driven by customer and consumer 1H20: 61% 1H20: 73%
demand for innovative and bespoke packaging; and
– the sales restructure, completed in 1H20, which focused on key account management
Shifting business mix toward value added, higher margin
and new business development, driving an increased level of sales effectiveness
segments in flexible packaging
* Non-IFRS measure as defined in the Appendices (page 20), post-AASB 169 Pro-Pac Packaging Limited: Half-Year Results
Industrial Packaging
A one stop shop for primary, secondary and tertiary packaging with deep expertise in food, beverage, agriculture,
retail and health sectors
1H21 Review (post AASB 16) A$ millions 1H21 1H20 Change
• The Industrial business has performed strongly compared to pcp with:
Revenue 62.6 67.3 (7.1)%
– Revenue down 7.1%; and
PBT* 1.1 0.7 61.1%
– PBT* up 61.1%.
PBT margin* 1.8% 1.0% 74 bps
• Revenues were lower than prior year but exceeded internal expectations with
Industrial volumes strengthening progressively throughout 1H21 despite supply
chain and sourcing disruptions due to the COVID-19 pandemic
Revenue PBT
• Consistent with our group strategy, Management refocused the product range to
higher margin market sectors where we know we can win and grow Contribution to Contribution to
Group in 1H21 Group in 1H21
• The Cosmic Packaging business was divested at the end of 1H20, resulting in
lower revenue for 1H21 ($0.9m)
• PBT margins* improved as a result of the refocusing of the product range, and
27% 8%
from the completion of several operational initiatives to streamline costs and to 1H20: 27% 1H20: 6%
support future growth
* Non-IFRS measure as defined in the Appendices (page 20), post-AASB 1610 Pro-Pac Packaging Limited: Half-Year Results
Rigid Packaging
A solution-oriented business that focusses on partnering with the small to medium customers seeking technical and
business support with tailored, personalised product and supply chain services
1H21 Review (post AASB 16) A$ millions 1H21 1H20 Change
• The Rigid business has performed strongly compared to pcp with:
Revenue 36.1 30.8 17.1%
– Revenue up 17.1%; and
PBT* 3.0 2.5 19.0%
– PBT* up 19.0%.
PBT margin* 8.4% 8.3% 13 bps
• The COVID-19 pandemic continued to provide sales volume and margin
opportunities, particularly for triggers and pumps for hand sanitiser and other
cleaning and hygiene products
Revenue PBT
• Improvements in the lawn and garden space were driven by more favourable
weather conditions than prior year and growth also reflected a partial recovery Contribution to Contribution to
in the food service sector. New business conversion in specialty closures in the Group in 1H21 Group in 1H21
FMCG space also contributed to revenue and earnings growth.
15% 22%
1H20: 12% 1H20: 21%
* Non-IFRS measure as defined in the Appendices (page 20), post-AASB 1611 Pro-Pac Packaging Limited: Half-Year Results
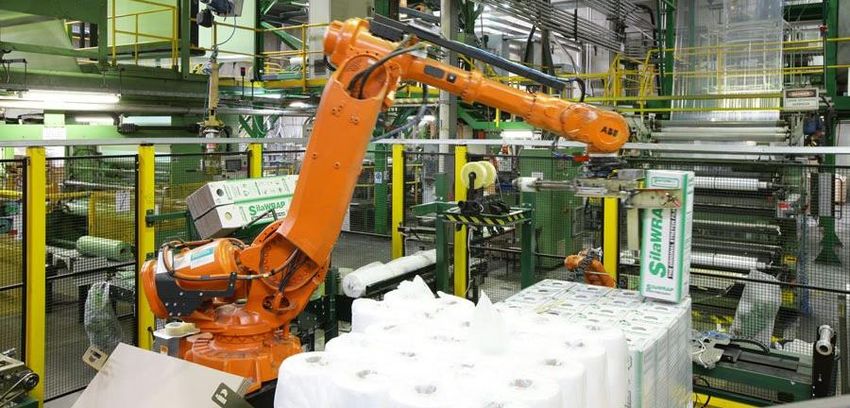
Transformational Projects
Strategic projects initiated to optimise operational footprint, increase manufacturing capability & drive efficiency in
operations
Chester Hill Transition (announced 27 May 2020) ERP replacement project
• Manufacturing at Chester Hill is being transitioned to other • Consolidation of multiple disparate existing systems onto a single
manufacturing sites in Sydney, Melbourne, Adelaide and Perth to integrated ERP platform
consolidate footprint • Microsoft Dynamics 365 selected and KPMG engaged as system
• Investment in a new 7-layer extruder (commissioned February 2021) implementer
and laminator provide new capacity and capability for growth with • Project will deliver standardised processes across the group,
existing customers and expansion into new markets improvements in efficiency, transparent and timely information to
• On track for estimated completion date – June 2021 enable better decision making and reduced technology complexity
• No change to budget and annualised benefits, with circa $7m cost • Reduction in corporate and operational costs expected
reduction still expected in FY22 • Phase 1 on track for estimated completion date – March 2021
• Capital expenditure* of $2.1m and one-off costs of $0.9m incurred in • Overall project on track for estimated completion date – June 2022
1H21
• Capital expenditure* and one-off costs still expected to be less than
$8.0m, with $2.0m capitalised in 1H2112 Pro-Pac Packaging Limited: Half-Year Results
Supreme Packaging Acquisition
Supreme is a flexible packaging business that services markets in core verticals of food, beverage and produce
• Consistent with Pro-Pac’s strategy of growth through earnings
accretive acquisitions in existing and adjacent market segments, on
31 January 2021 the company acquired the business and assets
of Supreme Packaging Pty Ltd (Supreme), a flexible packaging
business in Clayton, Victoria that employs 50 staff
• This acquisition comprises flexographic printing, slitting and bag
making assets and services markets in core Pro-Pac verticals of food,
beverage and produce. Supreme’s capability includes pre-press and
design, 8 colour printing, slitting, bag making and micro perforation.
• Supreme is certified to ISO 9001
• Purchase price of $3.2m ($0.5m in deferred consideration)
• Based on historical performance, Supreme is expected to deliver
revenues of circa $10m-12m in FY2213 Pro-Pac Packaging Limited: Full Year Results
Outlook14 Pro-Pac Packaging Limited: Half-Year Results
FY21 Outlook
Subject to macroeconomic and COVID-19 conditions remaining
stable, and no major disruptions to Pro-Pac‘s supply chain, we
continue to expect a full year PBT* (before significant items) above
the prior year.
* Non-IFRS measure as defined in the Appendices (page 20), post-AASB 1615 Pro-Pac Packaging Limited: Half-Year Results
Appendices16 Pro-Pac Packaging Limited: Half-Year Results
Adopting AASB 16 Leases
AASB 16 Leases became effective for Pro-Pac Packaging on 1 July 2019, requiring operating lease arrangements to be
recognised on balance sheet
The impact on the profit or loss for 1H21 is shown in the table below:
1H21 1H20
Pre- Adopt Post- Pre- Adopt Post-
A$ millions AASB 16 AASB 16 AASB 16 AASB 16 AASB 16 AASB 16
Revenue from contracts with customers 234.4 - 234.4 251.0 - 251.0
Operating expenditure (215.5) 6.5 (209.0) (232.9) 6.9 (226.0)
EBITDA* 18.9 6.5 25.4 18.1 6.9 25.0
Depreciation and amortisation expense (4.1) (6.1) (10.2) (4.5) (5.6) (10.1)
EBIT* 14.7 0.5 15.2 13.6 1.3 15.0
Finance costs, net (1.6) (1.9) (3.5) (3.0) (3.1) (6.1)
PBT* 13.1 (1.4) 11.7 10.6 (1.8) 8.8
Significant items (2.8) - (2.8) - - -
Profit before income tax 10.3 (1.4) 8.8 10.6 (1.8) 8.8
* Non-IFRS measure as defined in the Appendices (page 20)17 Pro-Pac Packaging Limited: Half-Year Results
Reconciliations
Reconciliation to EBIT* & EBITDA*
1H21 1H20
Pre- Adopt Post- Pre- Adopt Post-
A$ millions AASB 16 AASB 16 AASB 16 AASB 16 AASB 16 AASB 16
Profit/(loss) before tax 10.3 (1.5) 8.8 10.6 (1.8) 8.8
Add: significant items 2.8 - 2.8 - - -
Add: finance costs 1.6 2.0 3.6 3.0 3.1 6.1
Less: interest income - - - - - -
EBIT* 14.7 0.5 15.2 13.6 1.3 14.9
Add: depreciation and amortisation 4.1 6.1 10.2 4.5 5.6 10.1
EBITDA* 18.9 6.5 25.4 18.1 6.9 25.0
Reconciliation to NPAT*
1H21 1H20
Pre- Adopt Post- Pre- Adopt Post-
A$ millions AASB 16 AASB 16 AASB 16 AASB 16 AASB 16 AASB 16
Profit/(loss) after tax 7.2 (1.0) 6.2 7.6 (1.2) 6.4
Add: significant items 2.8 - 2.8 - - -
Less: income tax on significant items (0.8) - (0.8) - - -
NPAT* 9.2 (1.0) 8.2 7.6 (1.2) 6.4
* Non-IFRS measure as defined in the Appendices (page 20)18 Pro-Pac Packaging Limited: Half-Year Results
Reconciliations
Reconciliation to Operating Cash Flow*
1H21 1H20
Pre- Adopt Post- Pre- Adopt Post-
A$ millions AASB 16 AASB 16 AASB 16 AASB 16 AASB 16 AASB 16
Net cash flows from operating activities 4.3 4.6 8.9 7.1 3.8 11.1
Add: income tax paid 1.2 - 1.2 0.5 - 0.5
Add: significant items paid, net 3.3 - 3.3 0.2 - 0.2
Add: interest paid 1.3 1.9 3.2 2.4 3.1 5.5
Less: interest received - - - - - -
Operating cash flow* 10.1 6.5 16.5 10.2 7.1 17.3
EBITDA 18.9 6.5 25.4 18.1 7.1 25.0
Operating cash flow conversion 52.2% 12.9% 65.1% 56.0% 13.3% 69.3%
* Non-IFRS measure as defined in the Appendices (page 20)19 Pro-Pac Packaging Limited: Half-Year Results
Reconciliations
Reconciliation to Gearing*
DEC-20 JUN-20
Pre- Adopt Post- Pre- Adopt Post-
A$ millions AASB 16 AASB 16 AASB 16 AASB 16 AASB 16 AASB 16
EBITDA* 33.2 13.6 46.8 32.4 14.0 46.4
Add: unconsolidated LTM EBITDA from acquisitions - - - - - -
LTM Adjusted EBITDA* 33.2 13.6 46.8 32.4 14.0 46.4
Bank loans 66.6 - 66.6 66.5 - 66.5
Hire purchase and finance leases 0.7 (0.7) - 1.0 (1.0) -
Lease liabilities - 57.2 57.2 - 58.7 58.7
Less: cash and cash equivalents (13.1) - (13.1) (21.4) - (21.4)
Net debt* 54.2 56.5 110.7 46.1 57.7 103.8
Gearing* 1.6 0.8 2.4 1.4x 0.8x 2.2x
* Non-IFRS measure as defined in the Appendices (page 20)20 Pro-Pac Packaging Limited: Half-Year Results
Reconciliations
Reconciliation of Significant Items*
1H21 1H20
Pre- Adopt Post- Pre- Adopt Post-
A$ millions AASB 16 AASB 16 AASB 16 AASB 16 AASB 16 AASB 16
Site consolidation and exit costs 0.9 - 0.9 - - -
Acquisition and integration costs 0.4 - 0.4 1.1 - 1.1
Business interruption costs 1.4 - 1.4 1.7 - 1.7
Litigation costs 0.4 - 0.4 - - -
Reversal of provisions and other liabilities (0.2) - (0.2) (2.8) - (2.8)
Significant items before income tax 2.8 - 2.8 - - -
Income tax (expense)/benefit (0.8) - (0.8) - - -
Significant items after income tax 2.0 - 2.0 - - -
Payments in relation to significant items 3.3 - 3.3 3.2 - 3.2
Receipts from insurer - - - (3.0) - (3.0)
Significant items paid, net 3.3 - 3.3 0.2 - 0.2
* Non-IFRS measure as defined in the Appendices (page 20)21 Pro-Pac Packaging Limited: Half-Year Results
Definitions of Non-IFRS Financial Measures
Unless otherwise stated in this presentation, all metrics are disclosed post-AASB 16
1H20 means the half-year ended 31 December 2019
1H21 means the half-year ended 31 December 2020
Adjusted EBITDA means EBITDA, plus any unconsolidated LTM EBITDA attributable to operations acquired
Capital expenditure represents payments for intangibles and property, plant and equipment less disposal proceeds
EBITDA refers to profit/(loss) before finance costs and interest income, income taxes and significant items
PBT refers to profit/(loss) before income taxes and significant items
PBT margin is calculated as PBT divided by revenue
Gearing is calculated as net debt divided by Adjusted EBITDA before accounting for AASB 16 Leases (unless otherwise stated)
LTM means the last 12-month period
Net debt is calculated as interest-bearing liabilities, less cash and cash equivalents before accounting for AASB 16 Leases (unless otherwise
stated)
NPAT refers to profit/(loss) before significant items after income taxes
Operating cash flow is defined as net cash flows from operating activities, plus income tax paid, plus interest paid (net of interest income),
plus significant items paid
Operating cash flow conversion is defined as operating cash flow divided by EBITDA
ROI refers to return on investment
Working capital refers to trade and other receivables, inventories, deposits and prepayments, less trade and other payablesYou can also read