Probabilistic tsunami hazard analysis for Tuzla test site using Monte Carlo simulations
←
→
Page content transcription
If your browser does not render page correctly, please read the page content below

Nat. Hazards Earth Syst. Sci., 20, 1741–1764, 2020
https://doi.org/10.5194/nhess-20-1741-2020
© Author(s) 2020. This work is distributed under
the Creative Commons Attribution 4.0 License.

Probabilistic tsunami hazard analysis for Tuzla
test site using Monte Carlo simulations
Hafize Basak Bayraktar1,2 and Ceren Ozer Sozdinler3
1 Department    of Physics “Ettore Pancini”, University of Naples Federico II, Naples, 80126, Italy
2 Istituto Nazionale di Geofisica e Vulcanologia, Rome, Italy
3 Institute of Education, Research and Regional Cooperation for Crisis Management Shikoku,

Kagawa University, Takamatsu, 760-8521, Japan

Correspondence: Hafize Basak Bayraktar (hafizebasak.bayraktar@unina.it)

Received: 24 July 2019 – Discussion started: 5 September 2019
Revised: 10 January 2020 – Accepted: 9 February 2020 – Published: 15 June 2020

Abstract. In this study, time-dependent probabilistic tsunami      points are selected along the western coast of Istanbul by in-
hazard analysis (PTHA) is performed for Tuzla, Istanbul, in        cluding Tuzla coasts. Tuzla is one of the areas that shows
the Sea of Marmara, Turkey, using various earthquake sce-          high probability exceedance of 0.3 m wave height, which is
narios of Prince Island Fault (PIF) within the next 50 and         around 90 %, for the next 50 years while this probability
100 years. The Monte Carlo (MC) simulation technique is            reaches up to more than 95 % for the next 100 years.
used to generate a synthetic earthquake catalogue, which
includes earthquakes having moment magnitudes between
Mw 6.5 and 7.1. This interval defines the minimum and max-
imum magnitudes for the fault in the case of an entire fault       1   Introduction
rupture, which depends on the characteristic fault model.
Based on this catalogue, probability of occurrence and as-         The Marmara region, especially highly populated cities along
sociated tsunami wave heights are calculated for each event.       the coasts of the Marmara Sea, is the heart of the Turkish
The study associates the probabilistic approach with tsunami       economy in terms of having a great number of industrial
numerical modeling. The tsunami numerical code NAMI                facilities with the largest capacity and potential, refineries,
DANCE was used for tsunami simulations. According to the           ports and harbors. The Marmara Sea and surrounding area
results of the analysis, distribution of probability of occur-     is one of the most seismically active areas in Turkey. Main
rence corresponding to tsunami hydrodynamic parameters is          active faults of the region pass through the Marmara Sea.
represented. Maximum positive and negative wave ampli-             Thus, coastal cities in the Marmara region, especially Istan-
tudes show that tsunami wave heights up to 1 m have 65 %           bul, which has significant importance in terms of the econ-
probability of exceedance for the next 50 years and this value     omy and historical and sociocultural heritage with a popu-
increases by 85 % in the Tuzla region for the next 100 years.      lation of more than 15 million, are under the threat of high
Inundation depth also exceeds 1 m in the region with proba-        damage due to possible big earthquakes and also triggered
bilities of occurrence of 60 % and 80 % for the next 50 and        tsunamis. Recent studies and evaluation of earthquake recur-
100 years, respectively. Moreover, probabilistic inundation        rence periods revealed that there is a high possibility of hav-
maps are generated to investigate inundated zones and the          ing an earthquake with a magnitude larger than Mw 7.0 in the
amount of water penetrated inland. Probability of exceedance       Prince Island Fault (PIF). According to Ambraseys (2002),
of 0.3 m wave height ranges between 10 % and 75 % accord-          the last earthquake on this fault system occurred in 1766
ing to these probabilistic inundation maps, and the maximum        and since that time this fault has been accumulating a huge
inundation distance calculated in the entire earthquake cata-      amount of energy. According to Parsons (2004), the proba-
logue is 60 m in this test site. Furthermore, synthetic gauge      bility of occurrence of a M > 7 earthquake beneath the Mar-
                                                                   mara Sea was estimated to be 35 %–70 % in the following

Published by Copernicus Publications on behalf of the European Geosciences Union.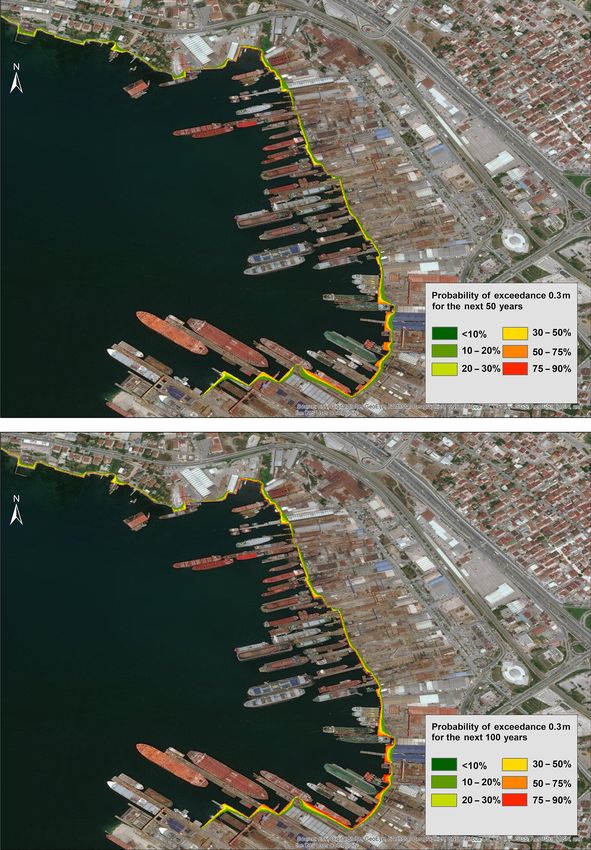
1742                    H. B. Bayraktar and C. Ozer Sozdinler: Probabilistic tsunami hazard analysis for Tuzla test site

30 years. The region has distinctive characteristics in terms     earthquakes with the recurrence interval of about 250 years
of its complex tectonic structure and the high possibility        beneath the Marmara Sea; the last event occurred in 1766
of an earthquake occurrence with a magnitude larger than          (Ambraseys, 2002; Bohnhoff et al., 2013). This event caused
7.0 offshore of Istanbul. Therefore, there has been a wide        the rupture of the 58 km long northern part of the NAFZ
range of studies in the Marmara Sea region regarding the          from İzmit to Tekirdağ (Ambraseys and Finkel, 1995; Am-
fault mechanisms, seismic activities, earthquakes, and trig-      braseys and Jackson, 2000). However, the earthquake that
gered tsunamis (Armijo et al., 2002, 2005; Okay et al., 1999;     happened on 2 September 1754 can be considered the last
Le Pichon et al., 2001; Yaltırak, 2002; McNeill et al., 2004;     characteristic event for the PIF segment, and it caused the
Aksu et al., 2000; Imren et al., 2001; Pondard et al., 2007;      rupture of a 36 km long fault segment (Ambraseys and Jack-
Yalçıner et al., 1999, 2000, 2002; Aytore et al., 2016; Hébert    son, 2000). The NAFZ has experienced two M > 7 earth-
et al., 2005; Altınok et al., 2003, 2011; Guler et al., 2015;     quakes: in August 1912 in Ganos and August 1999 at İzmit.
Cankaya et al., 2016; Tufekci et al., 2018; Latcharote et al.,    After the 1999 İzmit event, seismic energy along the 150 km
2016).                                                            long northern part of the NAFZ has been accumulating con-
   The North Anatolian Fault Zone (NAFZ) controls a great         tinuously since the 22 May 1766 earthquake. This fault zone
part of the seismic activity in the Marmara Sea region. The       extends right to the south of Istanbul beneath the Marmara
fault zone sets apart Anatolia (Asian part of Turkey) and         Sea, and this situation increases the rupture possibility of the
Eurasia due to the northward migration of the Arabian Plate       PIF and the risk for Istanbul (Stein et al., 1997; Barka, 1999;
in the east and southward rollback of the Hellenic subduction     Bohnhoff et al., 2013). Ergintav et al. (2014) also indicated
zone in the west as seen in Fig. 1 (Armijo et al., 1999; Flerit   that the PIF segment accumulates stress 15 ± 2 mm yr−1 ,
et al., 2004; Le Pichon et al., 2015).                            and the 3.7 m slip deficit has been accumulating since the
   The Marmara Sea region is a transition zone between the        1766 events. This makes the PIF most likely to generate the
strike-slip regime of the NAFZ and the extension regime of        next M > 7 earthquake along the Sea of Marmara segment
the Aegean Sea area (top left of Fig 1). The northern branch      of the NAF.
of the NAFZ forms a major transtensional NW–SE right bend            Besides these seismic activities in the region, studies of
under the Sea of Marmara at the Çınarcık trough (Murru et         the historical tsunami records show that 35 tsunami events
al., 2016). The fault trace is attached to the complex Central    happened between 330 BCE and 1999 BCE in the Mar-
Marmara and Tekirdağ pull-apart basins, before joining the       mara Sea region, and the majority of them are earthquake-
NE–SW-striking Ganos fault on land by following the north-        related tsunami events (Altinok et al., 2011; Yalçıner et al.,
ern margin of the Marmara Sea. Finally, the fault exits into      2002). The 1509 earthquake, with an estimated magnitude
the Aegean Sea by way of Saros Gulf (Wong et al., 1995;           around 7.5 (Ambraseys, 2002), is one of the examples for
Armijo et al., 1999, 2002; Okay et al., 1999; Le Pichon et al.,   these events. This earthquake triggered a tsunami and the
2001; Yaltırak, 2002; McNeill et al., 2004). The fault trace      tsunami waves inundated the Istanbul coast, reaching the city
beneath the Marmara Sea is not directly observable. There-        walls and killing around 4000–5000 people in the city (Am-
fore, making a segmentation model for the offshore parts of       braseys and Finkel, 1995). The 1894 earthquake is also one
the NAFZ is quite challenging, which causes the fault dimen-      of the important events that happened in the Marmara Sea.
sions, such as its length and width, to include a sum of error    The earthquake triggered a tsunami and the sea inundated
margin (Aksu et al., 2000; Imren et al., 2001; Le Pichon et       200 m of coast in Istanbul (Altinok et al., 2011). The most
al., 2001; Armijo et al., 2002, 2005; Pondard et al., 2007).      recent event happened after the 17 August 1999 İzmit earth-
   The current right-lateral slip rate along the NAFZ is about    quake, and after the earthquake E–W-trending tectonic de-
25 mm yr−1 (Meade et al., 2002; Reilinger et al., 2006).          formation along the basin and submarine failures generated
On the western side, the motion between the Anatolian and         a tsunami. The International Tsunami Survey Team (Yalciner
Eurasian plates is accommodated across the Marmara region         et al., 1999, 2000) investigated the region and they observed
by ∼ 19 mm yr−1 of right-lateral slip and 8 mm yr−1 of ex-        2.66 m run-up along the coast from Tütünçiftlik to Hereke
tension (Flerit et al., 2003, 2004). Slip rates of the main       and 2.9 m run-up at Değirmendere (Yalçıner et al., 2002).
Marmara fault range between 17 and 28 mm yr−1 (Le Pi-                Several tsunami hazard estimation studies (Ozer Sozdinler
chon et al., 2003; Reilinger et al., 2006). On the other hand,    et al., 2020; Hancilar, 2012; Aytore et al., 2016; Hébert et al.,
Hergert and Heidbach (2010) suggest that the right-lateral        2005) were also conducted in the region. These tsunami anal-
slip rate on the main Marmara fault is between 12.8 and           yses were mostly performed in a deterministic manner using
17.8 mm yr−1 due to slip partitioning and internal defor-         various earthquake scenarios depending on the combinations
mation. The right-lateral slip rate for the PIF and Çınarcık      of different fault parameters without considering probabil-
basin is 15 ± 2 mm yr−1 and in addition to this the fault has     ity of occurrences. The 40 km long fault in the eastern basin
6 ± 2 mm yr−1 of extension (Ergintav et al., 2014).               of the Marmara Sea, with a significant normal component,
   The main characteristic of the NAFZ is that the earth-         may generate tsunami waves which can reach maximum 2 m
quakes systematically propagate westward, and historical          heights along the Istanbul coast with considerable local inun-
records show that the northern strand of the NAFZ generates       dation (Hébert et al., 2005). The rupture of the Yalova Fault,

Nat. Hazards Earth Syst. Sci., 20, 1741–1764, 2020                                https://doi.org/10.5194/nhess-20-1741-2020
H. B. Bayraktar and C. Ozer Sozdinler: Probabilistic tsunami hazard analysis for Tuzla test site                                         1743

Figure 1. Seismicity map of the Marmara region and general tectonic map of Turkey at the top left. In the seismicity map, the size of the
circles changes with magnitude of the earthquakes, and the color of the circles defines the depth change of the earthquakes. Red lines show
the known active faults (modified from Emre et al., 2013) in the region, and the white square is the area with the PIF. In the general tectonic
map of Turkey, red arrows show the direction of the plate motion, black lines show the active faults in the region (modified from Emre et
al., 2013), and the red rectangle shows the Marmara region (created using The Generic Mapping Tools, version 5.4.1). The duration of the
catalog, used for the seismicity map, is 05 April 1905–31 December 2018 (KOERI, 2001).

PIF, or Central Marmara Fault can also cause serious dam-                 results of probabilistic studies should be considered when
age along the coast of Istanbul. Tsunami wave heights can                 decision makers design coastal zones and structures, espe-
reach 4.8 m and can penetrate 340 m inwards from the coast                cially critical ones. Different from previous probabilistic ap-
in Haydarpaşa Port (Aytore et al., 2016).                                proaches in the Marmara Sea, the probability of earthquake
   A few probabilistic seismic and tsunami hazard analyses                occurrences in one fault segment, PIF, are taken into ac-
(Murru et al., 2016; Erdik et al., 2004; Hancilar, 2012) were             count for the preparation of high-resolution tsunami inunda-
also performed in this region. Seismic hazard maps were pre-              tion maps and distribution of hydrodynamic parameters due
pared in the Marmara Sea region by describing fault seg-                  to the probability of occurrence of associated earthquakes on
ments and peak ground accelerations with the periods cor-                 the PIF determined by Monte Carlo (MC) simulations.
responding to 10 % and 2 % probabilities of exceedance in                    This probabilistic tsunami hazard analysis (PTHA) study
50 years (Erdik et al., 2004). In addition, tsunami inunda-               depends on the fully characteristic fault model, and the main
tion maps are prepared based on probabilistic and determinis-             purpose is to perform PTHA for selected test sites. The Tu-
tic analyses by depending on these segmentations (Hancilar,               zla test site is one of the coastal districts of Istanbul and lo-
2012). Time-dependent and time-independent earthquake                     cated on the southernmost part of the city (Fig. 2). The re-
ruptures are also estimated in the Marmara Sea region for                 gion includes several residential areas, but the most critical
the next 30 years (Murru et al., 2016). These previous stud-              point about the region is that Tuzla has the biggest shipyard
ies have been conducted for entire Marmara Sea region and                 area not only in the Marmara Sea but also in Turkey (Fig. 3).
therefore they give general and rough information about                   In this study we mainly focused on this region because it is
probability of occurrence in the region without focusing on               about 20 km away from the PIF and therefore has a high risk
any specific region in high resolution. However, probabilis-              of both earthquake and tsunami damage.
tic tsunami hazard assessment is important to calculate the
tsunami exposure and risk on human populations and infras-
tructures, since probability calculations consider all possible           2   Probabilistic analysis
earthquakes in a fault even if they occur with very low prob-
                                                                          Probabilistic tsunami hazard analysis (PTHA), as it is re-
ability (Løvholt et al., 2012, 2015; Grezio et al., 2017). The
                                                                          cently becoming a widely used procedure for coastal zones,

https://doi.org/10.5194/nhess-20-1741-2020                                        Nat. Hazards Earth Syst. Sci., 20, 1741–1764, 2020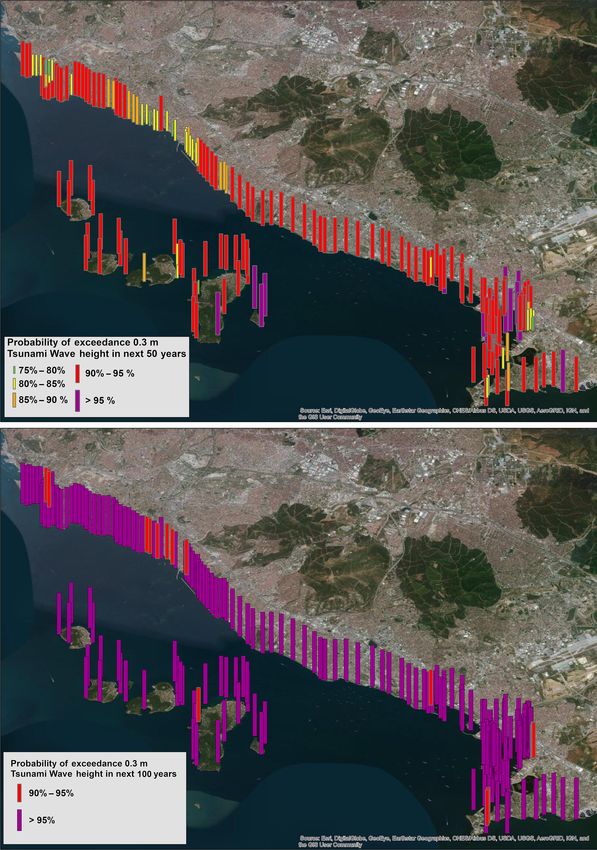
1744                      H. B. Bayraktar and C. Ozer Sozdinler: Probabilistic tsunami hazard analysis for Tuzla test site

Figure 2. The Marmara Sea region, Tuzla test site, and the location of the PIF segment which is used in the analysis like a straight line
(created using ArcMap version 10.5).

is performed for the Tuzla region, Istanbul. This method               PTHA methodologies (Geist and Lynett, 2014). Probabilistic
has been applied for various tsunami sources, such as                  studies are also applied to develop multi-hazard loss estima-
earthquakes, landslides, volcanic activities, etc., on vari-           tion methodology for coastal regions that are exposed to cas-
ous scales, local, regional, and global (Grezio et al., 2017).         cading shaking-tsunami hazards due to offshore mega-thrust
For earthquake-generated tsunamis, the method is generally             subduction earthquakes (Goda and De Risi, 2018).
adapted from seismic hazard assessment methods (González                  In this study, a characteristic earthquake model is used to
et al., 2009). Such kinds of studies consider the events that          estimate the earthquake recurrence on the PIF. Paleoseismo-
are generated by coseismic seafloor displacement, using seis-          logic studies (Ryall et al., 1966; Allen, 1968; Schwartz and
mic probabilistic hazard analysis (SPTHA), but numerous                Coppersmith, 1984) suggest that an individual fault tends
tsunami simulations are required to consider all expected              to generate characteristic earthquakes having a very narrow
combinations of seismic sources. This problem can be solved            range of magnitudes. These individual faults have a different
by applying a simplified event tree approach and a two-                frequency distribution than the log linear Gutenberg–Richter
stage filtering procedure to reduce the number of required             frequency–magnitude relationship (Aki, 1984; Schwartz and
source scenarios without decreasing the quality and accu-              Coppersmith, 1984; Youngs and Coppersmith, 1985). Ac-
racy of inundation maps (Lorito et al., 2015). The earth-              cording to Aki (1984), a characteristic earthquake is gener-
quake source itself is very uncertain and the investigation            ated as a result of constancy of barriers to rupture through
of this uncertainty can be carried out by building an event            repeated seismic cycles.
tree instead of using a logic tree and hazard integrals (Selva            PIF is fully characteristic and a characteristic earthquake
et al., 2016). The logic tree approach can be applied to the           will rupture an entire fault as a whole and release all the
generation of tsunami hazard curves to decrease the uncer-             energy. Therefore, while performing MC simulations, the
tainties by including branches, which are the combination              area of the fault and fault parameters (strike, dip, and rake
of tsunami sources, magnitude distribution of characteris-             angles) are used as constants referring to the outcomes
tic tsunamigenic earthquakes, their recurrence interval, and           of EU Seventh Framework Programme project MARSITE
the tsunami height estimation procedure based on a numer-              (Ozer Sozdinler et al., 2020). One of the work packages
ical simulation (Annaka et al., 2007). For regional studies,           of this project aimed to define the geometry of the possi-
hazard curves can be generated by empirical analysis using             ble tsunamigenic faults in the Marmara Sea and 30 differ-
available tsunami run-up data. However, if such data are not           ent earthquake scenarios with the different rupture combina-
available, MC simulations, a computationally based method              tions of 32 possible fault segments. Based on these 30 dif-
widely used in probabilistic seismic hazard analysis (PSHA),           ferent earthquake scenarios, tsunami numerical modeling is
can be considered as a primary method to generate tsunami              performed. The definition of fault segments depends on ex-
hazard curves (Geist and Parsons, 2006; Horspool et al.,               tensive review of the literature (Alpar and Yaltırak, 2002; Al-
2014). Submarine landslides, on the other hand, are the major          tınok and Alpar, 2006; Armijo et al., 2005; Ergintav et al.,
tsunami source for passive margins, which are the transition           2014; Gasperini et al., 2011; Hébert et al., 2005; Hergert et
zone between the oceanic and continental lithosphere that is           al., 2011; Hergert and Heidbach, 2010; Imren et al., 2001;
not an active plate boundary, and they have been included in           Kaneko, 2009; Le Pichon et al., 2001, 2003, 2014; Oglesby

Nat. Hazards Earth Syst. Sci., 20, 1741–1764, 2020                                     https://doi.org/10.5194/nhess-20-1741-2020
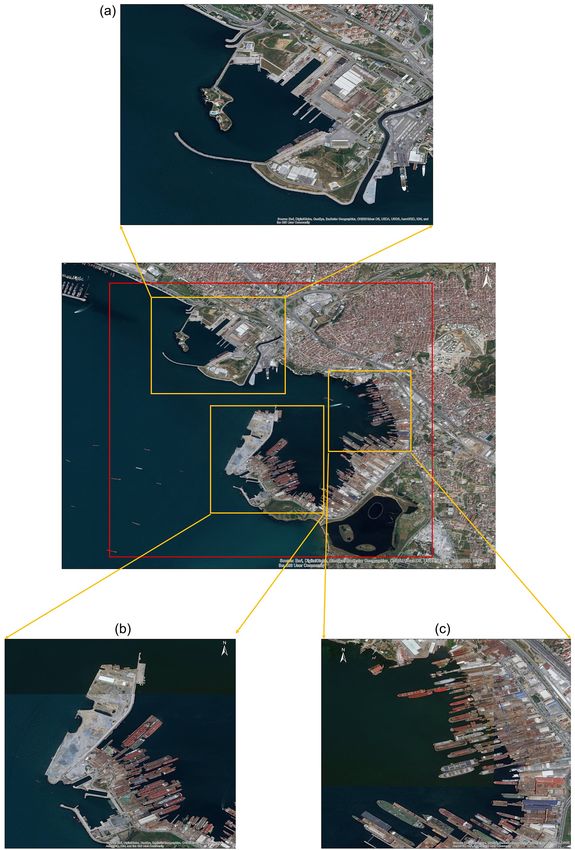
H. B. Bayraktar and C. Ozer Sozdinler: Probabilistic tsunami hazard analysis for Tuzla test site                               1745

Figure 3. Some important locations at the Tuzla domain. (a) Northern part of the Tuzla domain. (b) Southern part of the Tuzla domain.
(c) Tuzla shipyard (created using ArcMap version 10.5).

https://doi.org/10.5194/nhess-20-1741-2020                                  Nat. Hazards Earth Syst. Sci., 20, 1741–1764, 2020
1746                     H. B. Bayraktar and C. Ozer Sozdinler: Probabilistic tsunami hazard analysis for Tuzla test site

Table 1. The area and the focal mechanism of the PIF zone. These    nario. As mentioned earlier, NAFZ generates an earthquake
are the constant parameters during the MC simulation application.   with the recurrence interval of about 250 years beneath the
                                                                    Marmara Sea. Therefore, selecting 100 earthquake scenar-
             Fault    Fault    Strike   Dip   Rake                  ios would cover a time period of 100 × 250 yr = 25 000 yr,
             length   width                                         which is considered as an adequate catalog duration in this
             (km)     (km)                                          study. However, because of having time-dependent proba-
             33.5      14       119     80     210                  bilistic analyses, this catalog duration is not used for PTHA
                                                                    in this study.
                                                                       Earthquake magnitude is one of the parameters randomly
                                                                    selected by the MC technique. Based on a characteristic
and Mai, 2012; Şengör et al., 2014; Tinti et al., 2006; Utkucu     earthquake model, individual faults tend to rupture the entire
et al., 2009). As a result of this review, each fault segment is    fault when a large earthquake occurs. This model assumes
defined as a rectangular area with hypothetical uniform slip.       that a characteristic earthquake releases all of the seismic en-
According to the results of the project, the fault parameters       ergy during the fault rupture, and the magnitude of the earth-
of the PIF are given in Table 1. The 3-D fault configuration        quake depends on the dimension of the fault (Abrahamson
given by Armijo et al. (2002), which explains fault segmen-         and Bommer, 2005).
tation in the region depending on morphology, geology, and             As mentioned previously, only the PIF is considered an
long-term displacement fields, also fits with the PIF parame-       earthquake source approximately 34 km in length and 14 km
ters that are used in the project. These parameters are used as     in width (Ozer Sozdinler et al., 2020; Karabulut et al., 2002).
constants in this study while assessing probability of occur-       This fault zone is assumed to have the potential to gener-
rence of each earthquake to allow full fault rupture at differ-     ate a characteristic earthquake and rupture the entire fault.
ent depths with different magnitudes.                               According to the Wells and Coppersmith (1994) scaling rela-
   The MC simulation technique is generally applied to gen-         tion between fault area and magnitude (Eq. 1), this fault can
erate an earthquake catalogue of a given length of time. In         generate a characteristic earthquake with magnitude varying
this technique, a list of earthquakes can be generated us-          between Mw 6.5 and 7.1.
ing the frequency–magnitude relationship for each seismic
source (Zolfaghari, 2015). Seismic zonation should be per-          Mw = a + b · log(L · W )                                      (1)
formed by considering regions that have relatively homoge-
                                                                    In this equation, a and b are coefficients, which are 4.33
neous earthquake activity and faulting regimes (Sørensen et
                                                                    and 0.9, respectively, L is fault length, and W is the fault
al., 2012). In this study, the fault segment model proposed in
                                                                    width.
Ozer Sozdinler et al. (2020) is used and PIF is the only seg-
                                                                       Displacement on the fault surface calculations is carried
ment that is a seismic source. After that, tsunami numerical
                                                                    out for each randomly selected magnitude using the formu-
modeling is performed for each event of this synthetic cata-
                                                                    lation of Aki (1966),
logue, and tsunami hydrodynamic parameters, mainly maxi-
mum wave heights, inundation depth, current velocities, and              M0   10(Mw +6.07)·1.5
tsunami inundation zones, are estimated. Tsunami risk as-           D=      =                  ,                                  (2)
                                                                         µA        µA
sessment will serve the needs of societies best when regional
studies are associated with the local ones (Sørensen et al.,        where D is displacement on the fault surface, Mw is moment
2012).                                                              magnitude, µ is the shear modulus (µ = 30 GPa), and A is
   The MC simulation technique allows the generation of             the fault area.
a list of earthquakes based on a frequency–magnitude rela-             Seismogenic thickness and the location of the earthquake
tionship. This technique depends on a uniformly distributed         is another important parameter required for earthquake and
source model and it provides an equal likelihood to each            tsunami source. At first, the PIF zone is accepted as fully
earthquake source. As a result, the synthetic earthquake cat-       characteristic and an earthquake should rupture the entire
alogue will have uniformly randomly distributed earthquake          fault area. Therefore, it is assumed that if the rupture starts
sources (Zolfaghari, 2015).                                         at the center of the fault and continues in both directions, the
   Using MC simulation, a synthetic earthquake catalogue            fault will rupture entirely. For this reason, the locations of the
is generated by selecting earthquake magnitude and depth            earthquakes are accepted as the midpoint of the PIF zone for
as uniformly distributed random numbers in a given inter-           each earthquake scenario (Ozer Sozdinler et al., 2020).
val and using area and directivity of the fault as a constant          For the seismogenic thickness, the seismic activity of the
variable (Table 1). We performed MC simulations 100 times           northern segment of NAFZ starts at the depth of 5 km (Karab-
for 100 different earthquake scenarios. The number of earth-        ulut et al., 2003). The bottom of the seismogenic thickness
quakes in the catalog is selected as a reasonable number            can be determined based on the aftershock activity of the
that represents the number of iterations randomly performed         17 August 1999 İzmit earthquake. The earthquakes on the
in MC simulations for having a synthetic earthquake sce-            northern scarp of the Çınarcık basin are observed between

Nat. Hazards Earth Syst. Sci., 20, 1741–1764, 2020                                  https://doi.org/10.5194/nhess-20-1741-2020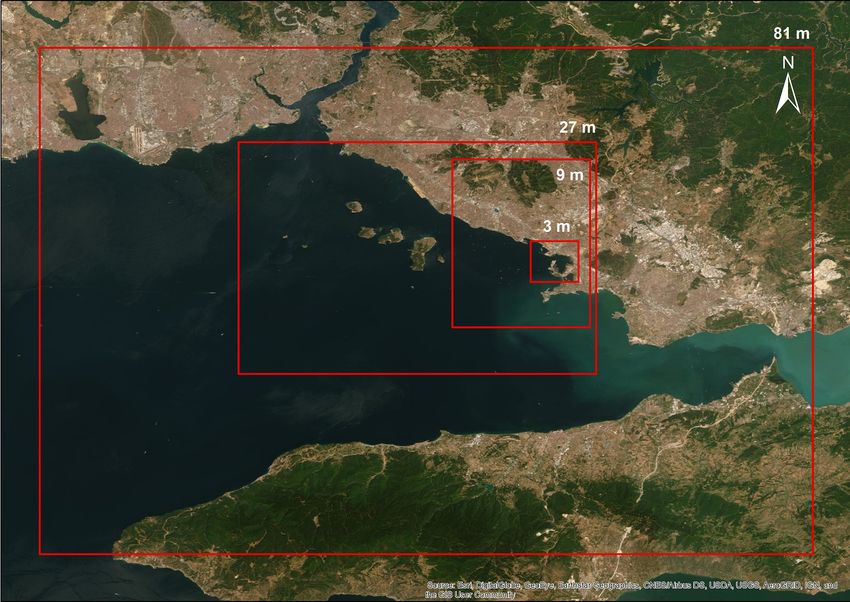
H. B. Bayraktar and C. Ozer Sozdinler: Probabilistic tsunami hazard analysis for Tuzla test site                            1747

the depths of 5 and 14 km. The mechanism of events be-            Japan, respectively, for the prediction of long-term events
tween the depth of 5 and 10 km shows the behavior of nor-         (Petersen et al., 2007). This model depends on the time pe-
mal faulting. On the other hand, the strike-slip mechanism        riod passed since the last characteristic event and recurrence
dominates the depths below 10 to 14 km. As a result, seismic      time of the earthquake. The probability density function for
activity can be observed between the depths of 5 and 14 km,       the BPT model (Matthews et al., 2002) is given by
and fault plane solutions show normal and strike-slip mech-                                    1/2                  !
                                                                                                        (t − Tr )1/2

anisms in this area (Karabulut et al., 2002). Therefore, the                          Tr
                                                                  f (t, Tr , ∝) =                   exp                ,     (3)
depth of events varies between 5 and 14 km in MC simula-                            2π α 2 t 3            2Tr α 2 t
tions.
   In time-independent earthquake occurrence models, prob-        where t is the elapsed time from the last characteristic event
ability of an event occurrence follows a Poisson distribution     and α is the aperiodicity (also known as the coefficient of
in a given period of time. Therefore, the result of this model    variation). Aperiodicity defines the regularity of the expected
does not vary in time. However, probability of an earthquake      characteristic earthquakes on the fault and varies between 0.3
occurrence is based on the time that has passed since the         and 0.7. This parameter, which is known as the parameter
occurrence of the last event and it follows a Brownian pas-       defining how much an expected characteristic earthquake oc-
sage time (BPT), lognormal, or other probability distribution     curs regularly or irregularly on any fault segment (Murru et
(Matthews et al., 2002; Ellsworth et al., 1999; Davis et al.,     al., 2016), was taken as 0.5 in this study (Parsons, 2004). The
1989; Rikitake, 1974). In this model, in addition to the re-      mean recurrence interval of earthquakes (Tr ) can be defined
currence time of earthquakes, variability of the frequency        as the ratio between the mean moment of repeating earth-
of events and the elapsed time from the last characteristic       quakes (seismic moment) and the long-term moment accu-
event are the additional required information and the longer      mulation rate on the fault (moment rate) (Ren and Zhang,
elapsed time causes an increase in probability of an event oc-    2013). Seismic moment can be obtained using the formula-
currence (Cramer et al., 2000; Petersen et al., 2007).            tion of Kanamori (2004), and the moment rate of the fault is
   Calculation of probability in multi-segment ruptures and       calculated from fault area and long-term slip rate of the fault
more complicated models includes the Gutenberg–Richter            (WGCEP, 2003).
magnitude–frequency relationship (Gutenberg and Richter,
1944). The application of time-dependent models is based on              M0    10(Mw +6.07)·1.5
                                                                  Tr =       =                                                (4)
a characteristic earthquake model, which assumes all large               Ṁ0       µV A
events occurring along a particular fault segment would have
similar magnitudes, rupture area, and average displacements       In this equation, Mw is moment magnitude, µ is the shear
(Schwartz and Coppersmith, 1984). Therefore, this model is        modulus, V is long-term slip rate in millimeters per year, and
suitable for calculating the probability of occurrence of an      A is the fault area. The moment magnitude value in Eq. (4)
earthquake on a single fault.                                     was selected randomly using MC simulations. Thus, seismic
   It should be noted that, in this study, PIF is considered to   moment (M0 ) and the mean recurrence time (Tr ) were cal-
be the only source for the earthquake and tsunami. A time-        culated for each earthquake scenario. Long-term slip rate is
dependent probabilistic model is followed for the probabil-       also selected as 17 mm yr−1 for this equation (Ergintav et al.,
ity calculations because this probabilistic model allows us to    2014).
consider only one fault instead of using multi-segment rup-          Probability of the earthquake occurrence on the fault is
ture scenarios through a characteristic earthquake model.         calculated based on the probability density function ap-
   In the time-dependent approach, the BPT probability            proach. The probability of occurrence of an event in the next
model is used to obtain the recurrence time probability of the    1T years, given that it has not occurred in the last t years, is
earthquake in the fault segment. This model does not show a       given by (Erdik et al., 2004)
significant difference with the lognormal distribution except                    t+1T
for consideration of very long elapsed times from the last
                                                                                   R
                                                                                        f (t)dt
characteristic event (Petersen et al., 2007). A characteristic    P (t, 1T ) =
                                                                                  t
                                                                                                  .                           (5)
event occurs when the load-state process reaches the fail-                       t+∞
                                                                                  R
ure threshold; an earthquake releases all energy loaded on                             f (t)dt
                                                                                  t
the fault and then starts the new failure cycle. The time in-
terval between consecutive earthquakes shows a Brownian           In this case, probability of a characteristic earthquake was
passage time distribution and that can be useful to forecast      calculated using 1T as 50 and 100 years.
long-term seismic events by generating a time-dependent
model (Matthews et al., 2002). The Working Group on Cal-
ifornia Earthquake Probabilities (1999) and the Earthquake
Research Committee (2001) have already implemented this
time-dependent approach in the San Francisco Bay area and

https://doi.org/10.5194/nhess-20-1741-2020                                Nat. Hazards Earth Syst. Sci., 20, 1741–1764, 2020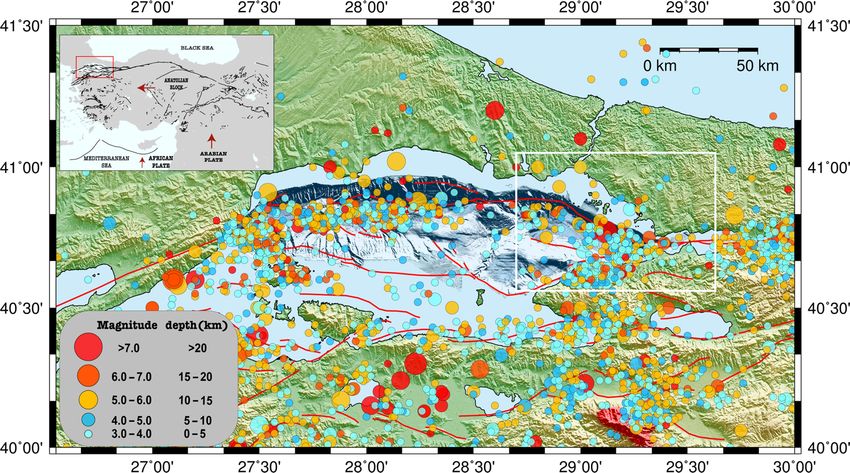
1748                     H. B. Bayraktar and C. Ozer Sozdinler: Probabilistic tsunami hazard analysis for Tuzla test site

Figure 4. Nested domains for tsunami numerical modeling. Red rectangles show the limits of these domains. Grid size of these domains
have a certain 1 : 3 ratio between each other (created using ArcMap version 10.5).

3   Tsunami numerical modeling                                      ample, Fig. 5 shows the initial water surface calculated due
                                                                    to one of 100 tsunami sources generated by MC simulations
Tsunami simulations are performed for each earthquake in            (Fig. 5).
the synthetic catalogue using the tsunami numerical model              Before starting tsunami simulations, the necessary inputs
NAMI DANCE (NAMI DANCE, 2011). The code is the                      should be prepared precisely in order to obtain reliable re-
user-friendly version of TUNAMI-N2 (Imamura et al., 2001)           sults. Bathymetry–topography data are one of the most im-
developed in C++ language, which computes all fundamen-             portant inputs in NAMI DANCE that significantly effects the
tal parameters of tsunami motion in shallow water and in            reliability of results, especially in the shallow water zone
the inundation zone. It uses an explicit numerical solution         due to the nature of the NSW equations. NAMI DANCE
of shallow water wave equations with the finite-difference          can perform nested analyses under the condition that the
technique and allows for better understanding of the effect         grid sizes of the study domains have a certain 1 : 3 ratio be-
of the tsunami waves (Shuto et al., 1990; Imamura, 1989).           tween each other. Therefore, we generated four nested do-
NAMI DANCE can solve both linear and nonlinear shal-                mains having the coarsest grid size as 81 m and the finest
low water (NSW) equations with a selected coordinate sys-           grid size as 3 m with a 1 : 3 ratio in the GIS environment.
tem (Cartesian or spherical) and calculates the tsunami mo-         Bathymetric data for the biggest domain are the combination
tion. Linear shallow water (LSW) equations are preferable in        of the 30 arcsec resolution General Bathymetric Chart of the
deep water because of reasonable computer time and mem-             Oceans (GEBCO) and data produced by navigational charts
ory, and they calculate the results at an acceptable error limit    in shallow zones. Topographic data, on the other hand, are at
(Insel, 2009). NAMI DANCE is validated and verified us-             a high resolution, which is obtained from the Department of
ing NOAA standards and criteria for tsunami currents and            Housing and Urban Development of Istanbul Metropolitan
inundation (Synolakis et al., 2007, 2008). The numerical so-        Municipality digital elevation model (DEM) and vector data
lutions of NAMI DANCE are also tested, validated and ver-           with resolution of 5 and 1 m, respectively. The bathymetry–
ified against analytical solutions, laboratory measurements,        topography data in the smaller domains are the downscaled
and field observations (NTHMP, 2015; Lynett et al., 2017;           version of the 81 m grid bathymetry–topography data; how-
Velioglu, 2009).                                                    ever high-resolution digitized coastline and sea and land
   NAMI DANCE calculates tsunami generation using                   structures are also included in the data to generate the small-
Okada (1985) equations. In this study, water surface distri-        est grid domain of 3 m (Fig. 4).
bution of tsunami source (initial wave amplitude) is calcu-            The synthetic gauge point file is another required input
lated with this method for 100 earthquakes of the synthetic         of NAMI DANCE. In addition to the calculation of prin-
earthquake catalogue prepared by MC simulations. As an ex-          cipal tsunami hydrodynamic parameters, the program can

Nat. Hazards Earth Syst. Sci., 20, 1741–1764, 2020                                  https://doi.org/10.5194/nhess-20-1741-2020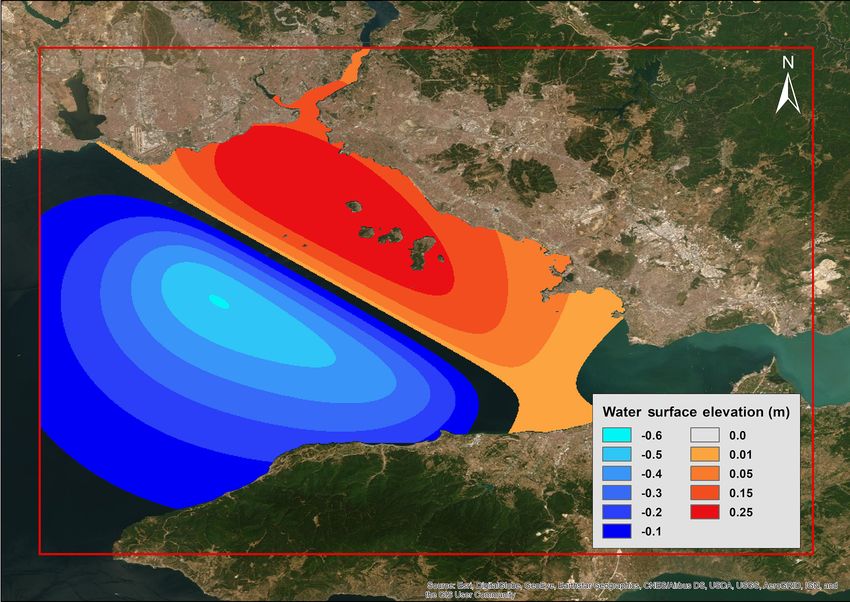
H. B. Bayraktar and C. Ozer Sozdinler: Probabilistic tsunami hazard analysis for Tuzla test site                                    1749

Figure 5. Initial water surface distribution of one of the 100 tsunami sources. The red frame indicates the boundary of the largest nested
domain with an 81 m grid size (plotted using ArcMap version 10.5).

also calculate the change of water level, current velocity, and           We present the results of the PTHA for the Tuzla test site
flow depth over time in every gauge point. Therefore, various          in terms of three different visualization categories for the
gauge points are selected along the coast of nested domains,           next 50 and 100 years. First, distribution of probability of
nearshore and offshore and close to some critical structures           occurrence of the tsunami hydrodynamic parameters, which
on land.                                                               are minimum and maximum water surface elevation and in-
   During the inundation of tsunami waves, current velocity            undation depth, is shown. Second, tsunami inundation maps
is an important tsunami parameter in land and sea, especially          that show the probability of exceedance of 0.3 m inundation
in ports and bays. Strong current velocities may cause sea             depth for different time periods are generated for the Tuzla
vessels to be dragged offshore by undertow or to ground                region in order to observe flooded areas and their probabil-
inland. This parameter as well as tsunami wave amplitude,              ities clearly. Finally, the probability map of exceedance of
inundation depth, and Froude number can be calculated by               0.3 m wave heights at synthetic gauge points is represented
NAMI DANCE. However, in this study, the results are repre-             as a bar chart.
sented based on only the probability of exceedance of thresh-
old values for water surface elevation and inundation depth.           4.1   Probability of exceedance for the entire synthetic
                                                                             earthquake catalogue

4   Results and discussion                                             The graphics are generated to demonstrate the probabilities
                                                                       of occurrences corresponding to the minimum and maxi-
In this study, tsunami hydrodynamic parameters are calcu-              mum water surface elevations and inundation depth calcu-
lated in both the coarsest domain (whole Marmara Sea) and              lated from tsunami sources of each earthquake in the syn-
finest domain (Tuzla region). The main parameters focused              thetic earthquake catalogue.
in this study are the tsunami wave heights and inundation                 It should be noted that in the case of having same magni-
depths, and the results are shown in terms of probability of           tude of earthquakes in two different earthquake scenarios of
exceedance of threshold wave height and inundation depth               the catalogue, the probability of occurrences of these scenar-
values within the next 50 and 100 years. The situation for             ios would be the same. However, since they would have dif-
the next 500 years is not considered because the return pe-            ferent focal depths, the tsunami initial wave height calculated
riod of the fault rupture is about 250 years, which means              by Okada (1985) will be different, which results in the cal-
this fault generates at least one earthquake within the next           culation of different hydrodynamic parameters. As a result,
500 years. In other words, probability of exceedance for the           the graphs show different maximum water surface elevations
next 500 years will be about 99 %.                                     having the same probability of occurrences.

https://doi.org/10.5194/nhess-20-1741-2020                                     Nat. Hazards Earth Syst. Sci., 20, 1741–1764, 2020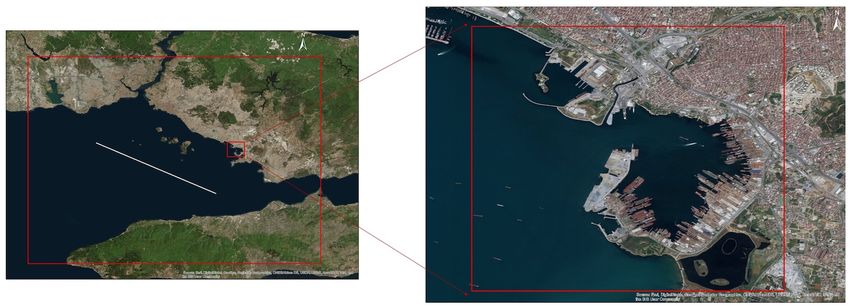
1750                    H. B. Bayraktar and C. Ozer Sozdinler: Probabilistic tsunami hazard analysis for Tuzla test site

Figure 6.

   In Fig. 6, graphics of probabilities of occurrences accord-   The probability of having 1 m inundation depth, on the other
ing to maximum and minimum water surface elevation (max-         hand, can be predicted as about 60 % ± 10 %. The residual of
imum water withdraw) and inundation depth for the next           probability with respect to the fitted curve for each data point
50 years are represented. According to these graphs, tsunami     is demonstrated right after the percentage of probability with
wave heights up to 1 m and withdrawal of the waves around        the ± sign.
1 m have approximately 65 % ± 15 % probability of occur-            The situation for the next 100 years (Fig. 7) obviously
rence. The Tuzla region includes various shipyards, ports,       shows that probability of occurrences would increase with
and other important facilities. Therefore, the probability of    time. The probability of exceedance of 1 m water surface el-
the withdrawal of the water is as important as maximum           evation and 1 m wave withdrawal reaches up to 85 % ± 10 %.
water surface elevation. The 1 m height of wave withdrawal       Probability of exceedance of inundation depth also changes
may cause the ships to be stranded at the ports and results      significantly. The probability of exceedance of 1 m inunda-
in extreme financial losses as observed in the 20 July 2017      tion depth is found to be around 80 % ± 10 %.
Bodrum–Kos earthquake and tsunami (Yalçıner et al., 2017).

Nat. Hazards Earth Syst. Sci., 20, 1741–1764, 2020                              https://doi.org/10.5194/nhess-20-1741-2020
H. B. Bayraktar and C. Ozer Sozdinler: Probabilistic tsunami hazard analysis for Tuzla test site 1751
Figure 6. Probabilities of exceedance corresponding to maximum water surface elevation, minimum water surface elevation, and inundation
depth for the next 50 years. Black dots represent the probability of exceedance of the tsunami hydrodynamic parameter for each event in
the catalog. The blue line is the best fit curve to the data and the dashed blue line is the 95 % confidence boundary of the fitted curve. The
residual of the fit is represented for each probability curve.
Considering the results of the whole simulation, the worst- Inundation depth files, which are one of the outputs of the
case earthquake scenario generated tsunami waves with max- NAMI DANCE, are used for the calculation.
imum water surface elevation equal to 1.8 m, minimum water The inundation depth values at each grid node are replaced
surface elevation (maximum withdraw) equal to −2.1 m, and with the probability of occurrence of the respective earth-
inundation depth equal to 1.6 m. The probability of occur- quake scenario. We repeated this procedure for all earthquake
rence of this event is 35 % for the next 50 years and 60 % for scenarios, which has inundation depths larger than or equal
the next 100 years. to the 0.3 m threshold.
The mean (average) probability of occurrence is calculated
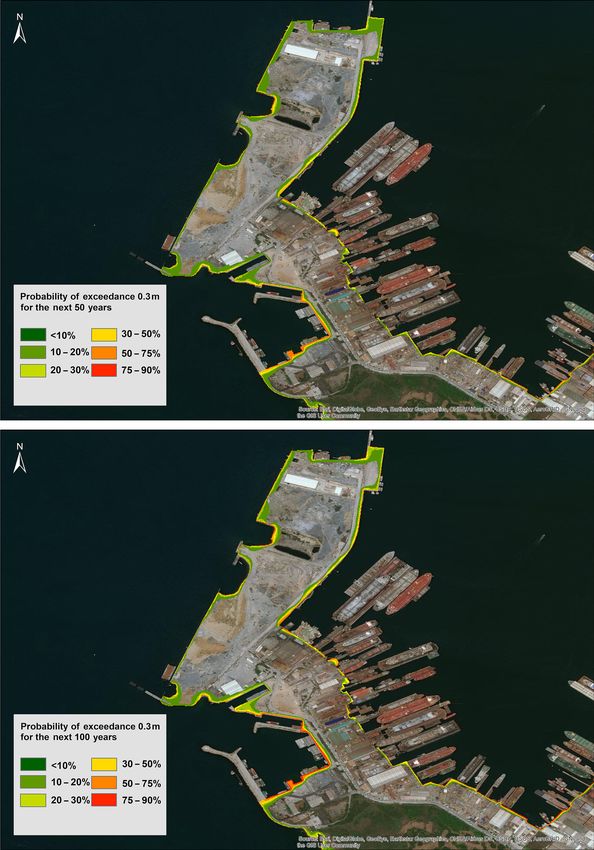
4.2 Probabilistic tsunami inundation maps for the at each grid node. Thus, the spatial distribution of probability
Tuzla test site of exceedance of 0.3 m inundation depth in the inundation
zone is obtained for a specific time interval (Fig. 8).
Inundation maps of the Tuzla domain are also prepared for Figure 8 shows the inundation maps of Tuzla shipyard
the next 50 and 100 years in the GIS environment. Even if for the next 50 and 100 years. Most of the area in the Tu-
inundation depth is on the order of a few centimeters, it can zla shipyard region has a probability of exceedance between
lead to people being dragged by undertow in coastal regions 10 % and 20 % for the next 50 and 100 years. However, some
due to the high current velocities of the waves (Jonkman and places in the northern and southern parts of the area and in-
Penning-Rowsell, 2008). Therefore, these inundation maps side the bay show larger than 75 % probability of inundation
have a great significance for understanding the flooded ar- within the next 100 years. Maximum inundation distance is
eas in the study domain and the amount of water penetrated observed at around 60 m at the test site.
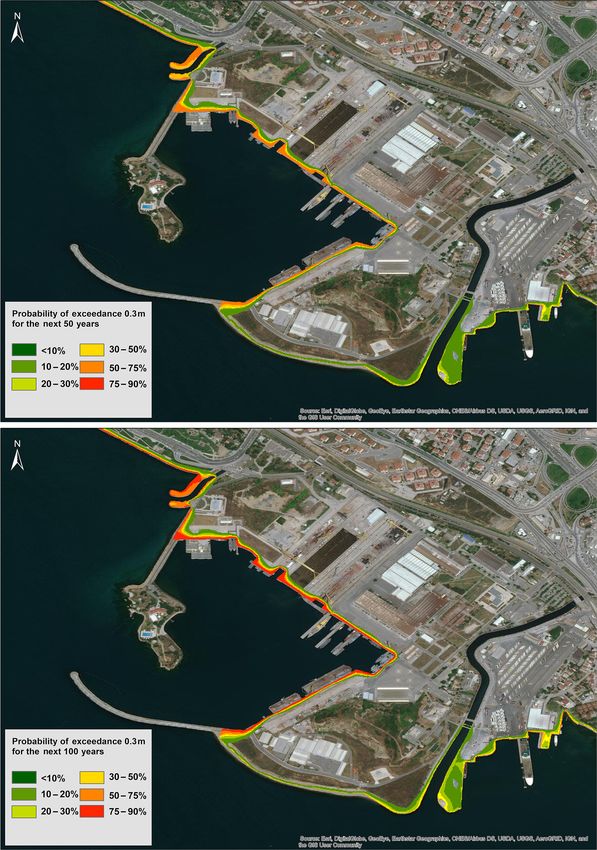
inland. In Fig. 9, probabilistic inundation maps of one of the most
Generation of inundation maps is based on the probability important facilities in the study region are represented for the
of exceedance of 0.3 m inundation depth. There are several next 50 and 100 years. The area has high potential to be ex-
studies in the literature proving both experimentally and nu- posed to tsunami waves with a probability larger than 50 %
merically that tsunami waves with an order of 0.3 m height for the next 50 years. In 100 years, this probability increases
have the potential to crush a human body (Jonkman and and varies between 75 % and 90 %. No significant inundation
Penning-Rowsell, 2008; Takagi et al., 2016). For this rea- zone is observed along the coast of the seawall and the penin-
son, only the earthquake scenarios that generated inundation sula. This may be due to the high ground elevation of these
depths larger than or equal to the 0.3 m threshold value are zones. Tsunami waves are inundated up to 45 m inside the
considered. small bay. This inundation distance could cause severe dam-
https://doi.org/10.5194/nhess-20-1741-2020 Nat. Hazards Earth Syst. Sci., 20, 1741–1764, 20201752 H. B. Bayraktar and C. Ozer Sozdinler: Probabilistic tsunami hazard analysis for Tuzla test site Figure 7. age to the shipyard and other constructions if corresponding portant facility or structure, and the effect of the tsunami will current velocities are also significant. be minimal. The inundation distance decreases to 10 m in the In the next figure (Fig. 10), the southern part of the Tuzla other parts of the region. shipyard is seen according to probabilities of inundation for The region indicated in Fig. 11 is located inside the bay the next 50 and 100 years. Very limited area in the coastal and includes a large part of the shipyard area. This area in- zone is inundated with the probability between 30 % and cludes lots of large and small piers and ship construction fa- 50 % within the next 50 years. The probability decreases up cilities. The situation is more or less the same as the previous to 10 % at some inner locations from the coastline. For 100- region (Fig. 9). The probability of having larger than 0.3 m year recurrence time, the situation is almost the same. Only inundation depth changes between 30 % and 50 % within the minor parts of the region in the south approach the 75 %– next 50 years, while only a few places show 75 %–90 % prob- 90 % probability of exceedance of 0.3 m inundation depth ability for the next 100 years along the coast. Moreover, the threshold. The maximum inundation distance is calculated at maximum inundation distance is calculated as 25 m for this about 60 m. The inundated region does not include any im- zone. Even if the probability of inundation is low, these zones Nat. Hazards Earth Syst. Sci., 20, 1741–1764, 2020 https://doi.org/10.5194/nhess-20-1741-2020
H. B. Bayraktar and C. Ozer Sozdinler: Probabilistic tsunami hazard analysis for Tuzla test site                                        1753

Figure 7. Probabilities of exceedance corresponding to maximum water surface elevation, minimum water surface elevation, and inundation
depth for the next 100 years. Black dots represent the probability of exceedance of the tsunami hydrodynamic parameter for each event in
the catalog. The blue line is the best fit curve to the data and the dashed blue line is the 95 % confidence boundary of the fitted curve. The
residual of the fit is represented for each probability curve.

should be taken into consideration before constructing a new             occurrence, which can generate tsunami waves with at least
structure.                                                               0.3 m wave heights, reaches up to 90 % for the next 100-
                                                                         year time period. However, 95 % probability of exceedance
4.3   Synthetic gauges                                                   of 0.3 m wave height dominates the region for this timescale.
Finally, the probability of exceedance of 0.3 m wave heights             4.4    Uncertainties
at synthetic gauge points is presented by bar charts to con-
sider the nearshore effect of tsunami waves along the western            PTHA studies include some uncertainties because of the rare
coast of Istanbul. Because of the closeness to the fault zone,           occurrence of the large events. Quantification of these uncer-
the southeast coasts of the city are under threat of significant         tainties generally includes the mixture of empirical analyses
tsunami damage. Similar to the method applied during the                 and subjective judgment.
preparation of probabilistic inundation maps, the earthquake                Uncertainties of PTHA can be divided into two: as aleatory
scenarios with wave heights at synthetic gauge points larger             and epistemic variability. Aleatoric uncertainty is the natu-
than or equal to 0.3 m are selected and replaced with the                ral randomness of the physical process. Including more data
probability of each scenario according to wave heights, and              in the analyses does not contribute to the reduction of the
after that the average probabilities at each synthetic gauge             aleatoric uncertainty. However, knowledge about the model-
point are obtained accordingly.                                          ing process may decrease this unpredictability. The occur-
   Figure 12 demonstrates the probability of exceedance of               rence time of the earthquake is one of the most fundamental
0.3 m wave height at synthetic gauge points, which are about             aleatory variables in PTHA. This parameter is generally as-
350 m apart from each other, along the western coast of Is-              sumed to be a time-independent variable. However, in this
tanbul within the next 50 and 100 years. The probability in-             study we used a time-dependent probability model, which
creases while color scale changes from green to purple. Ac-              reduces the uncertainty on this parameter. The mechanism
cording to this figure, minimum probability of exceedance                of the source is considered to be another aleatory variable
is shown as 75 % at some points. Except for a few of the                 for PTHA studies. The majority of earthquakes around the
228 synthetic gauge points, all points have larger than 90 %             world occur at well-defined plate boundaries. However, some
probability of exceedance of 0.3 m wave height within the                unidentified low-activity intraplate faults exist, which were
next 50 years.                                                           recently included in PTHA studies (Selva et al., 2016). More-
   This condition is very serious since there are so many res-           over, the fault volume, which is used in scaling relations
idential areas and important spots such as ports and recre-              to calculate the source magnitude, is another aleatory term.
ational facilities in this region. The minimum probability of            Although homogenous slip distribution is a common imple-

https://doi.org/10.5194/nhess-20-1741-2020                                       Nat. Hazards Earth Syst. Sci., 20, 1741–1764, 2020
1754 H. B. Bayraktar and C. Ozer Sozdinler: Probabilistic tsunami hazard analysis for Tuzla test site Figure 8. Probabilistic tsunami inundation maps for the Tuzla study domain representing the probability of exceedance of 0.3 m inundation depth within the next 50 and 100 years. Change of colors from green to red represents the increasing probability of exceedance (created using ArcMap version 10.5). Nat. Hazards Earth Syst. Sci., 20, 1741–1764, 2020 https://doi.org/10.5194/nhess-20-1741-2020
H. B. Bayraktar and C. Ozer Sozdinler: Probabilistic tsunami hazard analysis for Tuzla test site                                      1755

Figure 9. Probabilistic tsunami inundation maps of the northern part of the Tuzla study domain representing the probability of exceedance of
0.3 m inundation depth for the next 50 and 100 years. Change of colors from green to red represents the increasing probability of exceedance
(created using ArcMap version 10.5).

https://doi.org/10.5194/nhess-20-1741-2020                                      Nat. Hazards Earth Syst. Sci., 20, 1741–1764, 2020
1756                      H. B. Bayraktar and C. Ozer Sozdinler: Probabilistic tsunami hazard analysis for Tuzla test site

Figure 10. Probabilistic tsunami inundation maps for the southern part of the Tuzla study domain representing the probability of exceedance
of 0.3 m inundation depth for the next 50 and 100 years. Change of colors from green to red represents the increasing probability of ex-
ceedance (created using ArcMap version 10.5).

Nat. Hazards Earth Syst. Sci., 20, 1741–1764, 2020                                      https://doi.org/10.5194/nhess-20-1741-2020
H. B. Bayraktar and C. Ozer Sozdinler: Probabilistic tsunami hazard analysis for Tuzla test site                                       1757

Figure 11. Probabilistic tsunami inundation maps of the shipyard area in the Tuzla study domain representing the probability of exceedance of
0.3 m inundation depth for the next 50 and 100 years. Change of colors from green to red represents the increasing probability of exceedance
(created using ArcMap version 10.5).

https://doi.org/10.5194/nhess-20-1741-2020                                      Nat. Hazards Earth Syst. Sci., 20, 1741–1764, 2020
1758                      H. B. Bayraktar and C. Ozer Sozdinler: Probabilistic tsunami hazard analysis for Tuzla test site

Figure 12. Probability of exceedance of the 0.3 m tsunami wave height within the next 50 and 100 years at synthetic gauge points. The
yellow rectangles show the Tuzla study domain; change of colors from purple to green on the bars represents the decreasing probability of
exceedance (created using ArcMap version 10.5).

Nat. Hazards Earth Syst. Sci., 20, 1741–1764, 2020                                     https://doi.org/10.5194/nhess-20-1741-2020
H. B. Bayraktar and C. Ozer Sozdinler: Probabilistic tsunami hazard analysis for Tuzla test site                          1759

mentation in PTHA, slip distribution of large events does not      done based on the time-dependent BPT model, which de-
show homogenous behavior. Therefore, definition of asper-          pends on the time period passed since the last characteris-
ities on the fault is another aleatoric variable which should      tic event and the recurrence time of the earthquake. After
be considered. Tsunami numerical modeling, itself, is also         that, the synthetic earthquake catalogue is generated using
another aleatoric variable since they do not show correlation      the MC simulation technique, and tsunami numerical mod-
with real observations, which are more variable than earth-        eling was performed depending on this earthquake catalogue
quake scenarios incorporated in PTHA (Grezio et al., 2017).        using NAMI DANCE code in a GPU environment.
The aleatory variable affects the results because it is incorpo-      Results of this PTHA study were presented in three dif-
rated directly into the hazard calculations (Abrahamson and        ferent ways for the next 50 and 100 years. The first one was
Bommer, 2005).                                                     the graphs showing the change of probability with the max-
   Epistemic uncertainty, on the other hand, consists of the       imum and minimum water surface elevation and inundation
lack of knowledge of the physical process and data. Segmen-        depth for different time intervals. Secondly, the probabilis-
tation of the fault system is one of the epistemic variables       tic tsunami inundation maps are generated for the Tuzla re-
since it is not certain where the rupture will be generated        gion. Finally, the probability maps of exceedance of 0.3 m
and which segments will be triggered. In addition, there are       wave heights at synthetic gauge points are represented with
many different scaling relations, which cause another epis-        bar charts.
temic uncertainty, between the fault area and magnitude. It           The main results of this study can be summarized as fol-
is also important for tsunami generation whether the fault         lows.
rupture reaches the surface or not. Thus, updip and downdip
limits of the fault rupture can be considered another epis-          – According to the distribution of probability with respect
temic variable (Grezio et al., 2017). Accurate probability dis-        to tsunami hydrodynamic parameters, the probability of
tributions of input cannot be known. For example, one can-             exceedance of 1 m maximum positive and negative wa-
not assume that probability of occurrence of an event follows          ter surface elevation is 65 % within the next 50 years.
Poisson distribution. However, return periods of events do             The probability for 1 m inundation depth is 60 %.
not simply fit this distribution (Gonzalez et al., 2013). Unlike     – Considering probabilities for the next 100 years, 85 %
aleatoric uncertainty, epistemic uncertainty can be decreased          probability of exceedance of 1 m was calculated. For
when more information is available (Godinho, 2007). Differ-            1 m inundation depth, probability of exceedance of
ent techniques, such as logic tree, the Bayesian method, etc.,         about 80 % is obtained.
have been developed to reduce these uncertainties.
   In this study, a probabilistic model is established based on      – As a result of the whole simulation, 1.8, −2.1, and 1.6 m
the characteristic fault model of PIF, which is a segment of           were calculated for maximum and minimum water sur-
NAF, one of the best studied fault zones in the world. It is           face elevation and inundation depth, with the probabil-
also assumed that the entire fault area is ruptured, reaching          ity of 35 % for the next 50 years and 60 % for the next
the surface and generating a homogenous slip for each event.           100 years.
The maximum magnitude range of the fault is calculated with
the Wells and Coppersmith (1994) scaling relation. All these         – Inundation maps indicate that inundation of tsunami
assumptions naturally include uncertainties which are natu-            waves that are equal to or larger than 0.3 m have prob-
rally reflected in this PTHA study. In addition, MC simula-            ability mostly higher than 10 % and 20 % for the next
tion itself also includes uncertainty as being performed 100           50 years and 100 years, respectively. The probability of
times to create synthetic earthquake scenarios. The effect of          occurrence of 0.3 m inundation depth was calculated as
uncertainty in the aperiodicity parameter also exists and can          a maximum of 75 % for the next 100 years. Maximum
be reduced by including different parameters for MC simula-            inundation distance is calculated as 60 m and observed
tion. Therefore, the tsunami hydrodynamic parameters asso-             in the southern part of the finest 3 m grid-sized study
ciated with the probability of occurrence of the correspond-           area.
ing scenario preserve the same uncertainty.                          – Probabilistic results for the exceedance of 0.3 m wave
                                                                       height at synthetic gauge points demonstrate that only a
                                                                       few of them have a probability between 75 % and 85 %;
5   Conclusion                                                         however several points have more than 90 % probabil-
                                                                       ity for the next 50 years. Probability of exceedance in-
In this study, time-dependent PTHA is performed in the Tu-             creases by more than 95 % for the next 100 years.
zla region of Istanbul for the purpose of understanding the
probability of having tsunami inundation after the PIF rup-        The tsunami impact of the PIF rupture along the Tuzla coast
ture. The study combines tsunami numerical modeling with           is very important as proposed by the results of this study.
a probabilistic approach, which is modified by probabilistic       However, as further steps of this study, PTHA can be done
seismic hazard analysis. Probability calculations have been        for the other critical test sites along the Marmara Sea that

https://doi.org/10.5194/nhess-20-1741-2020                               Nat. Hazards Earth Syst. Sci., 20, 1741–1764, 2020
1760 H. B. Bayraktar and C. Ozer Sozdinler: Probabilistic tsunami hazard analysis for Tuzla test site
are close to the PIF segment. In addition, it is also advanta- Acknowledgements. The authors would like to acknowledge the
geous to consider the other fault segments, with their various project MARSITE – New Directions in Seismic Hazard assessment
rupture combinations and complex rupture probabilities in through Focused Earth Observation in the Marmara Supersite (FP7-
Marmara Sea, as further studies. Previously in the framework ENV.2012 6.4-2, grant 308417) and the SATREPS project. The au-
of the MARSITE project, tsunami arrival times and max- thors would like to especially thank Ahmet Cevdet Yalçıner for his
valuable feedback and effort during this study and Bora Yalçıner
imum wave amplitudes were calculated along the coast of
and Andrey Zaitsev for their great support in the development and
the Marmara Sea using different earthquake scenarios, and improvement of the NAMI DANCE numerical code. We would
a tsunami scenario database was obtained with a determin- also like to thank Öcal Necmioğlu, Maura Murru, Giuseppe Fal-
istic approach (Ozer Sozdinler et al., 2020). Results of this cone, Semih Ergintav, Sinan Akkar, Mine Demircioğlu, and
study show that arrival time of tsunami waves is very short Mustafa Erdik for their valuable support and feedback. The Generic
in Marmara Sea for most of the scenarios, which compli- Mapping Tools (GMT; Wessel and Smith, 1998) was used for plot-
cates the tsunami early warning operations and evacuation ting a tectonic map of Turkey and bathymetric map of the Mar-
actions. However, due to the short arrival times of the first mara fault system. Other maps throughout this paper were cre-
tsunami waves along the Marmara coast, the tsunami inun- ated using ArcGIS® software by Esri. ArcGIS® and ArcMap™ are
dation scenario databases would be of great importance in the intellectual property of Esri and are used herein under license.
such conditions. It would be the best option for the decision Copyright © Esri. All rights reserved. For more information about
Esri® software, please visit https://www.esri.com/en-us/home (last
makers and civil protection authorities to also have the inun-
access: 16 February 2020).
dation maps prepared with a probabilistic approach in order
to realize the possibility of exceedance of selected threshold
inundation depth for certain critical coastal locations. Financial support. This research has been supported by the project
This study shows a methodology for PTHA with a time- MARSITE – New Directions in Seismic Hazard assessment
dependent probabilistic model using only one fault (PIF) as through Focused Earth Observation in the Marmara Supersite (grant
the earthquake and tsunami source. Furthermore, this study no. 308417).
can be developed including some faults connected to the
PIF in both time-dependent and time-independent proba-
bility calculations, and BPT probability can be combined Review statement. This paper was edited by Ira Didenkulova and
with static Coulomb stress changes on the faults. The BPT reviewed by two anonymous referees.
model can also be improved by including different aperi-
odicity parameters. The probability of occurrence of earth-
quakes is the main focus of this study to perform tsunami References
hazard analyses. However, submarine landslides are other
critically important sources for tsunami generation in the Abrahamson, N. A. and Bommer, J. J.: Probability and uncer-
Marmara Sea. Probabilities of sliding areas and the slid- tainty in seismic hazard analysis, Earthq. Spect., 21, 603–607,
ing volumes can be considered in the analyses. Subma- https://doi.org/10.1193/1.1899158, 2005.
rine landslide-generated tsunamis can be coupled with the Aki, K.: Asperities, barriers, characteristic earthquakes and strong
earthquake-triggered tsunamis in order to obtain integrated motion prediction, J. Geophys. Res.-Solid, 89, 5867–5872,
PTHA in the Marmara Sea. https://doi.org/10.1029/JB089iB07p05867, 1984.
Aki, K.: Generation and propagation of G waves from the Ni-
igata Earthquake of June 16 1964. Part 2. Estimation of earth-
quake movement, released energy, and stress-strain drop from
Data availability. Data of scenarios used in tsunami nu-
the G wave spectrum, Bull. Earthq. Res. Inst., 44, 73–88, 1966.
merical modeling, inputs for probabilistic tsunami inunda-
Aksu, A. E., Calon, T. J., Hiscott, R. N., and Yasar, D.: Anatomy
tion map for 50 and 100 years, and ∗ .kml files for prob-
of the North Anatolian Fault Zone in the Marmara Sea, Western
ability of exceedance in bar charts can be accessed at
Turkey: extensional basins above a continental transform, GSA
https://doi.org/10.6084/m9.figshare.12033789 (last access:
Today, 10, 3–7, 2000.
27 March 2020) (Bayraktar, 2020). Further information can be
Allen, C. R.: The tectonic environments of seismically active and
made available upon request to the corresponding author.
inactive areas along the San Andreas fault system, Stanford Uni-
versity Publications, Geol. Sci., 11, 70–80, 1968.
Alpar, B. and Yaltırak, C.: Characteristic features of the North Ana-
Author contributions. HBB performed background research, con- tolian Fault in the eastern Marmara region and its tectonic evo-
structed the database, carried out tsunami simulations, mapped the lution, Mar. Geol., 190, 329–350, https://doi.org/10.1016/S0025-
tsunami inundation maps, and wrote the paper. COS supervised the 3227(02)00353-5, 2002.
entire study in all stages and contributed to writing the paper. Altınok, Y. and Alpar, B.: Marmara Island earthquakes, of 1265
and 1935; Turkey, Nat. Hazards Earth Syst. Sci., 6, 999–1006,
https://doi.org/10.5194/nhess-6-999-2006, 2006.
Competing interests. The authors declare that they have no conflict Altınok, Y., Alpar, B., and Yaltırak, C.: Şarköy-Mürefte 1912
of interest. earthquake’s tsunami, extension of the associated faulting
Nat. Hazards Earth Syst. Sci., 20, 1741–1764, 2020 https://doi.org/10.5194/nhess-20-1741-2020You can also read


