Process Optimization of High Surface Area Activated Carbon Prepared from Cucumis Melo by H3PO4 Activation for the Removal of Cationic and Anionic ...
←
→
Page content transcription
If your browser does not render page correctly, please read the page content below
Article
                                                                           Volume 11, Issue 5, 2021, 12662 - 12679
                                                                   https://doi.org/10.33263/BRIAC115.1266212679

Process Optimization of High Surface Area Activated
Carbon Prepared from Cucumis Melo by H3PO4
Activation for the Removal of Cationic and Anionic Dyes
Using Full Factorial Design
Aziz El Kassimi 1, *    , Youness Achour 1, Mamoune El Himri 1, My Rachid Laamari 1, Mohammadine El
Haddad 1, *
1   Laboratory of Analytical and Molecular Chemistry (LCAM), Poly-disciplinary Faculty of safi, Cadi Ayyad University,
    BP 4162, 46000 Safi, Morocco
*   Correspondence: azizelkassimi2012@gmail.com (A.E.K.); elhaddad71@gmail.com (M.E,H.);
                                                                                       Scopus Author ID 57191952633
                               Received: 16.01.2021; Revised: 17.01.2021; Accepted: 23.01.2021; Published: 31.01.2021

Abstract: In this study, Chemical activation was used to prepare a low-cost activated carbon (AC) from
agricultural waste material: Cucumis melo. It was used as a green biosorbent for the removal of cationic
and anionic dyes from aqueous solutions (Methylene blue (MB) and Acid orange 7 (AO7)).A full
factorial 24 experimental design was used to optimize the preparation conditions. The factors and levels
included are activation temperature (300 and 500ºC), activation time (1 and 3 h), H3PO4 concentration
(1.5 and 2.5 mol/L), and contact time (60 and 90 min). The surface area of the activated carbons and
high removal efficiency of MB and AO7 was chosen as a measure of the optimization. The activated
carbon prepared at 500 °C, for 3 hours with an H3PO4 concentration of 2.5 mol/L and a contact time of
90 min, have the largest specific surface area (475 m2/g) and the percentage of discoloration of
methylene blue (99.4%). Furthermore, the greater value of AO7 removal (94.20%) was obtained at 3h
- activation time, 500°C - activation temperature, 1.5 mol/L - H3PO4 concentration with a 90 min contact
time.

Keywords: Cucumis melo; activated carbon; H3PO4 activation; full factorial design; specific surface
area; dyes.
© 2021 by the authors. This article is an open-access article distributed under the terms and conditions of the Creative
Commons Attribution (CC BY) license (https://creativecommons.org/licenses/by/4.0/).

1. Introduction

        Textile dyes are frequently utilized in unlimited industrial applications such as textile,
paint, printing, cosmetics, and food as a coloring agent [1]. The discharge of synthetic dyes
without treatment into the aqueous environment is one of the most important environmental
problems due to its risks on aquatic life and human health [2]. In the literature, numerous
techniques have been employed and investigated extensively to remove dyes from wastewater.
Activated carbons are very efficient and have been preferentially used for the adsorption of
dyes, but their use is restricted due to high cost [3]. The preparation of a new activated carbon
from a cheap and available source has proven useful [4,5].
        Activated carbon (AC) is a long-known adsorbent characterized, among other things
[6], by its large specific surface area and its porous structure [7,8]. It can be prepared from any
solid matter containing a large proportion of carbon [9,10], often by carbonization followed by

https://biointerfaceresearch.com/                                                                             12662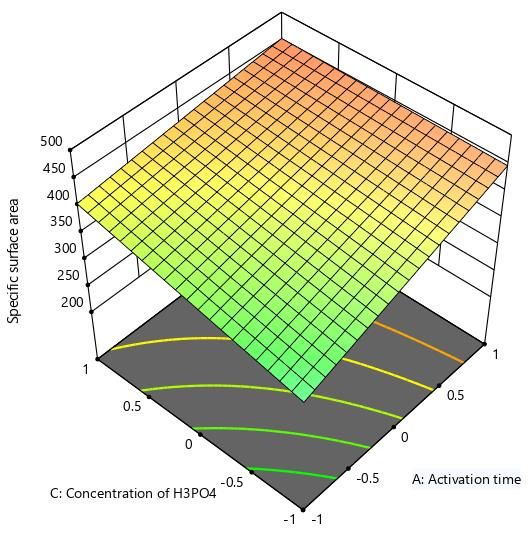
https://doi.org/10.33263/BRIAC115.1266212679

physical or chemical activation. However, a process combining the two stages can be applied.
The main purpose of carbonization is to enrich the material with carbon and create the first
pores, while activation aims to develop a porous structure [11].
        The preparation of activated carbon from local biomass by the chemical activation
method has been the subject of several studies [12-16]. The advantage of chemical activation
is to operate at low pyrolysis temperatures and a lower activation cost. High quality activated
carbon with a very large porous structure and large specific surface area is prepared by plant
biomass using orthophosphoric acid as a chemical activating agent. Controlling the texture and
porosity of activated carbon requires mastery of the steps in the process of synthesis of
activated carbon by physical or chemical activation, by optimizing the steps of the preparation
method.
        For these reasons, the full factorial design (FFD) allows you to obtain the maximum
amount of information with the minimum of experience [17,18]. It allows a complete study of
the influence of all factors on the given process and their optimization. This by looking for a
simple mathematical model giving a good representation of the phenomenon studied.
        Through this work, our contribution in this area is to prepare activated carbon by
chemical activation from the residues of Cucumis melo with orthophosphoric acid (H3PO4) as
an activating agent. Then optimizing preparation parameters using FFD as a design technique
by analyzing the effects of independent variables comprising activation time, activation
temperature, the concentration of activating agent H3PO4, and contact time on the prepared
activated carbon surface and the capacity of removing cationic and anionic dyes: Methylene
blue (MB) and Acid orange 7 (AO7) from aqueous solution.

2. Materials and Methods

        2.1. Preparation of optimized AC.

       The adsorbent materials used in this study are activated carbons prepared by varying
the preparation method's different parameters (Activation time, Activation temperature, the
concentration of activating agent).

        2.1.1.   Purification.

        The residues of Cucumis melo are food waste collected. They are thoroughly washed
with tap water, then with distilled water, until the odor disappears and the rinse water is clear.
Then they are dried for 24 hours at a temperature of 110 °C in an oven. They are then crushed
and sieved to retain very fine particles, then washed several times with distilled water to remove
impurities (dust and water-soluble substances), then dried at 110 °C for 24 h before undergoing
chemical activation with phosphoric acid.

        2.1.2.   Chemical activation with phosphoric acid.

         The retained particles are impregnated in a phosphoric acid solution with concentrations
ranging from 1.5 to 2.5 mol / L. The impregnated particles are kept in hermetically sealed flasks
until carbonization tests are carried out. The carbonization is carried out in an oven preheated
to an adequate temperature before the experiment starts to obtain equilibrium. Carbonization
is carried out at temperatures varying from 300 to 500 °C. and at times varying from 1 to 3 h.
The coals obtained are cooled to room temperature in desiccators. The active charcoals are

https://biointerfaceresearch.com/                                                            12663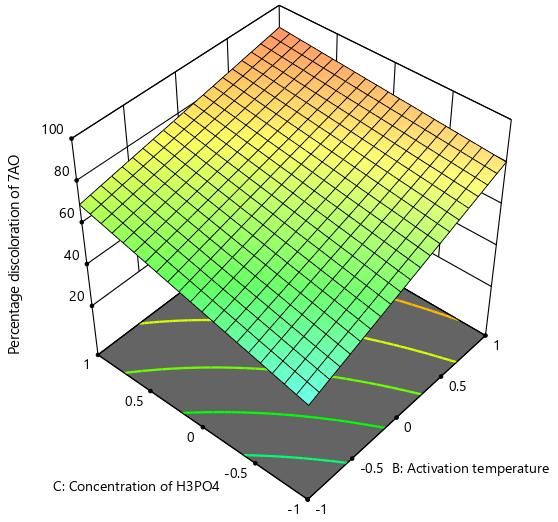
https://doi.org/10.33263/BRIAC115.1266212679
washed in 0.1 M hydrochloric acid solutions to remove any carbonization residues and then
rinsed several times with distilled water to constant pH. The coals thus washed and rinsed are
dried at 105 °C for 24 h in an oven, then cooled in desiccators and stored away from air in
tightly closed flasks until characterization tests.
2.2. Adsorbates.
Two dyes were chosen as the cationic and anionic dye models, MB and AO7,
respectively. Table 1 shows the main characteristics of the used dyes.
Table 1. Some general characteristics of the used dyes [19].
Molecular weight
Dye Chemical structure max (nm)
(g/mol)
Methylene blue 319.86 663
Acid orange 7 350.32 485
The characterization of an activated carbon requires knowledge of its specific surface.
This surface is generally determined by Brunauer, Emmet, and Teller's method, commonly
known as the BET method. In our study, the determination of the specific surface was
calculated using the Langmuir isotherm.
2.3. Batch adsorption study.
The adsorption tests were carried out in batch mode by shaking the dye's synthetic
solutions in the presence of each of the active activated carbon. The solutions studied are
prepared by successive dilutions of the stock solutions until the desired concentrations are
obtained. The residual concentration of each of the dyes was determined using a UV/Visible
spectrophotometer (Jenway 6300). The absorbance was measured after centrifugation at 1500
rpm for 2 min of the solution treated using a centrifuge.
The percent removal (%) of dyes was calculated using the following equation:
C0 − Ct
% Removal dye = ∗ 100 (1)
C0
Where, C0 is the initial dye concentration and Ce (mg/L) is the concentrations of dye at
equilibrium.
The amount of dye adsorption per unit mass of activated carbon at equilibrium, qe
(mg/g) was calculated by the following equation:
https://biointerfaceresearch.com/ 12664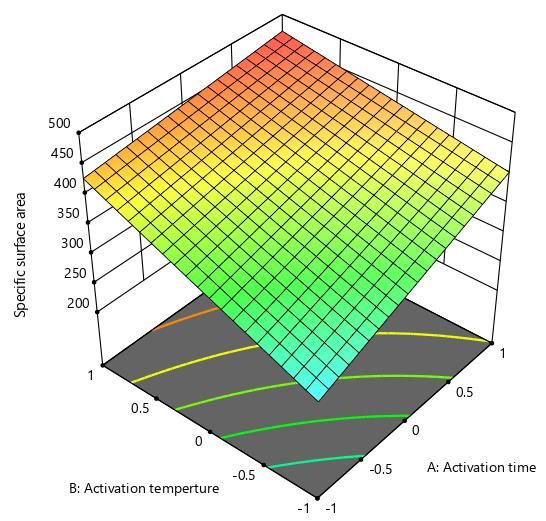
https://doi.org/10.33263/BRIAC115.1266212679
                                       C0 − Ce
                      qe (mg⁄g) =                ∗V                                                       (2)
                                            m
Where, Ce (mg/L) is the liquid concentration of dye at equilibrium, C0 (mg/L) is the initial
concentration of dye in solution. V is the volume of the solution (L) and m is the mass of
optimized activated carbon (g).
       The Langmuir isotherm has been used to determine the specific surface area of
biological and inorganic materials [20,21]. The specific surface area was calculated by the
following equation [22]:
                                            Qmax ∗ AMB ∗N
                                    SMB =                                                                 (3)
                                                 MMB
Where, SMB (m2/g) is the specific surface area; Qmax (mg/g) is the maximum adsorption capacity
(calculated from the Langmuir isotherm); AMB is the occupied surface area of one molecule of
methylene blue = 197.2 Å2 [23]. N is the Avogadro’s number, 6.02 × 10²³ and M is the
molecular weight of MB (373.9 g/mol).

        2.4. Design of experiment by FFD.

        The factorial experimental design was used to optimize the preparation conditions of
Cucumis melo activated carbon and treatment performance in terms of removing cationic (MB)
and anionic (AO7) dye at the same time by adsorption.
        This study chose four factors: the activation time, the activation temperature, the
concentration of activating agent H3PO4, and the contact time. These factors are those which a
priori have a direct influence on the process of preparation of activated carbon. The quality and
effectiveness of our activated carbon prepared from Cucumis melo are determined by the
measurement of the specific surface area and the percentage of elimination of the dyes studied:
MB and AO7. That is to say, in the range of factors studied, an increase in the percentage of
elimination of the dyes studied explains the increase in the quality of the activated carbon
prepared (a large adsorption capacity, a large specific surface, pore development) and vice
versa. The factors studied, accompanied by their range of variation, are given in Table 2.

                  Table 2. Experimental ranges and levels of the factors used in the factorial design.
  Independent variable                           Coded symbol                     Range and level
                                                                             -1                     +1
  Activation time (h)                                  A                      1                      3
  Activation temperature (°C)                          B                    300                     500
  Concentration of H3PO4 (mol/L)                       C                    1.5                     2.5
  Contact time (min)                                   D                    60                      90

3. Results and Discussion

        3.1. Experimental results.

        Our study used a full factorial design model 2n, where 2 represents the number of
variation levels of each parameter and n = 4 the number of these parameters. The main factors
of the full factorial plan (24) with 16 experiments carried out were studied with two levels
chosen from the interval studied, a higher level (+) and a lower level (-). The mathematical
relationship between the response (% R) and the four factors and their interaction were
represented by the following regression equation:

R (%) = X0 + X1 A + X2 B + X3 C + X4 D + X5 AB + X6 AC + X7 AD + X8 BC + X9 BD +
X10 CD + X11 ABC+ X12ABD + X13 ACD +X14 BCD +X15ABCD                          (4)
https://biointerfaceresearch.com/                                                                         12665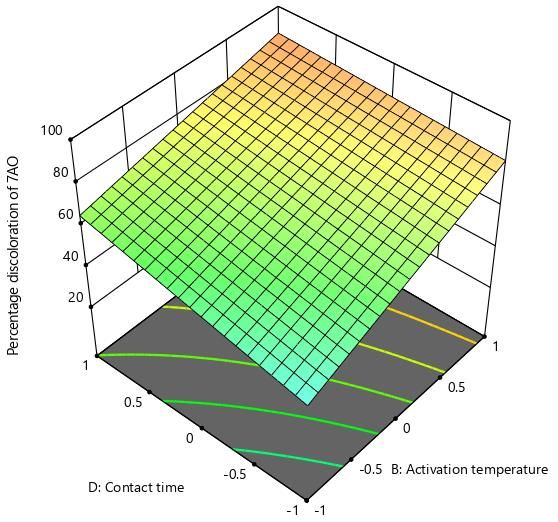
https://doi.org/10.33263/BRIAC115.1266212679

Where, R represents the answer, in our case, it is the specific surface area of activated carbon
and the percentage of elimination of MB and AO7, X0 is the global mean, Xi represents the
other regression coefficients, Xij represents the effects of the interaction between the main
factors and A, B, C, D stands for a time of activation, the temperature of activation, H3PO4
concentration and contact time, respectively.
        The experimental results' processing will also make it possible to develop statistical,
mathematical models giving the adsorption yield and the specific surface under the operating
conditions studied. The coefficients of the main factors, their interactions, and their
contribution percentages in the mathematical model developed are shown in Table 3.

           Table 3. Values of model coefficients and percentage contribution of the three responses.
    Main                 SS (m2/g)                        MB (%)                            AO7 (%)
 coefficients Coefficient     % Contribution Coefficient      % Contribution Coefficient        % Contribution
 X0                 387.8             –            86.02             –             67.94             –
 X1                 49.80           31.74          8.534           37.95           8.921           14.93
 X2                 49.41           31.24          6.713           23.48           15.24           43.58
 X3                 16.50           3.48           4.883           12.42           9.843           18.17
 X4                 30.55           11.95         - 1.924          1.929           6.896           8.923
 X 12              - 16.34          3.41          - 4.781          11.90           0.792           0.117
 X 13              - 14.09          2.54          - 0.215          0.024          - 4.334          3.524
 X 14              - 0.380          0.001         - 0.239          0.029          - 1.467          0.404
 X 23               16.16           3.34           1.518           1.201          - 4.541          3.869
 X 24              - 27.15          9.43          - 1.351          0.950          - 4.130          3.200
 X 34                0.527          0.003         - 1.243          0.805           1.389           0.361
 X 123             - 13.98          2.50          - 3.293          5.651          - 2.988          1.674
 X 124              -0.719          0.006          2.028           2.143          - 1.004          0.189
 X 134             - 0.576          0.004         - 0.364          0.069          - 0.777          0.113
 X 234              1.173           0.01           0.739           0.284          - 1.862          0.650
 X 1234            - 4.841          0.30          - 1.474          1.132           1.201           0.270

        By substituting the regression coefficients obtained in equation (4) by their numerical
values given in Table 3, we obtain equations (5), (6), and (7) describing the specific surface of
the activated carbon prepared and the adsorption efficiency of MB and AO7, respectively:

SS (m2/g) = 387.8 + 49.80 A + 49.41 B + 16.50 C + 30.55 D – 16.34 A*B – 14.09 A*C –0.3803 A*D
+ 16.16 B*C – 27.15 B*D + 0.5274 C*D – 13.98 A*B*C + 0.7198 A*B*D – 0.5766 A*C*D
+ 1.173 B*C*D – 4.841 A*B*C*D                                                              (5)

MB(%)= 86.02 + 8.534 A + 6.713 B + 4.883 C + 1.924 D – 4.781 A*B – 0.2156 A*C – 0.2394 A*D
+ 1.518 B*C – 1.351 B*D – 1.243 C*D – 3.293 A*B*C + 2.028 A*B*D – 0.3644 A*C*D
+ 0.7394 B*C*D – 1.474 A*B*C*D                                                         (6)

AO7 (%)= 67.94 + 8.921 A + 15.24 B + 9.843 C + 6.896 D + 0.7925 A*B – 4.334 A*C – 1.467 A*D
- 4.541 B*C- 4.130 B*D+ 1.389 C*D- 2.988 A*B*C - 1.004 A*B*D - 0.7775 A*C*D - 1.862 B*C*D
+ 1.201 A*B*C*D                                                                         (7)

          3.2. Process optimization.

        The preparation conditions and the experimental results of the three responses, the
specific surface area of the activated carbon prepared, and the percentage of discoloration of
MB and AO7 are illustrated in Table 4.

https://biointerfaceresearch.com/                                                                    12666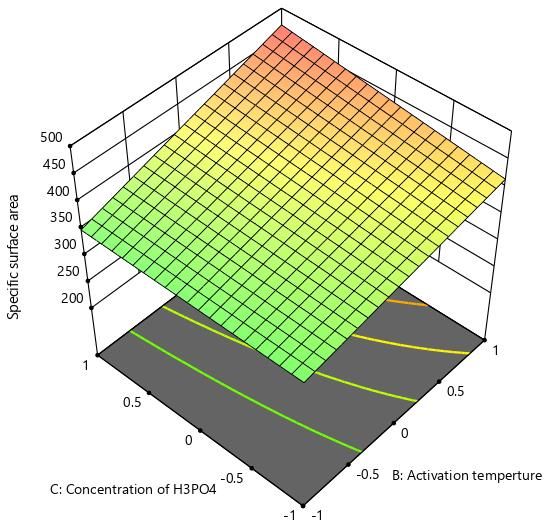
https://doi.org/10.33263/BRIAC115.1266212679

 Table 4. Factorial design matrix of four variables and experimental and predicted responses for SS, MB, and
                                                     AO7.
 Run No              Coded values of independent variables                   Responses (%)
                A            B           C           D        SS (m2/g)        MB (%)           AO7 (%)
 1              -1           -1          -1          -1         208.1           57.07            22.58
 2              +1           -1          -1          -1         351.3            84.3            38.5
 3              -1           +1          -1          -1         347.            81.62            54.71
 4              +1           +1          -1          -1         458.6           88.89            94.57
 5              -1           -1          +1          -1         218.8           63.83            43.58
 6              +1           -1          +1          -1         344.5           98.93            62.03
 7              -1           +1          +1          -1         454.3           98.77            81.75
 8              +1           +1          +1          -1         475.2           99.36            90.63
 9              -1           -1          -1          +1         335.5           74.34            35.1
 10             +1           -1          -1          +1         457.3           88.06            57.08
 11             -1           +1          -1          +1         338.9           76.52            66.98
 12             +1           +1          -1          +1         473.5            98.3            95.26
 13             -1           -1          +1          +1         326.6           68.73            77.02
 14             +1           -1          +1          +1         464.9            99.2            85.7
 15             -1           +1          +1          +1         474.6           99.01            90.43
 16             +1           +1          +1          +1         475.3            99.4            91.12

        According to this table, it can be seen that the specific surface area of the activated
carbon prepared varies between 208.1 m2/g to 475.3 m2/g, as well as the percentage of
elimination varies between 57.07% to 99.4% for MB and between 22.58% to 95.26% for the
AO7. These large variations in the percentage of elimination and the specific surface area
confirm the significant influence of activation time, activation temperature, the concentration
of H3PO4 activating agent, and the contact time on the quality of the specific surface area of
the activated carbon prepares and consequently on the dye adsorption process.
        The specific surface area and the porosities developed during the activation process
allow the elimination of MB and AO7. Ineffective coals are those which have a relatively small
specific surface and very few surface functions. According to these results, we see that our
activated carbon prepares for test number 16 and 12 for the discoloration of MB and AO7,
respectively, were having a large specific surface and a significant adsorption capacity
compared to other activated carbon.

          3.3. Statistical analysis.

       In this study, to assess the importance of the regression model and find the relationship
between the factors and the responses, an analysis of variance (ANOVA) was applied at a
confidence level of 95% (p  0.05 are considered statistically insignificant, while those with P-
values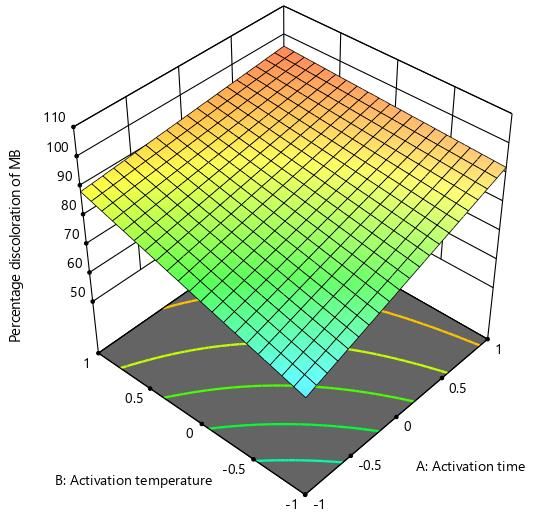
https://doi.org/10.33263/BRIAC115.1266212679

interaction between the activation temperature and the concentration of H3PO4 (BC) are
positive. Therefore, these factors positively influence the quality of the specific surface area of
the activated carbon prepared. The other remaining interactions (AB, AC, BD, and ABC) have
negative coefficients (Eq. (8), Table 5). Therefore, their influence on the specific surface area
is negative; that is to say, an increase in these interactions leads to a decrease in the activated
carbon's specific surface area.

SS (m2/g)= 387.81 + 49.8 A +49.41 B + 16.5 C + 30.55 D – 16.34 AB – 14.09 AC + 16.16 BC –
27.15 BD – 13.98ABC                                                                       (8)

                               Table 5. Analysis of variance of specific surface area.
                                     Sum of
            Source                                 df      Mean Square        F-value      P-value     Prob> F
                                    Squares
 Model                             1.246E+05        9         13841.38        198.98       < 0.0001    significant
 A-Time of activation               39679.82        1         39679.82        570.44       < 0.0001
 B-Temperature of activation        39054.05        1         39054.05        561.44       < 0.0001
 C- H3PO4 Concentration              4357.66        1          4357.66        62.65         0.0002
 D- Contact time                    14937.71        1         14937.71        214.74       < 0.0001
 AB                                  4271.14        1          4271.14        61.40         0.0002
 AC                                  3176.96        1          3176.96        45.67         0.0005
 BC                                  4179.29        1          4179.29        60.08         0.0002
 BD                                 11789.80        1         11789.80        169.49       < 0.0001
 ABC                                 3125.99        1          3125.99        44.94         0.0005
 Residual                            417.36         6           69.56
 Cor Total                         1.250E+05       15

          3.3.2. Methylene blue (MB).

        According to the analysis of variance ANOVA for the response of the adsorption
efficiency of MB, it can be concluded that the most significant factors are: activation time (A),
activation temperature (B), and the concentration of the activating agent H3PO4 (C) and the
interaction between the activation time (A) and the activation temperature (B) (Eq. (9), Table
6).

MB (%) = 86.02 + 8.53 A + 6.71 B + 4.88 C– 4.78 AB                                                             (9)

                                       Table 6. Analysis of variance of MB.
 Source                              Sum of         df        Mean         F-value       P-value      Prob> F
                                     Squares                 Square
 Model                               2633.61         4       658.40         16.59        0.0001       significant
 A-Time of activation                1165.37         1       1165.37        29.36        0.0002
 B-Temperature of activation          721.06         1       721.06         18.16        0.0013
 C- H3PO4 Concentration               381.52         1       381.52         9.61         0.0101
 AB                                   365.67         1       365.67         9.21         0.0113
 Residual                             436.68        11        39.70
 Cor Total                           3070.29        15

          3.3.3. Acid orange 7 (AO7).

      Similarly, according to the analysis of variance ANOVA of the adsorption efficiency
of AO7, the significant effects are the four factors A, B, C, and D and their interaction AC, BC,
and BD (Eq. (10), Table 7).

AO7 (%) = 67.94 + 8.92 A + 15.24 B + 9.84 C + 6.90 D – 4.33 AC - 4. 54 BC – 4.13 BD                            (10)

https://biointerfaceresearch.com/                                                                         12668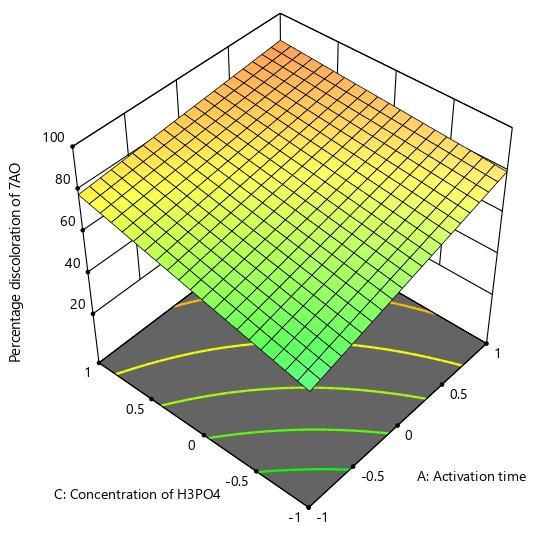
https://doi.org/10.33263/BRIAC115.1266212679

                                     Table 7. Analysis of variance of AO7.
                                    Sum of                  Mean
            Source                                df                    F-value       P-value     Prob> F
                                    Squares                Square
 Model                              8204.46        7       1172.07       29.07        < 0.0001   significant
 A-Time of activation               1273.42        1       1273.42       31.58         0.0005
 B-Temperature of activation        3716.73        1       3716.73       92.18        < 0.0001
 C- H3PO4Concentration              1550.00        1       1550.00       38.44         0.0003
 D- Contact time                     760.93        1       760.93        18.87         0.0025
 AC                                  300.50        1       300.50        7.45          0.0258
 BC                                  329.97        1       329.97        8.18          0.0211
 BD                                  272.91        1       272.91        6.77          0.0315
 Residual                            322.55        8        40.32
 Cor Total                          8527.01       15

         3.4. Diagnostic model.

        In order to test the quality of the fit of the model, statistical data such as F-value, P-
value, coefficient of correlation (R2), adjusted R2, coefficients of variance (CV), and adequate
precision were examined. A P-value of less than 0.05 demonstrates the factor effect's statistical
significance (at a 95% confidence level). According to the results of the analysis of variance
ANOVA (Table 5-7), the F values of the model with a very low probability value (p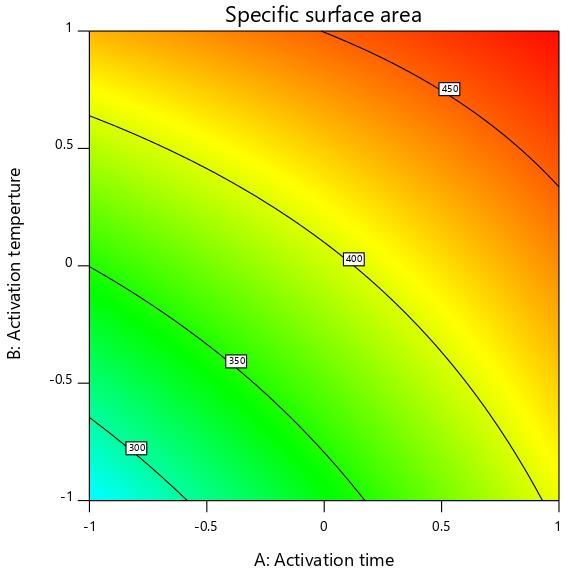
https://doi.org/10.33263/BRIAC115.1266212679

                      Figure 1. Actual versus predicted data of (a) SS; (b) MB; (c) AO7.

  a                                                        b

                              c

        3.5. Adequacy of prediction models.

        Adequate accuracy measures the signal-to-noise ratio and compares the range of values
predicted at design points to the average prediction error. A ratio greater than 4 is desirable and
indicates adequate model discrimination. In the present study, the adequate and higher
precision value of the order of 40.12, 11.43, and 18.22 for SS, MB, and AO7, respectively,
show a good agreement on the experiments' reliability performed [29].
        The results in Table 9 allow a more precise assessment of the quality of the adjustment
made. The comparison between the columns Robserved (measured responses) and RPredicted
(responses predicted by the model) confirms that the fit is good. The adjusted (predicted) values
are included in the respective confidence intervals (CI), which validates the experimental
design model with linear regression coefficients R² of 99.67%, 85.78% and 96.22% for SS,
MB, and AO7, respectively.

https://biointerfaceresearch.com/                                                                  12670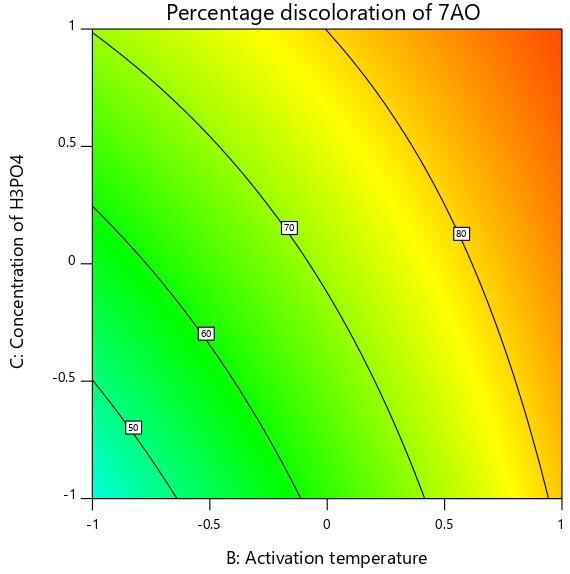
https://doi.org/10.33263/BRIAC115.1266212679

      (a)

   (b)

   (c)

Figure 2. (a) Main effects plot on the specific surface area; the percentage of discoloration of (b) MB; (c) AO7.

 Table 9. Factorial design matrix of four variables and experimental and predicted responses for SS, MB, and
                                                     AO7.
Run                 SS (m2/g)                          MB (%)                              AO7 (%)
No       Observed   Predicted   Residual   Observed    Predicted    Residual   Observed    Predicted    Residual
 1        208.1       214.1       -6.01     57.07        61.11        -4.04     22.58        14.03        8.55
 2        351.3       346.6        4.72      84.3        87.74        -3.44     38.50        40.54       -2.04
 3         347.       339.6        7.46     81.62        84.10        -2.48     54.71        61.86       -7.15
 4        458.6       462.6       -4.72     88.89        91.60        -2.71     94.57        88.37        6.20
 5        218.8        215         3.81     63.83        70.88        -7.05     43.58        51.47       -7.89
 6        344.5        347        -2.52     98.93        97.51         1.42     62.03        60.64        1.39
 7        454.3        461        -6.78     98.77        93.86         4.91     81.75        81.13        0.62
 8        475.2       471.2        3.38     99.36        101.3        -2.01     90.63        90.30        0.33
 9        335.5       329.5        6.01     74.34        61.11       13.23      35.10        36.09       -0.98

https://biointerfaceresearch.com/                                                                       12671
https://doi.org/10.33263/BRIAC115.1266212679
Run SS (m2/g) MB (%) AO7 (%)
No Observed Predicted Residual Observed Predicted Residual Observed Predicted Residual
10 457.3 462.02 -4.72 88.06 87.74 0.32 57.08 62.60 -5.52
11 338.9 346.4 -7.46 76.52 84.10 -7.58 66.98 67.39 -0.41
12 473.5 469.4 4.06 98.30 91.60 6.70 95.26 93.90 1.36
13 326.6 330.4 -3.81 68.73 70.88 -2.15 77.02 73.52 3.50
14 464.9 462.3 2.52 99.20 97.51 1.69 85.70 82.70 3.00
15 474.6 467.9 6.78 99.01 93.86 5.15 90.43 86.66 3.77
16 475.3 478.7 -3.38 99.40 101.37 -1.97 91.12 95.84 -4.72
3.6. Effects of the main factors.
The preparation of high quality activated carbon was evaluated based on high values of
the specific surface area and the percentage of discoloration (%) of MB and AO7. Figures 2a-
c show the effect of each factor on the response. These figures show that the activation
temperature and the activation time have the greatest influence on the percentage of
discoloration of MB and AO7 and on the specific surface area of the activated carbon prepared,
followed by the activating agent's concentration. However, the contact time does not affect the
percentage of discoloration of MB. The increase in the activation temperature from 300 ° C to
500 ° C leads to an opening and a widening of the pores, which increases the specific surface
and the adsorption efficiency of MB and AO7 on the activated carbon prepared [30].
Indeed, when the activation time varies between 1 to 3 h, the microporosity increases,
which gives activated carbon a better percentage of discoloration of MB and AO7 due to better
development of their porosity and their specific surface areas. In the same way, it can be
deduced that the concentration of H3PO4 has a significant influence on the percentage of
discoloration of AO7, while an increase in the concentration of the activating agent H3PO4
from 1.5 M to 2.5 M promotes the development of pores on the surface of prepared activated
carbon. However, chemical activation with H3PO4 made it possible to obtain activated carbon
with a well-developed mesoporosity, which is favorable for adsorbing larger molecules such
as MB and AO7.
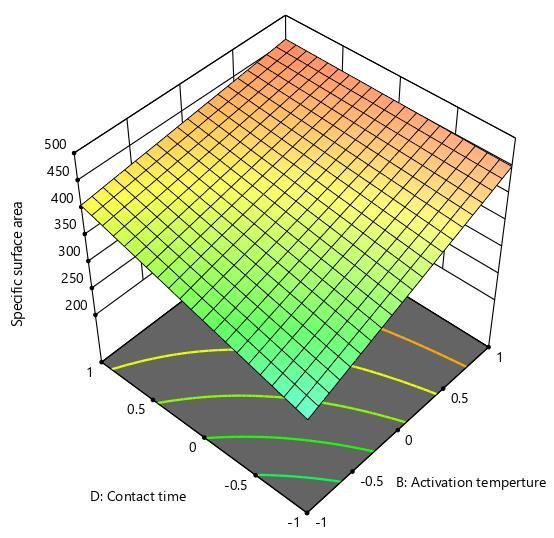
3.7. 3D surfaces and 2D contour plots.
To assess the effects of variables, the 3D surfaces and 2D contour plots are
demonstrated for a function of two factors. This representation shows the relative effects of
any two variables when the remaining variables are kept constant. Figures 3 and 4 show the
plots of the three-dimensional response surfaces (3D) and the contour curves (2D) constructed
to present the significant interactions. According to these figures, we notice on the surfaces
response (a,b) and the contour curves (c,d) of Figure 3, that the best specific surface area (475.3
m2/g) and percentage discoloration of AO7 (95.26%) are obtained when working with
maximum values of A*C, B*C and B*D.
Similarly, by analyzing Figure 4 (e,f) of the MB, it can be deduced that the activation
time and the activation temperature have an important influence on the percentage
discoloration of the MB with a percentage discoloration of 99.4%.
https://biointerfaceresearch.com/ 12672https://doi.org/10.33263/BRIAC115.1266212679
a b
https://biointerfaceresearch.com/ 12673https://doi.org/10.33263/BRIAC115.1266212679
c d
https://biointerfaceresearch.com/ 12674https://doi.org/10.33263/BRIAC115.1266212679
Figure 3. Surface response and contour plots for (a,b) specific surface area; (c,d) AO7.
e f
Figure 4. Surface response and contour plots for the (a,b) MB.
https://biointerfaceresearch.com/ 12675https://doi.org/10.33263/BRIAC115.1266212679
3.8. Characterization of optimized AC.
3.8.1. FTIR analysis.
Fourier-transform infrared spectroscopy (FTIR) analysis was applied to determine the
functional groups present on the prepared activated carbon surface and understand the
adsorption mechanism [31]. The infrared spectrum has been recorded from 400 to 4000 cm-1
is represented in Figure 5. The analysis of these spectra makes it possible to cite the following
characteristic bands. A wide absorption band was observed at 3410 cm-1 and 3408 cm-1
correspondingly to the hydroxyl groups' elongation. This band indicates the presence of
carboxyl groups, phenols, or alcohols linked to water adsorbed on the surface of activated
carbon [32]. The bands observed at 2922 cm-1 and 2852 cm-1 are absorption bands attributed
to the asymmetric and symmetrical valence vibration of the –CH3 and CH2 groups. A band
around 1300 -1000 cm-1 corresponds to the C– O bond of phenols, carboxylic acids, and esters
or the P = O bond of ester phosphates, or the O – C bond of P – O – C [33]. This band is also
characteristic of phosphorus and phosphocarbon compounds present in activated carbon
achieving by phosphoric acid. The spectrum also shows a peak at 520 cm-1 that could be
attributed to the P-O stretching vibration and/or aromatic structures. This indicates that these
functional groups could act as active sites for interaction with dye molecules [34].
Figure 5. FT-IR spectra of Cucumis melo activated carbon.
3.8.2. SEM analysis.
Figure 6 presents an SEM image before and after adsorption. This image clearly shows
a wide distribution of pores of different shapes and sizes before adsorption (Figure 6a).
However, the SEM image analysis in Figure 6b shows that the activated carbon's surface is
much more homogeneous and saturated after adsorption. This means that there is a filling of
the pores and active sites by the dye's adsorption on the prepared activated carbon's surface.
https://biointerfaceresearch.com/ 12676https://doi.org/10.33263/BRIAC115.1266212679
a b
Figure 6. Scanning electron microscopic images of Cucumis melo activated carbon before and after adsorption.
4. Conclusions
In this study, activated carbon with a large specific surface area and a high removal
efficiency of dye were prepared from Cucumis melo using H3PO4 as an activating agent. The
conditions for preparing activated carbon by chemical activation were first optimized using a
full factorial design with four factors: the activation time, the activation temperature, the
concentration of H3PO4, and the contact time. The influence of the different factors on the yield
and the adsorption capacity measured by the specific surface area and of the percentage of
discoloration of MB and AO7 could be modeled satisfactorily.
The best result of specific surface area and MB is 475.3 m2/g and 99.4%, respectively,
were found at optimum process conditions, i.e., activation time (3h), activation temperature
(500 °C), H3PO4 concentration (2.5 mol/L), and Contact time (90 min). However, the best value
for the percentage of discoloration of AO7 (95.26%) was identified at an activation time of 3h,
an activation temperature of 500 °C, and an H3PO4 concentration of 1.5 mol/L with 90 min
contact time.
Funding
This research received no external funding
Acknowledgments
The authors are grateful who have participated in this research work.
Conflicts of Interest
The authors declare no conflict of interest.
References
1. Anuar, F.I.; Hadibarata, T.; Syafrudin, M.; Fona, Z. Removal of Procion Red MX- 5B from aqueous solution
by adsorption on Parkia speciosa (stink bean) peel powder. Biointerface Res. Appl. Chem. 2020, 10, 4774–
4779, https://doi.org/10.33263/BRIAC101.774779.
2. Abdulhameeda, A.S.; Mohammada, A.-T.; Jawadb, A.H. Modeling and mechanism of reactive orange 16 dye
adsorption by chitosan-glyoxal/TiO2 nanocomposite: application of response surface methodology.
Desalination and. Water Treatment 2019, 164, 346-360, https://doi.org/10.5004/dwt.2019.24384.
https://biointerfaceresearch.com/ 12677https://doi.org/10.33263/BRIAC115.1266212679
3. Katheresan, V.; Kansedo, J.; Lau, S.Y. Efficiency of various recent wastewater dye removal methods: A
review. Journal of Environmental Chemical Engineering 2018, 6, 4676-4697,
https://doi.org/10.1016/j.jece.2018.06.060.
4. Achary, P.G.R.; Ghosh, M.R.; Mishra, S.P. Insights into the modeling and application of some low cost
adsorbents towards Cr(VI) adsorption. Materials Today: Proceedings 2020, 30, 267-273,
https://doi.org/10.1016/j.matpr.2020.01.433.
5. Choi, H.-J.; Yu, S.-W. Biosorption of methylene blue from aqueous solution by agricultural bioadsorbent
corncob. Environmental Engineering Research 2019, 24, 99-106, https://doi.org/10.4491/eer.2018.107.
6. El Kassimi, A.; Boutouil, A.; El Himri, M.; Rachid Laamari, M.; El Haddad, M. Selective and competitive
removal of three basic dyes from single, binary and ternary systems in aqueous solutions: A combined
experimental and theoretical study. Journal of Saudi Chemical Society 2020, 24, 527-544,
https://doi.org/10.1016/j.jscs.2020.05.005.
7. Kristanti, R.A.; Hadibarata, T.; Al Qahtani, H.M.A. Adsorption of bisphenol A on oil palm biomass activated
carbon: characterization, isotherm, kinetic and thermodynamic studies. Biointerface Research in Applied
Chemistry 2019, 9, 4217-4224, https://doi.org/10.33263/BRIAC95.217224.
8. Shabaan, O.A.; Jahin, H.S.; Mohamed, G.G. Removal of anionic and cationic dyes from wastewater by
adsorption using multiwall carbon nanotubes. Arabian Journal of Chemistry 2020, 13, 4797-4810,
https://doi.org/10.1016/j.arabjc.2020.01.010.
9. Kanthasamy, S.; Hadibarata, T.; Hidayat, T.; Alamri, S.A.; Ahmed al-Ghamdi, A. Adsorption of azo and
anthraquinone dye by using watermelon peel powder and corn peel powder: Equilibrium and kinetic studies.
Biointerface Res. Appl. Chem. 2020, 10, 4706–4713, https://doi.org/10.33263/BRIAC101.706713.
10. Kuang, Y.; Zhang, X.; Zhou, S. Adsorption of methylene blue in water onto activated carbon by surfactant
modification. Water 2020, 12, 587, https://doi.org/10.3390/w12020587.
11. Saleem, J.; Shahid, U.B.; Hijab, M.; Mackey, H.; McKay, G. Production and applications of activated carbons
as adsorbents from olive stones. Biomass Conversion and Biorefinery 2019, 9, 775-802,
https://doi.org/10.1007/s13399-019-00473-7.
12. Ani, J.U.; Akpomie, K.G.; Okoro, U.C.; Aneke, L.E.; Onukwuli, O.D.; Ujam, O.T. Potentials of activated
carbon produced from biomass materials for sequestration of dyes, heavy metals, and crude oil components
from aqueous environment. Applied Water Science 2020, 10, 69, https://doi.org/10.1007/s13201-020-1149-
8.
13. Heidarinejad, Z.; Dehghani, M.H.; Heidari, M.; Javedan, G.; Ali, P.I.; Sillanpää, M. Methods for preparation
and activation of activated carbon: a review. Environ. Chem. Lett. 2020, 18, 1-23,
https://doi.org/10.1007/s10311-019-00955-0.
14. Aziz, E.K.; Abdelmajid, R.; Rachid, L.M.; Mohammadine, E.H. Adsorptive removal of anionic dye from
aqueous solutions using powdered and calcined vegetables wastes as low-cost adsorbent. Arab Journal of
Basic and Applied Sciences 2018, 25, 93-102, https://doi.org/10.1080/25765299.2018.1517861.
15. Jawad, A.H.; Rashid, R.A.; Ishak, M.A.M.; Ismail, K. Adsorptive removal of methylene blue by chemically
treated cellulosic waste banana (Musa sapientum) peels. Journal of Taibah University for Science 2018, 12,
809-819, https://doi.org/10.1080/16583655.2018.1519893.
16. Moughaoui, F. ; Ouaket, A. ; Laaraibi, A. ; Hamdouch, S. ; Anbaoui, Z. ; Abourriche, A.; Berrada, M. A
novel approach for producing low cost and highly efficient activated carbon for removing cationic dyes.
Mediterranean Journal of Chemistry., 2019, 8(2), 74-83, http://dx.doi.org/10.13171/mjc8219040103fm.
17. Regti, A.; El Kassimi, A.; Laamari, M.R.; El Haddad, M. Competitive adsorption and optimization of binary
mixture of textile dyes: A factorial design analysis. Journal of the Association of Arab Universities for Basic
and Applied Sciences 2017, 24, 1-9, https://doi.org/10.1016/j.jaubas.2016.07.005.
18. Regti, A.; Laamari, M.R.; Stiriba, S.-E.; El Haddad, M. Use of response factorial design for process
optimization of basic dye adsorption onto activated carbon derived from Persea species. Microchem. J. 2017,
130, 129-136, https://doi.org/10.1016/j.microc.2016.08.012.
19. Nadir, I.; Achour, Y.; El Kassimi, A.; El Himri, M.; Laamari, M.R.; El Haddad, M. Removal of Antibiotic
Sulfamethazine from Aqueous Media. Physical Chemistry Research 2021, 9, 165-180,
https://doi.org/10.22036/pcr.2020.249992.1839.
20. Garba, Z.; Rahim, A.; Hamza, S. Potential of Borassus aethiopum shells as precursor for activated carbon
preparation by physico-chemical activation; Optimization, equilibrium and kinetic studies. Journal of
Environmental Chemical Engineering 2014, 2, https://doi.org/10.1016/j.jece.2014.07.010.
https://biointerfaceresearch.com/ 12678https://doi.org/10.33263/BRIAC115.1266212679
21. Badri, N.; Chhiti, Y.; Bentiss, F.; Bensitel, M. Removal of cationic dye by high surface activated carbon
prepared from biomass (date pits) by carbonization and activation processes. Moroccan Journal of Chemistry
2018, 6, 6-4.
22. Asfour, H.M.; Fadali, O.A.; Nassar, M.M.; El-Geundi, M.S. Equilibrium studies on adsorption of basic dyes
on hardwood. Journal of Chemical Technology and Biotechnology. Chemical Technology 1985, 35, 21-27,
https://doi.org/10.1002/jctb.5040350105.
23. Langmuir, I. The constitution and fundamental properties of solids and liquids. Part I. Solids. J. Am. Chem.
Soc. 1916, 38, 2221-2295, https://doi.org/10.1021/ja02268a002.
24. Pourabadeh, A.; Baharinikoo, L.; Nouri, A.; Mehdizadeh, B.; Shojaei, S. The optimisation of operating
parameters of dye removal: application of designs of experiments. Int. J. Environ. Anal. Chem. 2019, 1-10,
https://doi.org/10.1080/03067319.2019.1680657.
25. Parsaeian, M.R.; Dadfarnia, S.; Haji Shabani, A.M.; Hafezi Moghaddam, R. Green synthesis of a high
capacity magnetic polymer nanocomposite sorbent based on the natural products for removal of Reactive
Black 5. Int. J. Environ. Anal. Chem. 2020, 1-15, https://doi.org/10.1080/03067319.2020.1748612.
26. Satapathy, M.K.; Das, P. Optimization of crystal violet dye removal using novel soil-silver nanocomposite
as nanoadsorbent using response surface methodology. Journal of Environmental Chemical Engineering
2014, 2, 708-714, https://doi.org/10.1016/j.jece.2013.11.012.
27. Bagheri, A.R.; Ghaedi, M.; Hajati, S.; Ghaedi, A.M.; Goudarzi, A.; Asfaram, A. Random forest model for
the ultrasonic-assisted removal of chrysoidine G by copper sulfide nanoparticles loaded on activated carbon;
response surface methodology approach. RSC Advances 2015, 5, 59335-59343,
https://doi.org/10.1039/C5RA08399K.
28. Mazaheri, H.; Ghaedi, M.; Asfaram, A.; Hajati, S. Performance of CuS nanoparticle loaded on activated
carbon in the adsorption of methylene blue and bromophenol blue dyes in binary aqueous solutions: Using
ultrasound power and optimization by central composite design. J. Mol. Liq. 2016, 219, 667-676,
https://doi.org/10.1016/j.molliq.2016.03.050.
29. Ghaedi, M.; Rozkhoosh, Z.; Asfaram, A.; Mirtamizdoust, B.; Mahmoudi, Z.; Bazrafshan, A.A. Comparative
studies on removal of Erythrosine using ZnS and AgOH nanoparticles loaded on activated carbon as
adsorbents: Kinetic and isotherm studies of adsorption. Spectrochimica Acta Part A: Molecular and
Biomolecular Spectroscopy 2015, 138, 176-186, https://doi.org/10.1016/j.saa.2014.10.046.
30. Tan, I.A.W.; Ahmad, A.L.; Hameed, B.H. Preparation of activated carbon from coconut husk: Optimization
study on removal of 2,4,6-trichlorophenol using response surface methodology. J. Hazard. Mater. 2008, 153,
709-717, https://doi.org/10.1016/j.jhazmat.2007.09.014.
31. Oyekanmi, A.A.; Ahmad, A.; Hossain, K.; Rafatullah, M. Adsorption of Rhodamine B dye from aqueous
solution onto acid treated banana peel: Response surface methodology, kinetics and isotherm studies. PLoS
One 2019, 14, e0216878, https://doi.org/10.1371/journal.pone.0216878.
32. Liang, S.; Guo, X.; Tian, Q. Adsorption of Pb2+ and Zn2+ from aqueous solutions by sulfured orange peel.
Desalination 2011, 275, 212-216, https://doi.org/10.1016/j.desal.2011.03.001.
33. Puziy, A.M.; Poddubnaya, O.I.; Martínez-Alonso, A.; Suárez-García, F.; Tascón, J.M.D. Surface chemistry
of phosphorus-containing carbons of lignocellulosic origin. Carbon 2005, 43, 2857-2868,
https://doi.org/10.1016/j.carbon.2005.06.014.
34. Karimi Darvanjooghi, M.H.; Davoodi, S.M.; Dursun, A.Y.; Ehsani, M.R.; Karimpour, I.; Ameri, E.
Application of treated eggplant peel as a low-cost adsorbent for water treatment toward elimination of Pb2+:
Kinetic modeling and isotherm study. Adsorption Science & Technology 2018, 36, 1112-1143,
https://doi.org/10.1177/0263617417753784.
https://biointerfaceresearch.com/ 12679You can also read


