Product Validation Report (PVR) Deliverable D-5 - Eumetsat
←
→
Page content transcription
If your browser does not render page correctly, please read the page content below
S3 Altimetry GPD + Wet Tropospheric Correction (GPD4S3)

 Product Validation Report (PVR)

 Deliverable D-5

Doc. No. : UPorto/FCUP/GPD4S3/PH1/PVR
Issue : 4.1
Date : 11/03/2022
Note: The electronic GPD4S3 products delivered under this activity are Copyright European
Commission year 2021
Technical Proposal - RFQ 221050

Contents
List of Figures .......................................................................................................................................... 4
List of Tables ........................................................................................................................................... 9
1. Introduction ................................................................................................................................... 10
 1.1. Purpose and Scope .............................................................................................................. 10
 1.2. Overview of the document ................................................................................................... 10
 1.3. Applicable documents .......................................................................................................... 11
 1.4. Reference documents .......................................................................................................... 11
 1.5. Abbreviations ....................................................................................................................... 12

2. Background information ................................................................................................................ 15
3. Input and validation datasets ........................................................................................................ 17
 3.1. Sentinel-3 products .............................................................................................................. 18
 3.2. Reference altimeter missions ............................................................................................... 19
 3.3. Scanning imaging radiometers ............................................................................................ 19
 3.4. GNSS data ........................................................................................................................... 20
 3.5. ERA5 model ......................................................................................................................... 21
 3.6. ‘a la CryoSat’ GPD+ WTC versions ..................................................................................... 21

4. Data pre-processing...................................................................................................................... 21
 4.1. Assessment of the four MWR-derived WTC present in S3 products ................................... 21
 4.2. MWR rejection flag ............................................................................................................... 24
 4.3. GNSS data quality assessment ........................................................................................... 28
 4.4. Radiometer calibration ......................................................................................................... 31
 4.4.1. Adjustment model ........................................................................................................ 31
 4.4.2. Step 0 – Comparison between ERA5 and the various radiometers ............................ 32
 4.4.3. Step 1 – Adjustment of TP, J1, J2 and J3 to FXX ....................................................... 35
 4.4.4. Step 2 – Adjustment of NOAA CLASS products to TP, J1, J2 and J3 ........................ 36
 4.4.5. Step 3 – Adjustment of S3A and S3B to J3 ................................................................ 37
 4.5. Direct comparison between S3A/S3B and GMI ................................................................... 38

5. GPD+ products assessment and validation.................................................................................. 40
 5.1. Assessment and validation objectives ................................................................................. 40
 5.2. Comparison with various WTC datasets. ............................................................................. 40
 5.2.1. Data Completeness and data Recovery ..................................................................... 40
 5.2.2. GPD+ Source Flag ...................................................................................................... 43
 5.2.3. Examples of S3 passes illustrative of the GPD+ WTC ............................................... 48
 5.2.4. Comparison with models and ‘a la CryoSat’ GPD+ .................................................... 53
 5.2.5. Comparison with GNSS .............................................................................................. 54
 5.3. SLA variance and Crossover RMS analyses ....................................................................... 56
 5.3.1. SLA variance analysis ................................................................................................. 56
 5.3.2. Crossover RMS analyses ............................................................................................ 59

6. Task 5 – Use of the new AIRWAVE-SLSTR Level-2 Total Column Water Vapour
(TCWV) test products to better characterize the water vapour (WV) variability in coastal
areas and compare the performances of the different products. .......................................................... 63

 2
Technical Proposal - RFQ 221050

 6.1. AIRWAVE dataset description ............................................................................................. 64
 6.2. Assessment of the TCWV retrieval from AIRWAVE-SLSTR ............................................... 66
 6.2.1. Comparison with model ............................................................................................... 69
 6.2.2. Comparison with MWR on board S3A......................................................................... 71
 6.2.3. Comparison with GNSS .............................................................................................. 73
 6.3. Summary and outcomes for AIRWAVE ............................................................................... 74

7. Task 4 – Assessment of the performance of the Altimeter 1DVAR Tropospheric
Correction (AMTROC) ........................................................................................................................... 75
 7.1. AMTROC dataset description .............................................................................................. 75
 7.2. Assessment of the WTC retrieval from 1DVAR ................................................................... 75
 7.2.1. Comparison with model ............................................................................................... 76
 7.2.2. Comparison with the MWR on board S3A .................................................................. 78
 7.2.3. Comparison with GPD+ ............................................................................................... 80
 7.2.4. Comparison with GNSS .............................................................................................. 84
 7.3. Summary and outcomes for AMTROC ................................................................................ 85

8. Summary and conclusions ............................................................................................................ 85
9. Compliance with the verification validation requirements ............................................................. 87

 3
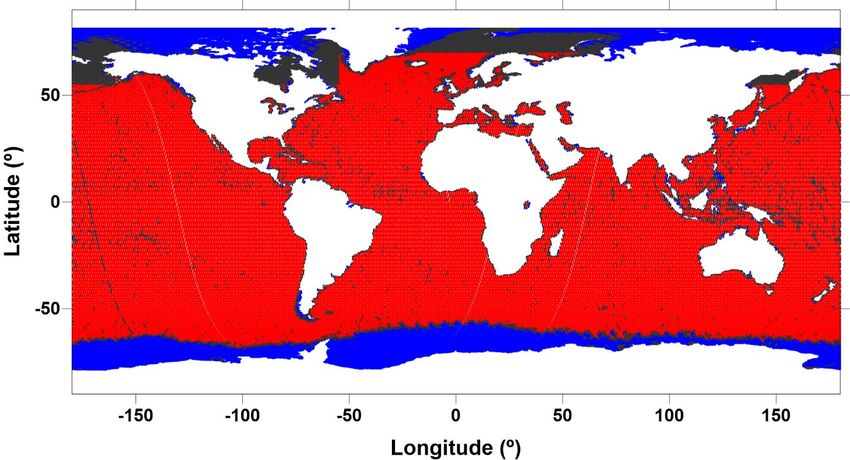
Technical Proposal - RFQ 221050

List of Figures

Figure 1: Location of the GNSS stations used in the computation of the GPD+ WTC for S3A and S3B
for the period spanning the years 2016-2021. Total number of stations: 1445; stations with distance from
coast less than 100 km (black dots): 754; stations with distance from coast larger than 100 km (pink
dots): 691. Background colour represents the WPD standard deviation (in cm) computed from two years
of data from the ERA5 model. ............................................................................................................... 20

Figure 2: SLA variance difference (%) between MWR_SAR3 and ECMWF (blue) and between
MWR_PLRM3 and ECMWF (green). Details on how these differences are computed are given in the
main text. ............................................................................................................................................... 22

Figure 3: RMS difference at crossovers (%) between MWR_SAR3 and ECMWF (blue) and between
MWR_PLRM3 and ECMWF (green). Details on how these differences are computed are given in the
main text. ............................................................................................................................................... 23

Figure 4: SLA variance difference (%) between MWR_SAR3 and ECMWF (blue) and between
MWR_SAR5 and ECMWF (orange). ..................................................................................................... 23

Figure 5: Xovers RMS difference (%) between MWR_SAR3 and ECMWF (blue) and between
MWR_SAR5 and ECMWF (orange). ..................................................................................................... 24

Figure 6: Points for which the MWR_Rej flag has been set for S3A cycle 14, during winter in the Northern
Hemisphere. Dark green points: criteria related to land contamination based on flags; light green
points: additional criteria based on land proximity; blue points; ice contamination; pink points: outliers
and additional statistical criteria. ........................................................................................................... 26

Figure 7: Same as on Figure 6, for S3A cycle 51, during summer in the Northern Hemisphere. ........ 26

Figure 8: Same as on Figure 6, for S3B cycle 32, during summer in the Northern Hemisphere and for
approximately the same period of S3A cycle 51 shown on Figure 7. ................................................... 27

Figure 9: Alternative representation of the MWR_Rej flag for S3A cycle 51. Now the coloured points
represent values based on the product flags present in Table 4: rain flag (pink); ice flag (cyan);
remaining product flags, mainly related to land (green). The grey points are rejected based on the
additional statistical criteria.................................................................................................................... 28

Figure 10: Same as on Figure 9 for S3B cycle 32. .............................................................................. 28

Figure 11: Left panel: WTC (m) from GNSS (red) and from the ERA5 model (blue) for station PDEL in
the Azores islands. Right panel: Corresponding WTC differences (GNSS-ERA5), in mm. .................. 29

Figure 12: Mean WTC differences (GNSS-ERA5), in centimetres, for each GNSS station, function of
station height. ........................................................................................................................................ 29

Figure 13: Standard deviation of WTC differences (GNSS-ERA5), in centimetres, for each GNSS
station, function of latitude. .................................................................................................................... 30

Figure 14: Correlation between GNSS and ERA5, for each GNSS station, function of latitude. ......... 30

Figure 15: Scatterplot of the WPD from GNSS versus the WPD from ERA5, in metres. .................... 30

Figure 16: Monthly mean WPD differences between ERA5 and the WPD from the SSM/I and SSMIS
aboard F10, F11, F13, F14, F16, F17, and F18. ................................................................................... 32

Figure 17: Same as Figure 16, following the calibration of F16 since 2014. ....................................... 32

 4
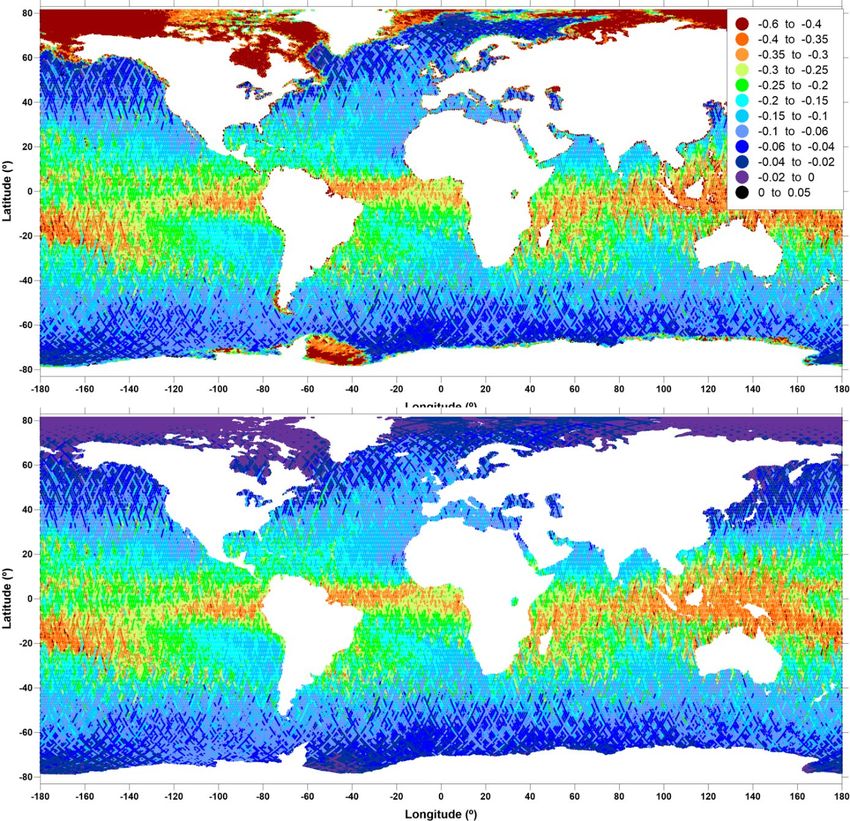
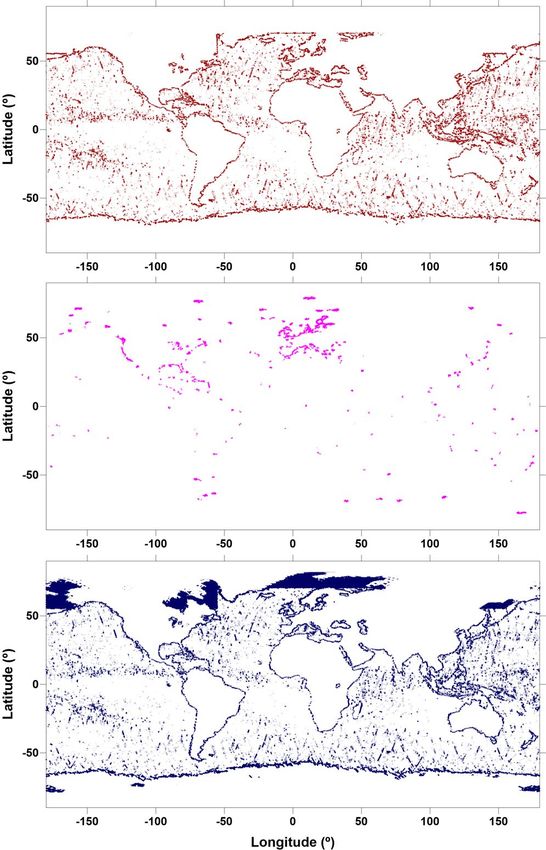
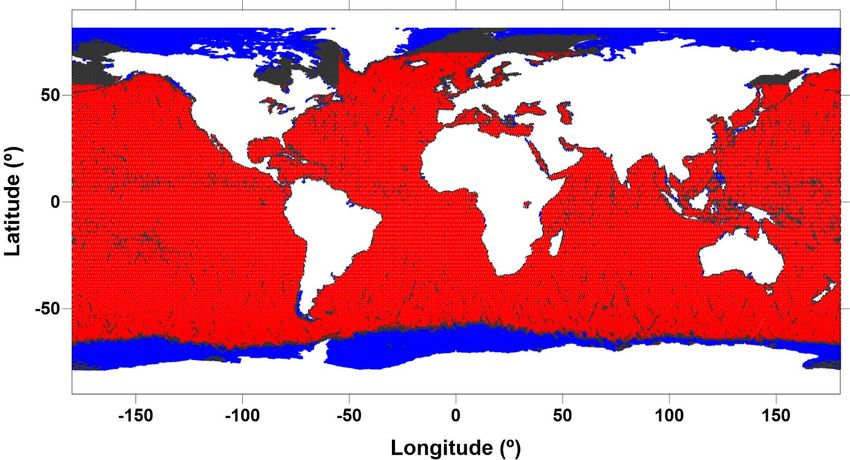
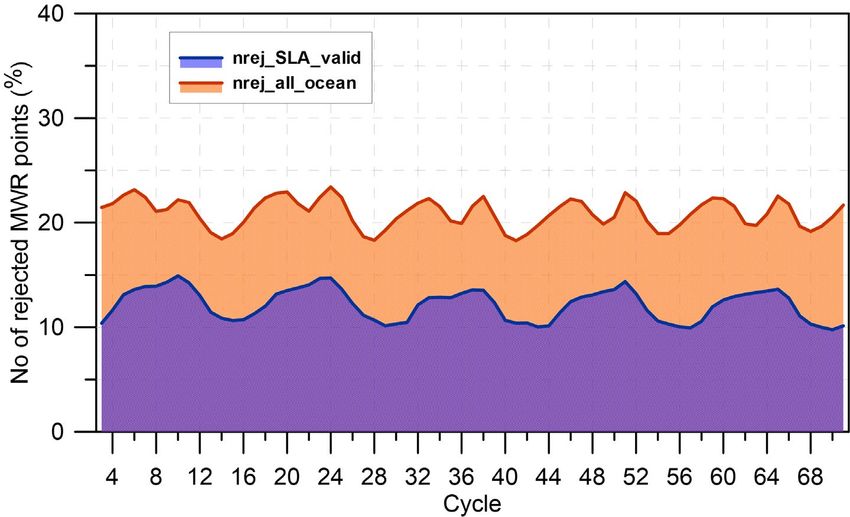
Technical Proposal - RFQ 221050

Figure 18: Monthly mean WPD differences between ERA5 and the WPD from the sensors with products
provided by RSS. The WPD differences between ERA5 and the SSM/I and SSMIS (F10 to F18) are also
shown. F16 is only shown until the end of 2013.................................................................................... 33

Figure 19: Monthly mean WPD differences between ERA5 and the WPD from the sensors with MSPPS
products provided by NOAA CLASS. The WPD differences between ERA5 and the SSM/I and SSMIS
sensors (F10 to F18) are also shown. F16 is only shown until the end of 2013. .................................. 34

Figure 20: Same as on Figure 19 showing only data for 2020 (MSPPS) and 2021 (MIRS). ............... 34

Figure 21: WPD differences (mean cycle values, in cm) between ERA5 and the MWR of the various
reference missions, before the adjustment to the FXX sensors............................................................ 35

Figure 22: WPD differences (monthly mean values in cm) between ERA5 and the MWR of the various
reference missions, before and after adjustment to the FXX sensors. For J3, GDR-F data were used for
the whole period of the mission. ............................................................................................................ 35

Figure 23: WPD differences (monthly mean values, in cm) between the FXX sensors (SSM/I and
SSMIS) and the MWR of the various reference missions, before and after adjustment to the FXX
sensors. ................................................................................................................................................. 36

Figure 24: Monthly mean WPD differences between ERA5 and the adjusted WPD from the sensors
with products provided by NOAA CLASS. The WPD differences between ERA5 and the SSM/I and
SSMIS (F10 to F18) are also shown. F16 is only shown until the end of 2013. ................................... 37

Figure 25: Daily (blue points) and 60-day (red line) means of WPD differences between J3 and S3A, in
cm. ......................................................................................................................................................... 37

Figure 26: Daily (blue points) and 60-day (red line) means of WPD differences between J3 and S3B, in
cm. ......................................................................................................................................................... 38

Figure 27: Daily (blue points) and monthly (magenta line) means of WPD differences between GMI and
S3A, in cm. ............................................................................................................................................ 39

Figure 28: Daily (blue points) and monthly (magenta line) means of WPD differences between GMI and
S3B, in cm. ............................................................................................................................................ 39

Figure 29: Original WTC from the on-board MWR (top) and GPD+ (bottom) for S3A cycle 14 in metres.
............................................................................................................................................................... 41

Figure 30: Original WTC from the on-board MWR (top) and GPD+ (bottom) for S3B cycle 32 in metres,
for the European region. Land and ice contamination is evident in the MWR WTC, clearly not present in
GPD+. .................................................................................................................................................... 42

Figure 31: Percentage of points with MWR_Rej=1, i.e., with invalid on-board MWR WTC, recovered by
GPD+, for the whole set of ocean measurements (orange) and for points with valid SLA (blue), for
Sentinel-3A. ........................................................................................................................................... 42

Figure 32: Same as on Figure 26, for Sentinel-3B. .............................................................................. 43

Figure 33: GPD+ source flag for S3B cycle 32; 0 (red) - valid on-board MWR values (70.0%), 1, 2, 3,
4, 5, 6 or 7 (black) - estimates from observations (13.4%); 8 (blue) - value from the ERA5 model
(16.6%). Percentages refer to the whole number of points present in the S3B product for this cycle. . 44

Figure 34: GPD+ source flag for S3B cycle 32. Top panel: Points estimated from on board MWR
observations (7.3 %). Middle panel: Points estimated from GNSS observations (1.1 %). Bottom panel:
Points estimated from SI- MWR observations (13.0 %). Percentages refer to the whole number of points
present in the S3B product for this cycle. .............................................................................................. 45

 5
Technical Proposal - RFQ 221050

Figure 35: GPD+ source flag for S3A cycle 51; 0 (red) - valid on-board MWR values (70.4%), 1, 2, 3,
4, 5, 6 or 7 (black) - estimates from observations (13.2%); 8 (blue) - value from the ERA5 model
(16.4%). Percentages refer to the whole number of points present in the S3A product for this cycle. . 46

Figure 36: GPD+ source flag for S3A cycle 51. Top panel: Points estimated from on board MWR
observations (6.4 %). Middle panel: Points estimated from GNSS observations (1.1 %). Bottom panel:
Points estimated from SI-MWR observations (12.8 %). Percentages refer to the whole number of points
present in the S3B product for this cycle. .............................................................................................. 47

Figure 37: Illustration of various WTC for S3B cycle 32, pass 006 (top) and S3B cycle 32, pass 334
(bottom): ERA5 (blue), baseline MWR (red) and GPD+ (black). The grey bars indicate points flagged
as invalid (MWR_Rej≠0). The left bottom figure in each panel shows the pass location. .................... 49

Figure 38: Same as on Figure 37 for S3B cycle 32, pass 408 (top) and S3B cycle 32, pass 444 (bottom).
............................................................................................................................................................... 50

Figure 39: Same as on Figure 37 for S3A cycle 51, pass 110 (top) and S3B cycle 32, pass 001 (bottom).
............................................................................................................................................................... 51

Figure 40: Same as on Figure 37 for S3A cycle 51, pass 125 (top) and S3A cycle 51, pass 471 (bottom).
............................................................................................................................................................... 52

Figure 41: Mean (left panel) and RMS (right panel) of the WTC differences between ERA5 (blue),
ECMWF Op. (green), ‘a la CryoSat’ GPD+ (red) and the on-board MWR WTC for S3A cycles 03 to 71.
The number of points per cycle is shown in grey. Only points with valid on-board MWR WTC (with
MWR_Rej flag=0) have been used in this analysis. .............................................................................. 53

Figure 42: Mean (left panel) and RMS (right panel) of the WTC differences between ERA5 (blue),
ECMWF Op. (green) and the standard GPD+ WTC for S3A cycles 03 to 71. The number of points per
cycle is shown in grey. All points with valid SLA have been used in this analysis. ............................... 54

Figure 43: Mean (left panel) and RMS (right panel) of the WTC differences between ERA5 (blue),
ECMWF Op. (green), and the standard GPD+ WTC for S3B cycles 09 to 52. The number of points per
cycle is shown in grey. Only points with valid on-board MWR WTC (with MWR_Rej flag=0) have been
used in this analysis. ............................................................................................................................. 54

Figure 44: Mean (left panel) and RMS (right panel) of the WTC differences between ERA5 (blue),
ECMWF Op. (green), and the standard GPD+ WTC for S3B cycles 09 to 52. The number of points per
cycle is shown in grey. All points with valid SLA have been used in this analysis. ............................... 54

Figure 45: RMS differences between the WTC from the GNSS at coastal stations and the WTC from
the S3A MWR (red dots), GPD+ (squares) and from the ‘a la CryoSat’ WTC (black dots), in cm. The
grey and red coloured bars represent the number of points in each class of distance for GPD and MWR,
respectively. ........................................................................................................................................... 55

Figure 46: Same as on Figure 45 for S3B. ........................................................................................... 56

Figure 47: Temporal evolution of weighted along-track SLA variance differences (%) between GPD+
and ECMWF (blue), and between the MWR-derived WTC and ECMWF (pink) over the period of S3A
cycles 03 to 71. Mean variance differences for the whole period: GPD-ECM=-0.7%; MWR-ECM=-1.2%.
“NP_all” represents the total number of ocean points with valid SLA used in the first case (in grey), while
“NP_MWR” represents the number of points with valid MWR used in the second case (in green). ..... 58

Figure 48: Variance differences (%) of SLA versus latitude (left) and distance from coast (right) between
GPD+ and ECMWF (blue) and between the MWR-derived WTC and ECMWF (pink) over the period of
S3A cycles 03 to 71. “NP_all” and “NP_MWR” have the same meaning as in Figure 47. In the

 6
Technical Proposal - RFQ 221050

comparison with the on-board MWR, only points with valid MWR values have been included, thus points
with distance from coast shorter than 25 km have been excluded. ...................................................... 58

Figure 49: Temporal evolution of weighted along-track SLA variance differences (%) between GPD+
and ECMWF (blue) and between the MWR-derived WTC and ECMWF (pink) over the period of S3B
cycles 09 to 52. Mean variance differences for the whole period: GPD-ECM=-0.8%;MWR-ECM=-1.1%.
“NP_all” and “NP_MWR” have the same meaning as in Figure 47. ..................................................... 58

Figure 50: Variance differences (%) of SLA versus latitude (left) and distance from coast (right) between
GPD+ and ECMWF (blue) and between the MWR-derived WTC and ECMWF (pink) over the period of
S3B cycles 19 to 52 (“phase b”). Similar results are obtained for “phase a” (cycles 09 to 14). “NP_all”
and “NP_MWR” have the same meaning as in Figure 47..................................................................... 59

Figure 51: Temporal evolution of weighted SLA RMS differences (%) at crossovers (Xovers) between
GPD+ and ECMWF (blue) and between the MWR-derived WTC and ECMWF (pink) over the period of
S3A cycles 03 to 71. Mean RMS differences for the whole period: GPD-ECM=-0.9%;MWR-ECM=-1.7%.
“NP_all” and “NP_MWR” have the same meaning as in Figure 47. ..................................................... 60

Figure 52: Spatial distribution of the weighted SLA RMS differences at crossovers (XO) (%) between
GPD+ and ECMWF over the period corresponding to S3A cycles 03 to 71. ........................................ 61

Figure 53: Spatial distribution of the weighted SLA RMS differences at crossovers (XO) (%) between
GPD+ and on-board MWR over the period corresponding to S3A cycles 03 to 71. ............................. 61

Figure 54: SLA RMS differences (%) at crossovers (Xovers) versus latitude (left) and distance from
coast (right) between GPD+ and ECMWF (blue) and between the MWR-derived WTC and ECMWF
(pink) over the period of S3A cycles 03 to 71. “NP_all” and “NP_MWR” have the same meaning as in
Figure 47................................................................................................................................................ 62

Figure 55: Temporal evolution of weighted SLA RMS differences (%) at crossovers (Xovers) between
GPD+ and ECMWF (blue) and between the MWR-derived WTC and ECMWF (pink) over the period of
S3B cycles 09 to 52. Mean RMS differences for the whole period: GPD-ECM=-0.9%; MWR-ECM=-1.9%.
“NP_all” and “NP_MWR” have the same meaning as in Figure 47. ..................................................... 62

Figure 56: Spatial distribution of the weighted SLA RMS differences at crossovers (%) between GPD+
and ECMWF over the period corresponding to S3B cycles 09 to 52. ................................................... 62

Figure 57: Spatial distribution of the weighted SLA RMS differences at crossovers (%) between GPD+
and the on-board MWR WTC over the period corresponding to S3B cycles 09 to 52. ......................... 63

Figure 58: SLA RMS differences (%) at crossovers versus latitude (left) and distance from coast (right)
between GPD+ and ECMWF (blue) and between the MWR-derived WTC and ECMWF (pink) over the
period of S3B cycles 09 to 52. “NP_all” and “NP_MWR” have the same meaning as in Figure 47. .... 63

Figure 59. Percentage of cloud-free points over water surfaces per day. ............................................ 64

Figure 60. AIRWAVE image example for 1 May 2020 (S3A cycle 57, pass 735). ............................... 65

Figure 61. AIRWAVE image example for 1 November 2020 (S3A cycle 64, pass 580). ..................... 65

Figure 62. AIRWAVE image example for 1 April 2021 (S3A cycle 70, pass 260)................................ 66

Figure 63. Match between AIRWAVE and MWR data (example of a portion of S3A cycle 57, pass 735).
............................................................................................................................................................... 67

Figure 64. Various WTC (model in blue, MWR in red and AIRWAVE in green) for S3A cycle 58, pass
128. ........................................................................................................................................................ 68

 7
Technical Proposal - RFQ 221050

Figure 65. A zoom of Figure 64. .......................................................................................................... 68

Figure 66. Various WTC (model in blue, MWR in red and AIRWAVE in green) for S3A cycle 64, pass
002. ........................................................................................................................................................ 69

Figure 67. WPD from model versus WPD from AIRWAVE (both in centimetres). ............................... 70

Figure 68. WPD from model versus WPD differences Mod-AIRWAVE (both in centimetres). ............ 70

Figure 69. WPD differences between model and AIRWAVE (in cm). .................................................. 71

Figure 70. WPD from MWR versus WPD from AIRWAVE (both in cm). .............................................. 71

Figure 71. WPD from MWR versus WPD differences MWR-AIRWAVE (both in centimetres). ........... 72

Figure 72. WPD differences between MWR and AIRWAVE (in cm). ................................................... 73

Figure 73. RMS of the WPD differences between GNSS and AIRWAVE, function of distance from GNSS
station. ................................................................................................................................................... 74

Figure 74. WPD from model versus WPD from AMTROC (both in centimetres). ................................ 76

Figure 75. Mean of the WPD differences between model and AMTROC function of model WPD,
considering classes of 10 cm. ............................................................................................................... 77

Figure 76. RMS of the WPD differences between model and AMTROC function of distance from coast.
............................................................................................................................................................... 77

Figure 77. RMS of the WPD differences between model and AMTROC function of latitude. .............. 78

Figure 78. WPD differences between model and AMTROC (in cm) for S3A cycle 54. ........................ 78

Figure 79. WPD from MWR versus WPD from AMTROC (both in centimetres), considering only valid
WPD retrievals from MWR. ................................................................................................................... 79

Figure 80. Mean of the WPD differences between MWR and AMTROC function of WPD from MWR (10
cm classes). ........................................................................................................................................... 79

Figure 81. WPD differences between MWR and AMTROC (in cm) for S3A cycle 54.......................... 80

Figure 82. WPD from GPD+ versus WPD from AMTROC (both in centimetres). ................................ 80

Figure 83. Mean of the WPD differences between GPD+ and AMTROC, function of WPD from GPD+.
............................................................................................................................................................... 81

Figure 84. WPD differences between GPD+ and AMTROC (in cm) for S3A cycle 54. ........................ 81

Figure 85. RMS of the WPD differences between model and AMTROC (green), between GPD and
AMTROC (black) and between model and GPD+ (grey), function of distance from coast. .................. 82

Figure 86. RMS of the WPD differences between model and AMTROC (green), between GPD and
AMTROC (black) and between model and GPD+ (grey), function of latitude. ...................................... 82

Figure 87. WTC from model (blue, both panels), MWR (red, top panel), GPD+ (black, bottom panel)
and AMTROC (green, both panels) for S3A cycle 54, pass 4............................................................... 83

Figure 88. RMS of the WPD differences between GNSS and AMTROC, function of distance from coast.
............................................................................................................................................................... 85

 8
Technical Proposal - RFQ 221050

List of Tables

Table 1: Content of the GPD+ WTC files. ............................................................................................. 16

Table 2: Main orbital characteristics, compared with those of Sentinel-3, of the satellites with SI-MWR
images of TCWV available for this study. Green-shaded rows refer to products available for the S3A
and S3B missions’ lifetime..................................................................................................................... 19

Table 3: Global mean values for all cycles of the differences in SLA variance and RMS at Xovers of the
WTC comparisons shown in Figure 2 to Figure 5. ................................................................................ 24

Table 4: Product flags (based on flags present in the S3 SRAL/MWR L2 products). .......................... 25

Table 5: Calibration parameters of the adjustment of the MWR WPD of each reference mission to the
FXX sensors. The corresponding parameters for the WTC have the same scale factors and symmetric
offsets. The mean and RMS of the differences between the WPD from FXX and the WPD from each
reference mission, before and after adjustment, are also given. .......................................................... 36

Table 6: Calibration parameters of the adjustment of S3A and S3B WPD to J3 WPD. The corresponding
parameters for the WTC have the same scale factors and symmetric offsets. The mean and RMS of the
differences between the WPD from J3 and the WPD from S3A and S3B are also given. .................... 38

Table 7: Statistical parameters of the comparison between the MWR WPD of GMI and those of S3A
and S3B. ................................................................................................................................................ 39

Table 8. Statistical parameters of the different comparisons. ............................................................... 73

Table 9. Statistical parameters of the WPD differences between GNSS and AIRWAVE for the first two
classes of distance from the GNSS station. .......................................................................................... 74

Table 10. Statistical parameters of the different comparisons with AMTROC...................................... 84

Table 11: Validation Requirements and compliance matrix ................................................................. 87

 9
Technical Proposal - RFQ 221050

1. Introduction

1.1. Purpose and Scope

The purpose of this document is to present the Product Validation Report (PVR) for the GNSS (Global
Navigation Satellite Systems) derived Path Delay Plus (GPD+) Wet Tropospheric Correction (WTC)
products for the Sentinel-3 altimeter missions (GPD4S3) to be generated and delivered by the University
of Porto (UPorto) to EUMETSAT. This document fulfils requirements [R- 26] and [R-47] from [AD-1] and
[GPD-R5], [GPD-R6] and [GPD-R7], from [AD-2].

This activity is being carried out by UPorto under Contract EUM/CO/21/4600002527/CLo Order
4500021007 [AD-4], in response to the EUMETSAT Request for Quotation RFQ 221050 S3 Altimetry
GPD + Wet Tropospheric Correction [AD-3].

The purpose of this activity is a preliminary assessment and implementation of a service to improve the
scientific quality of the Copernicus Sentinel-3 SRAL/MWR Level-2 WTC, in order to improve the
accuracy of altimeter-derived sea surface heights (SSH) [AD-2].

The improvement is accomplished by means of GPD+, an algorithm developed at the University of Porto
to retrieve enhanced WTC for radar altimeter missions (Fernandes and Lázaro, 2016, 2018; Lázaro et
al., 2020). The requested improvement is relevant over surfaces where the WTC from the on-board
Microwave Radiometer (MWR) is not available or is invalid due to e.g. the presence of land or ice in the
large MWR footprint, such as coastal zones, inland waters and high latitudes.

The SoW covers a Baseline Activity and a set of optional activities. The Baseline Activity covers the
computation and assessment of the GPD+ WTC products for the Copernicus Sentinel-3A (S3A) and
Sentinel-3B (S3B) and includes the following tasks:

 1. Computation of the GPD+ WTC for the latest S3 reprocessed dataset, baseline collection 004,
 consisting of about 6 years of data, since missions’ start until end of April 2021;
 2. Delivery of the GPD+ WTC products to EUMETSAT (for further delivery to S3VT for independent
 assessment);
 3. Assessment of the performance of the GPD+ WTC products;
 4. Assessment of the performance of the Altimeter 1DVAR Tropospheric Correction (AMTROC)
 (EUMETSAT, 2020a);
 5. Use of the new AIRWAVE-SLSTR Level-2 Total Column Water Vapour (TCWV) test products
 (EUMETSAT, 2020b) to better characterize the water vapour (WV) variability in coastal areas
 and compare the performances of the different products.

This PVR refers to the validation of the GPD4S3 products delivered under the Baseline Activity (Task
2), performed in Task 3, to the assessment of the AIRWAVE products (Task 5) and to the assessment
of the 1DVAR products (Task 4).

1.2. Overview of the document

In addition to the current section, the document contains eight sections. Section 2 summarises the
relevant background information. Section 3 describes the input and validation data sets used in this
study. Section 4 presents the main data pre-processing steps, while Section 5 presents the assessment
and validation of the GPD+ products. Section 6 describes the assessment of the AIRWAVE TCWV
products preformed under Task 5 while Section 7 presents the assessment of the 1DVAR products
(Task 4). Finally, Section 8 summarises the main conclusions and Section 9 presents the validation
requirements and the respective compliance matrix.

 10
Technical Proposal - RFQ 221050

1.3. Applicable documents

AD-1 Generic Statement of Work (G-SoW) for Product Evolution/Development Studies,
EUM/TSS/SOW/18/1018464
AD-2 Statement of Work (SoW) for Sentinel-3 Altimetry GPD+ Wet Tropospheric Correction, EUM/OPS-
COPER/SOW/20/1186487, V1B, 1 October 2020.
AD-3 Cover letter - Request for Quotation No. 20 221050 (002), EUM/COS/LET/20/1192619, 4
November 2020.
AD-4 Contract EUM/CO/21/4600002527/CLo Order 4500021007, EUM_CO_21_4600002527_CLo -
Order No_ 4500021007_signed.pdf, 12 March 2021.

AD-5 Sentinel-3 User Handbook, http://sentinels.uat.esaportal.eu/documents/247904/685236/Sentinel-
3_User_Handbook, 23 September 2013.

AD-6 GPD+ Wet Tropospheric Correction (GPD4S3) Product Specification Document
UPorto/FCUP/GPD4S3/BA/PSD, V1.2, 05/07/2021.

1.4. Reference documents

Berry, P. A. M., Smith, R. G., & Benveniste, J. (2008). ACE2: The New Global Digital Elevation Model.
In S. P. Mertikas (Ed.), Gravity, Geoid and Earth Observation (Vol. 135, pp. 231–237). Chania, Greece:
Springer. doi: 10.1007/978-3-642-10634-7_30
Bevis, M., Businger, S., Herring, T. A., Rocken, C., Anthes, R. A., & Ware, R. H. (1992). GPS
meteorology: Remote sensing of atmospheric water vapor using the global positioning system. Journal
of Geophysical Research, 97(D14), 15787–15801. doi: 10.1029/92JD01517
Copernicus Climate Change Service (C3S) (2018). ERA5 hourly data on single levels from 1979 to
present. European Union. doi: 10.24381/cds.adbb2d47
Davis, J.L.; Herring, T.A.; Shapiro, II; Rogers, A.E.E.; Elgered, G. GEODESY BY RADIO
INTERFEROMETRY - EFFECTS OF ATMOSPHERIC MODELING ERRORS ON ESTIMATES OF
BASELINE LENGTH. Radio Science 1985, 20, 1593-1607.
EUMETSAT (2020a). Altimeter 1D-VAR Tropospheric Correction (AMTROC):
https://www.EUMETSAT.int/AMTROC.
EUMETSAT (2020b). AIRWAVE-SLSTR: an algorithm to retrieve TCWV from SLSTR measurements
over water surfaces: https://www.EUMETSAT.int/AIRWAVE-SLSTR.
Fernandes, M. J., Lázaro, C. (2016). GPD+ Wet Tropospheric Corrections for CryoSat-2 and GFO
Altimetry Missions. Remote Sensing, 8(10), 851. doi:10.3390/rs8100851.
Fernandes, M. J., Lázaro, C. (2018). Independent assessment of Sentinel-3A wet tropospheric
correction over the open and coastal ocean. Remote Sensing, 10(3), 484. doi:10.3390/rs10030484.
Fernandes, M. J., Lázaro, C., Vieira, T. (2020). Assessing the new S3 MWR PB 2.61 – a contribute to
an enhanced WPD for Sentinel-3, Presented at the 6th S3VT Meeting, 15-17 December 2020, online
meeting.
Fernandes, M. J., Lázaro, C., Vieira, T., Vieira, E., Pires, N. (2019). On the performance of Sentinel-3A
and Sentinel-3B on-board radiometers and corresponding wet path delays, Presented at the 5th S3VT
Meeting, 7-9 May 2019, Frascati, Italy.
Kouba, J. (2008). Implementation and testing of the gridded Vienna Mapping Function 1 (VMF1). Journal
of Geodesy, 82, 193-205.
Lázaro, C., Fernandes, M. J., Vieira, T., and Vieira, E. (2020). A coastally improved global dataset of
wet tropospheric corrections for satellite altimetry, Earth Syst. Sci. Data, 12, 3205–3228,
https://doi.org/10.5194/essd-12-3205-2020.
Mendes, V.B. (1999). Modeling the Neutral-Atmosphere Propagation Delay in Radiometric Space
Techniques. PhD. Thesis, University of New Brunswick, Fredericton, New Brunswick, Canada.

 11
Technical Proposal - RFQ 221050

Mercier, F. (2004). Amélioration de la Correction de Troposphère Humide en Zone Côtière. Rapport
Gocina; CLS-DOS-NT-04-086; 2004, CLS: Ramonville St-Agne, France.
Obligis, E., Eymard, L., Tran, N., Labroue, S., Femenias, P. (2006). First three years of the microwave
radiometer aboard Envisat: In-flight calibration, processing, and validation of the geophysical products.
J. Atmos. Ocean. Technol. 23, 802–814. https://doi.org/10.1175/JTECH1878.1.
Obligis, E., Rahmani, A., Eymard, L., Labroue, S., Bronner, E. (2009). An improved retrieval algorithm
for water vapor retrieval: Application to the envisat microwave radiometer. IEEE Trans. Geosci. Remote
Sens. 47, 3057–3064 https://doi.org/10.1109/TGRS.2009.2020433.
STM ESLs (2019). Sentinel-3 Level 2 SRAL MWR Algorithm Theoretical Baseline Definition,
01/07/2019, Ref.: S3MPC.CLS.PBD.005, Issue: 2.0.
Stum, J.; Sicard, P.; Carrere, L.; Lambin, J. (2011) Using objective analysis of scanning radiometer
measurements to compute the water vapor path delay for Altimetry. IEEE Trans. Geosci. Remote Sens.
49, 3211–3224.
Wentz, F.J. A (1997). A well-calibrated ocean algorithm for special sensor microwave/imager. Journal
of Geophysical Research-Oceans, 102, 8703-8718.
Wentz, F.J. (2013). SSM/I Version-7 Calibration Report. RSS Technical Report 011012, January 11,
2013.

1.5. Abbreviations

 Abbreviation/Term Meaning
 1DVAR One-Dimensional Variational
 ACE2 Altimeter Corrected Elevations 2
 ADF Auxiliary Data File
 AIRWAVE Advanced Infra-Red Water Vapour Estimator
 AMR-2 Advanced Microwave Radiometer 2
 Archiving, Validation and Interpretation of Satellite
 AVISO
 Oceanographic data
 C3S Copernicus Climate Change Service
 Cal/Val Calibration/Validation
 CL Clara Lázaro
 CLASS Comprehensive Large Array-Data Stewardship System
 CODAREP Copernicus Online Data Access for Reprocessing
 CP Check Point
 CVP Calibration/Validation Plan
 CS-2 CryoSat-2
 DEM Digital Elevation Model
 ECMWF European Centre for Medium-Range Weather Forecasts
 DMSP Defense Meteorological Satellite Program
 ECMWF Op. ECMWF operational model
 EPN EUREF Permanent Network
 ERA ECMWF ReAnalysis
 ESA European Space Agency
 European Organization for the Exploitation of Meteorological
 EUMETSAT
 Satellites
 EUREF European Reference Frame
 GDR Geophysical Data Records
 GMI GPM Microwave Imager
 GPM Global Precipitation Measurement
 GNSS Global Navigation Satellite Systems
 GOP Geophysical Ocean Products
 GPD4S3 GPD+ for Sentinel-3

 12
Technical Proposal - RFQ 221050

GPD+ GNSS derived Path Delay Plus
IGS International GNSS Service
HDF Hierarchical Data Format
IVP Integration & Verification Plan
IVR Integration & Verification Report
J3 Jason-3
JF Joana Fernandes
KO Kick-off
KPI Key Performance Indicator
MIRS Microwave Integrated Retrieval System
MoM Minutes of Meeting
MPA Mixed-Pixel Algorithm
MSPPS Microwave Surface and Precipitation Products System
MSPPS_ORB MSPPS Orbital Global Data products
MTR Mid Term Review
MWR Microwave Radiometer
NaN Not a Number
NetCDF Network Common Data Form
NN Neural Network
NOAA National Oceanic and Atmospheric Administration
NTC Non-Time Critical
NWD Normal Working Day
NWM Numerical Weather Model
OA Objective Analysis
OICD Operational Interface Control Document
ORR Operational Readiness Review
PLRM Pseudo Low Resolution Mode
PM Progress Meeting
PMP Project Management Plan
PSD Product Specification Document
PVP Product Validation Plan
PVR Product Validation Report
QPR Quarterly Performance Report
RA Radar Altimeter
RADS Radar Altimeter Database System
RB Requirements Baseline Review
RMS Root Mean Square
RS Radiosondes
RSS Remote Sensing Systems
RSP Remote Sensing and Products
S3 Sentinel-3
S3A/B/C Sentinel-3A/B/C
SAR Synthetic Aperture Radar
SE System Engineer
SI-MWR Scanning Imaging Microwave Radiometer
SLA Service Level Agreement
SLSTR Sea and Land Surface Temperature Radiometer
SoW Statement of Work
SRAL Synthetic Aperture Radar Altimeter
SSHA Sea Surface Height Anomalies
SSM/I Special Sensor Microwave Imager
SSMIS Special Sensor Microwave Imager/Sounder
SST Sea Surface Temperature
STC Short Time Critical
TB Brightness Temperature
TCWV Total Column Water Vapour
TMR TOPEX Microwave Radiometer
TMI TRMM Microwave Imager

 13
Technical Proposal - RFQ 221050

TRMM Tropical Rainfall Measuring Mission
TV Telmo Vieira
UPorto University of Porto
WTC Wet Tropospheric Correction
WV Water Vapour
Xover Crossover
ZHD Zenith Hydrostatic Delays
ZTD Zenith Total Delays
ZWD Zenith Wet Delays

 14
Technical Proposal - RFQ 221050

2. Background information

This section presents some background information required to put this study into context, namely a
brief description of the GPD+ methodology. More details can be found in the relevant literature, e.g.
Fernandes and Lázaro, 2016, 2018 and Lázaro et al., 2020.

GPD+ is an algorithm for estimating the WTC of radar altimeter observations, using data combination,
by space-time objective analysis (OA) of all available valid WTC measurements in the vicinity of the
estimation point. The algorithm takes into account the accuracy of each observation and the variability
of the WTC field, by means of its spatial and temporal correlation scales.

Its main application has been the estimation of new WTC values over points where the WTC from the
on-board MWR is invalid, due to the fact that current MWR retrievals are only tuned for open-ocean
conditions and the MWR have large footprints of 10-40 km diameter, depending on instrument and
frequency. In this way, GPD+ provides a continuous set of WTC, valid over all surface types.

In the OA estimation, the algorithm uses:

 ⁻ the WTC from a Numerical Weather Model (NWM), currently ERA5, as first guess. In the
 absence of valid observations, this will also be the final estimate;

 ⁻ the following set of observations: valid on-board MWR WTC values from the neighbouring
 points, WTC from scanning imaging MWR (SI-MWR) products available from other remote
 sensing missions and WTC from GNSS.

 Considering different applications, GPD+ can be run in two different versions or modes:

 • “on-board” or “standard” GPD – This is the standard GPD solution, as delivered under this
 activity, incorporating all available data types, including the S3 on-board microwave radiometer
 and external sources - WTC from GNSS data and from SI-MWR. It preserves the valid S3 MWR
 values and new estimates are obtained only for points flagged as invalid. By default, unless
 otherwise stated, GPD+ (or simply GPD) refers to this correction.

 • ‘a la Cryosat’ GPD – In this version, all points are estimated using only ERA5 and external data
 sources (SI-MWR and GNSS). This correction has been developed for CryoSat-2, which does
 not possess an on-board MWR, but it can be estimated over the along-track points of any other
 altimeter mission, including S3A/B.

From the above description, it results that the ‘a la Cryosat’ GPD+ is independent from the S3A/B on-
board MWR and can be used to validate the WTC from these sensors.
According to Table 1, extracted from [AD-6], in addition to the time (time_01) and geolocation fields
(lat_01 and lon_01), the GPD4S3 products delivered under this activity include the following three fields:
 - gpd_wet_tropo_cor_01 - GPD+ WTC in metres;
 - gpd_reference_height_01 - Height at which the GPD+ WTC has been computed, in metres;
 - gpd_source_flag_01 – flag containing information on the data sources used in the estimation of
 each GPD+ WTC value.
For each 1Hz S3A/B ground-track point, the content of the gpd_wet_tropo_cor_01 field is described
below. Further details can be found in [AD-6]:
 1) The S3A/B MWR-derived WTC (possibly scaled after calibration) for all S3 points with valid
 MWR values (gpd_source_flag_01=0). In the current version no calibration factors have been
 applied, i.e., the scale factor is 1 and the offset is 0;
 2) A new estimation obtained from the algorithm, for all S3 points with invalid MWR-derived WTC,
 for which valid observations exist (gpd_source_flag_01=1-7);

 15
Technical Proposal - RFQ 221050

 3) The first guess (ERA5-derived WTC), in the absence of valid observations
 (gpd_source_flag_01=8).
Apart from possible algorithm upgrades, the products delivered in Phases 1 and 2, if exercised, will have
the same content.

Table 1: Content of the GPD+ WTC files.

 Data Scale
 Field name Field description Units
 type factor

 UTC seconds since 2000-01-01 00:00:00.0, as in the
 time_01 seconds double -
 altimeter input file

 lat_01 Latitude, as in the altimeter input file degrees int 1.e-06

 lon_01 Longitude, as in the altimeter input file degrees int 1.e-06

 gpd_wet_tropo_cor_01 GPD+ WTC metres short 1.e-04

 gpd_reference_height_01 Height at which the GPD+ WTC has been computed metres short 1

 Data type used in the estimation (unitless).

 0: Valid on-board MWR value, GPD+ estimate is this
 value, eventually scaled; Not 0: Invalid MWR value, a
 new estimate is obtained.
 (0) – Valid on-board MWR value, eventually scaled
 (1) – Estimate from on board MWR observations only
 (2) – Estimate from SI-MWR observations only
 gpd_source_flag_01 (3) – Estimate from MWR and SI-MWR observations unitless byte -
 (4) – Estimate from GNSS observations only
 (5) – Estimate from MWR and GNSS observations
 (6) – Estimate from SI-MWR and GNSS observations
 (7) – Estimate from on-board MWR, SI-MWR and
 GNSS observations
 (8) – No observations exist, estimate is from the NWM
 used as first guess

To ensure consistency and continuity of GPD+ WTC estimates, various pre-processing steps are
required (see section 4)
 ⁻ Quality control and calibration of the various input datasets;
 ⁻ Computation of the MWR_Rej flag, which determines which points are going to be estimated
 and which ones preserve the WTC from the on-board radiometer.
This quality control and calibration steps ensure that no large discontinuities should exist in the transition
between WTC values corresponding to each of the three cases indicated above: from the on-board
MWR (case 1), estimated from different data sources (case 2), or model values (case 3).

All radiometers used as inputs in GPD+ (both the S3 on-board MWR and all SI-MWR) are periodically
calibrated against the Special Sensor Microwave Imager (SSM/I) and Special Sensor Microwave
Imager/Sounder (SSMIS). Calibration factors are applied to S3 MWR data only if considered significant.
Under this activity, a new calibration of all radiometers has been carried out.

 16
Technical Proposal - RFQ 221050

All GPD+ WTC values are provided at surface level: i) sea level (h=0) over ocean and coastal points; ii)
surface level (h given by the ACE2 DEM (Berry et al., 2008)) over all non-ocean points. As mentioned
above, the height at which each WTC has been computed is given in the field gpd_reference_height_01.

3. Input and validation datasets

This section describes the various datasets used throughout this study.

It is recalled that GPD+ is a data combination method. For this reason, it incorporates all valuable
available products considered relevant to improve the WTC in the regions where the on-board
radiometer fails. It has already been proven that this methodology leads to significant improvements
with respect to the so-called Composite Correction, the ECMWF-derived WTC and the on-board MWR-
derived WTC in regions where the latter is invalid (e.g. Fernandes and Lázaro, 2016, Lázaro et al, 2020).

Most datasets described here (e.g. GNSS, SI-MWR, ERA5 and ECMWF operational models) are
independent from the MWR aboard S3 and can therefore be used as independent data to validate these
sensors. However, they are not really independent from GPD+, as most of them are incorporated in the
data combination procedure.

At present, there is only one relevant in situ dataset independent from GPD+ (not being incorporated in
the GPD+ system) that could be used for validation purposes: radiosondes. However, the radiosondes
network is very sparse, with stations located around the coastlines and over land, with a time interval
between the observations of 12h hours or more. Consequently, the comparison with radiosondes would
provide very similar and redundant information with respect to the comparison with GNSS (even if the
latter data are not completely independent).

In summary, due to the fact that GPD+ is a data combination algorithm, all valid observations are used
as input. The conscious consequence of this, is the fact that no independent in situ data are left for
validation purposes. In spite of this, some a posteriori comparisons between some of these datasets
(e.g. GNSS) and GPD+ provide useful information about the GPD+ WTC in comparison with the
baseline MWR or the model WTC, as it will be demonstrated in section 5.2.

In the GPD computation and subsequent validation activities, the following datasets have been used [R-
21], [R-24] and are described in this section:

 • S3A/S3B SRAL/MWR L2 Products from the latest reprocessing baseline collection 004,
 spanning the period from missions’ start until end of April 2021.

 • Geophysical Data Records (GDR) from the various altimeter reference missions.

 • Total Column Water Vapour (TCWV) products from various SI-MWR sensors available from
 various data providers.

 • Zenith Total Delays (ZTD) from GNSS available from various data processing centres.

 • ERA5 model fields from the European Centre for Medium Range Weather Forecasts (ECMWF)
 (C3S, 2018).

 • ‘a la Cryosat’ GPD for S3A/B – Since this correction is independent of the S3 MWR, it allows an
 independent assessment of the S3 on-board MWR WTC.

 • 1DVAR WTC, provided by EUMETSAT as CFI.

 • SLSTR AIRWAVE WTC, provided by EUMETSAT as CFI.

 17
Technical Proposal - RFQ 221050

The last two datatypes will only be used in version 2 of this document, in the validation analyses planned
in Tasks 4 and 5, respectively. In all cases, the most recent datasets have been used [R-23].

3.1. Sentinel-3 products

The GPD+ products derived under this activity are based on the S3 SRAL/MWR L2 Product from the
latest reprocessing baseline collection 004, spanning the period from missions’ start until end of April
2021. These were available from CODAREP (from the beginning of the mission up to the end of 2019)
and from CODA (since 2020) [AD-5].

Currently, these S3 products include the following WTC derived from the S3 MWR observations, using
a neural network (NN) algorithm (STM ESLs, 2019).

 • rad_wet_tropo_cor_01_ku (MWR_SAR3) – 1Hz MWR-derived WTC retrieved from three
 parameters: the brightness temperatures at 23.8 GHz (TB 23.8) and 36.5 GHz (TB 36.5) and
 altimeter-derived backscatter coefficient at Ku band (σ0) from Synthetic Aperture Radar (SAR)
 retrievals (SAR σ0) (Obligis et al., 2006). This is the default radiometer-based WTC, adopted in
 the generation of S3 sea surface height anomalies (SSHA).

 • rad_wet_tropo_cor_01_plrm_ku (MWR_PLRM3) – same as previous (3 parameters), with σ0
 from Pseudo Low Resolution Mode (PLRM) retrievals.

 • rad_wet_tropo_cor_sst_gam_01_ku (MWR_SAR5) – 1Hz MWR-derived WTC retrieved from
 five parameters: TB 23.8, TB 36.5, SAR σ0, sea surface temperature (SST) from seasonal tables
 and vertical lapse rate of atmospheric temperature between the surface and the 800 hPa
 pressure level (γ800) (Obligis et al., 2009).

 • rad_wet_tropo_cor_sst_gam_01_plrm_ku (MWR_PLRM5) – same as previous (5
 parameters), with σ0 from PLRM retrievals.

The following two WTC, derived from the ECMWF operational model (ECMWF Op.), are present in the
S3 products (STM ESLs, 2019) and are usually used as backup of the MWR WTC, whenever the former
is not available (e.g. over land and ice).

 • mod_wet_tropo_cor_meas_altitude_01 – WTC from ECMWF Op. at the altitude of the
 altimeter measurement – ECMWFmeas.

 • mod_wet_tropo_cor_zero_altitude_01 – WTC from ECMWF Op. at sea level – ECMWFzero.

The ECMWF Op. correction used in the validation tasks of this study is the
mod_wet_tropo_cor_zero_altitude_01 field, simply referred to as ECMWF Op. or ECM WTC (the last
term is often used in the plots).

The current S3 products also include a third type of WTC, the so-called Composite WTC,
comp_wet_tropo_cor_01_plrm_ku (Mercier, 2004). For some time, the Composite correction was the
default WTC adopted by AVISO in the generation of altimeter products such as the Corrected Sea
Surface Heights. Like GPD+, the Composite WTC also aims to be a continuous product, where the
MWR WTC is replaced by values from the ECMWF model in points where the former is invalid. The
model values are previously adjusted to the closest valid MWR observations. It has been shown
(Fernandes et al., 2015, Fernandes and Lázaro, 2018) that, relative to this correction, GPD+ leads to a
significant improvement, in particular in the coastal regions and for the ESA missions possessing two-
band radiometers such as S3.

The main difference between the Composite and the GPD+ WTC is that the former replaces the invalid
MWR observations by model values while the latter provides new estimates based on observations,

 18
You can also read