Profiling float observation of thermohaline staircases in the western Mediterranean Sea and impact on nutrient fluxes - Biogeosciences
←
→
Page content transcription
If your browser does not render page correctly, please read the page content below
Biogeosciences, 17, 3343–3366, 2020
https://doi.org/10.5194/bg-17-3343-2020
© Author(s) 2020. This work is distributed under
the Creative Commons Attribution 4.0 License.

Profiling float observation of thermohaline staircases in the western
Mediterranean Sea and impact on nutrient fluxes
Vincent Taillandier1 , Louis Prieur1 , Fabrizio D’Ortenzio1 , Maurizio Ribera d’Alcalà2,3 , and Elvira Pulido-Villena4
1 Laboratoire   d’Océanographie de Villefranche, UMR 7093, CNRS, Sorbonne Universités, Villefranche-sur-Mer, France
2 Department    of Integrative Marine Ecology, Stazione Zoologica Anton Dohrn, Naples, Italy
3 Istituto per lo Studio degli Impatti Antropici e Sostenibilità in Ambiente Marino, CNR, Rome, Italy
4 Mediterranean Institute of Oceanography, UMR 7294, Aix-Marseille Université, CNRS, Université de Toulon,

IRD, Marseille, France

Correspondence: Vincent Taillandier (taillandier@obs-vlfr.fr)

Received: 19 December 2019 – Discussion started: 15 January 2020
Revised: 14 May 2020 – Accepted: 25 May 2020 – Published: 2 July 2020

Abstract. In the western Mediterranean Sea, Levantine inter-       1   Introduction
mediate waters (LIW), which circulate below the surface pro-
ductive zone, progressively accumulate nutrients along their
pathway from the Tyrrhenian Sea to the Algerian Basin. This        The Mediterranean Sea is an ultraoligotrophic basin where
study addresses the role played by diffusion in the nutrient       primary production is generally weak because nutrient fluxes
enrichment of the LIW, a process particularly relevant inside      into the sunlit surface layers are very low during most of the
step-layer structures extending down to deep waters – struc-       year. Apart from dense water formation zones where spring
tures known as thermohaline staircases. Profiling float ob-        phytoplankton blooms are observed (D’Ortenzio and Ribera
servations confirmed that staircases develop over epicentral       d’Alcalà, 2009), nutrient fluxes and phytoplankton uptake
regions confined in large-scale circulation features and main-     occur mostly at the thermocline (Pasqueron de Fommervault
tained by saltier LIW inflows on the periphery. Thanks to a        et al., 2015), maintaining a subsurface chlorophyll maximum
high profiling frequency over the 4-year period 2013–2017,         layer (Lavigne et al., 2013; Barbieux et al., 2019).
float observations reveal the temporal continuity of the lay-         Similarly to the global ocean (Williams and Follows,
ering patterns encountered during the cruise PEACETIME             2003), the Mediterranean nutrient stocks below the thermo-
and document the evolution of layer properties by about            cline are determined by large-scale hydrodynamical trans-
 + 0.06 ◦ C in temperature and +0.02 in salinity. In the Al-       port, following three distinct thermohaline circulation cells
gerian Basin, the analysis of in situ lateral density ratios un-   (Wüst, 1961). In the western Mediterranean, deep wa-
tangled double-diffusive convection as a driver of thermoha-       ters (hereinafter DW) result from winter convection in the
line changes inside epicentral regions and isopycnal diffusion     Provençal Basin and in the Ligurian Sea (Medoc Group,
as a driver of heat and salt exchanges with the surrounding        1970; Prieur et al., 1983). Likewise, the eastern Mediter-
sources. In the Tyrrhenian Sea, the nitrate flux across ther-      ranean DW are formed in the southern Adriatic Sea and
mohaline staircases, as opposed to the downward salt flux,         intermittently in the Aegean Sea (Lascaratos et al., 1999;
contributes up to 25 % of the total nitrate pool supplied to       Roether et al., 2007). Levantine intermediate waters (here-
the LIW by vertical transfer. Overall, however, the nutrient       inafter LIW) originate mostly through shallow convection in
enrichment of the LIW is driven mostly by other sources,           different sites of the Levantine Basin (Nittis and Lascaratos,
coastal or atmospheric, as well as by inputs advected from         1999; The LIWEX Group, 2003). The thermohaline circula-
the Algerian Basin.                                                tion cells involving DW are distinct in the eastern and the
                                                                   western Mediterranean basins, whereas the one driven by
                                                                   LIW encompasses the whole Mediterranean. They region-
                                                                   ally distribute nutrient stocks, through DW that spread from

Published by Copernicus Publications on behalf of the European Geosciences Union.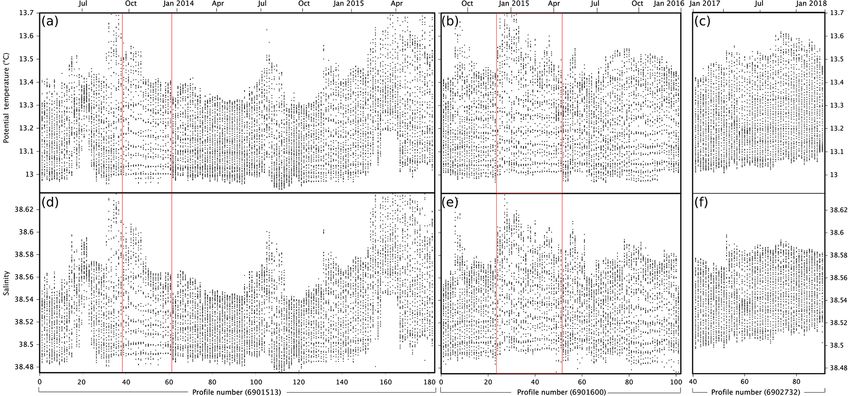
3344                                              V. Taillandier et al.: Profiling float observation of thermohaline staircases

the Liguro-Provençal Basin and from the Adriatic–Aegean            spatial continuity from very high resolution synoptic obser-
seas or through LIW from the eastern Mediterranean (Ribera         vations.
d’Alcalà et al., 2003; Kress et al., 2003).                           Staircases are thought to be sites of thermohaline changes
   Interestingly, the preformed nutrient concentrations in         among well-organized homogeneous layers, in which such
LIW are very low (Pasqueron de Fommervault et al., 2015);          singular structures are maintained over long terms. Changes
they are thought to be accumulated along the path, becoming        can take the form of either intrusions of heat and salt spread-
a relevant source of nutrients in the western Mediterranean        ing horizontally inside layers (McDougall, 1985; Merryfield,
with nitrate concentration of around 5 µmol kg−1 in the Strait     2000) or slow temporal trends induced by the downward
of Sicily. These values are already quite high compared to         flux of heat and salt between layers (Schmitt, 1994; Radko
the intermediate concentrations of the eastern Mediterranean       and Smith, 2012). In order to untangle the two processes,
but correspond to half the concentration measured in the           an accurate measurement of thermohaline changes requires
western Algerian Basin (Pujo-Pay et al., 2011). In order to        temporal continuity of layers, which is the most challenging
reach such concentrations in the Ionian water inflows, LIW         aspect for observations. Indeed, because thermohaline stair-
should export the major part of atmospheric and terrestrial        cases occur far from the coastal zones and develop at depth,
inputs from the eastern Mediterranean (Ribera d’Alcalà et          data acquisition is often limited to high-resolution but short-
al., 2003). Conversely, the mechanisms of LIW enrichment           term records (e.g., Buffett et al., 2017) or coarse temporal
(i.e., accumulation of nutrients in the LIW) inside the west-      resolution but long-term records (e.g., Falco et al., 2016; Du-
ern Mediterranean are not so clear. External sources (river        rante et al., 2019). Moreover, most of the existing studies
and coastal runoffs or atmospheric deposition) are larger than     have not considered the role of thermohaline staircases in nu-
in the eastern Mediterranean, but the remineralization of or-      trient distribution, because pertinent observations of biogeo-
ganic matter settling from the surface layer becomes a major       chemical parameters were hard to obtain in the water column
contributor there (Béthoux et al., 1998). It is worthwhile not-    at relevant temporal and spatial scales. Profiling floats pro-
ing that the LIW enrichment in the Tyrrhenian Sea is com-          vide, however, valuable data that can include biogeochemi-
parable to that which occurs in the Provençal Basin, as doc-       cal parameters, allowing for the suitable exploration of the
umented by the cruise PEACETIME (Fig. 1). This observa-            characteristic scales of these features (Biogeochemical-Argo
tion has raised our interest in the contribution of alternative    Planning Group, 2016).
processes that could explain such regional modifications in           In the present study, we focus on the role played by di-
nutrient stocks.                                                   apycnal diffusion in the distribution of nutrients in the west-
   Although the overall distribution of nutrients is driven by     ern Mediterranean Sea considering nutrient fluxes between
large-scale circulation, internal processes acting on the ver-     DW, LIW and surface waters, given the regional characteris-
tical scale modify the layout of inorganic matter. This is         tics of mixing processes. We use the dataset acquired during
the case of diapycnal diffusion, which can be particularly         the cruise PEACETIME (Guieu et al., 2020), which carried
efficient when it is enhanced by vertical mixing processes         out a large-scale survey of the western Mediterranean Sea
due to salt fingering (Hamilton et al., 1989; Fernandez-           in May–June 2017, although data of earlier cruises are also
Castro et al., 2015). Under appropriate conditions reviewed        considered. Shipboard data are combined with observations
by Schmitt (1994), salt fingering tends to organize the wa-        collected by a unique array of Biogeochemical Argo floats
ter column into series of mixed layers separated by sharp          deployed in the western Mediterranean Sea (D’Ortenzio et
temperature and salinity gradients, ultimately leading to the      al., 2020). The aims of this study are (i) to provide a fine
formation of thermohaline staircases. Since this natural phe-      characterization of the staircases recorded by shipboard data,
nomenon was elucidated (Stern, 1960; Stern and Turner,             (ii) to infer their spatial extension and temporal persistence
1969), the western Mediterranean Sea has become one of             using profiling float observations, (iii) to confirm the occur-
the world’s focus points for the in situ characterization of       rence of salt fingering, and (iv) to assess the contribution of
the resulting step-layer structures. Molcard and Tait (1977)       this mixing process in the progressive nutrient enrichment of
reported the presence of persistent staircases in the cen-         LIW.
tral Tyrrhenian Sea, composed of 10 homogeneous layers
between 600 and 1500 m, with constant seawater proper-
ties over 3 years of observation. Later, Zodiatis and Gas-         2     Data and methods
parini (1996) described the areal extent of the structure,
covering large distances from the central area and progres-        2.1    CTD profiles
sively weakening and disappearing near the coasts. Krah-
mann (1997) reported the first synoptic observations of ther-      During the cruise PEACETIME in May–June 2017 (Guieu
mohaline staircases in the Algerian Basin, confirmed by Bry-       and Desboeufs, 2017; Guieu et al., 2020), pressure, in situ
den et al. (2014) from biannual surveys across this region.        temperature and conductivity of seawater were measured us-
More recently, Buffett et al. (2017) revealed their remarkable     ing SBE911+ CTD from the surface to the bottom. This
                                                                   instrumental package provides continuous acquisitions at

Biogeosciences, 17, 3343–3366, 2020                                                  https://doi.org/10.5194/bg-17-3343-2020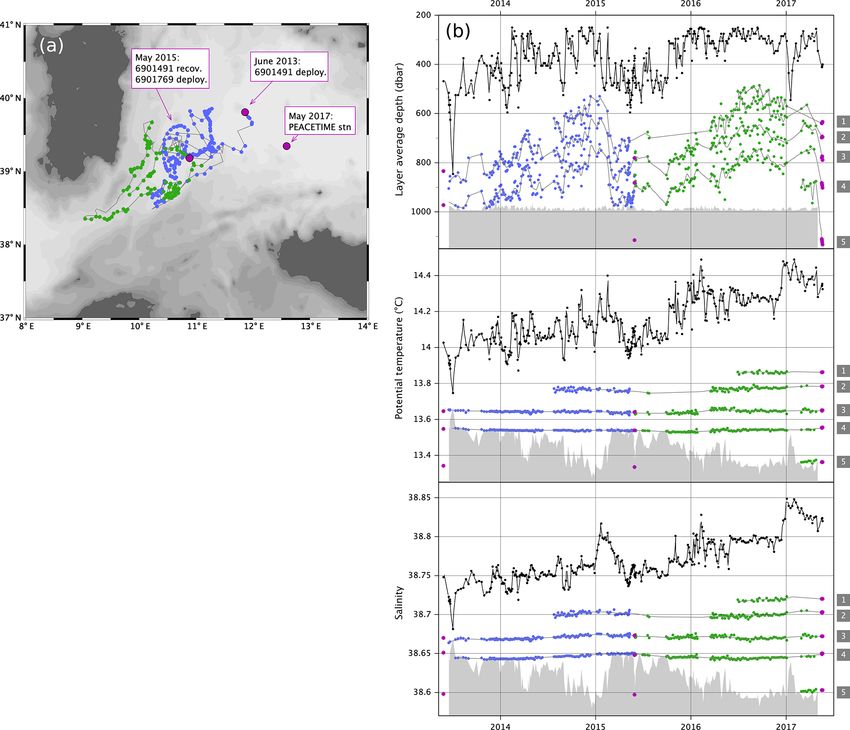
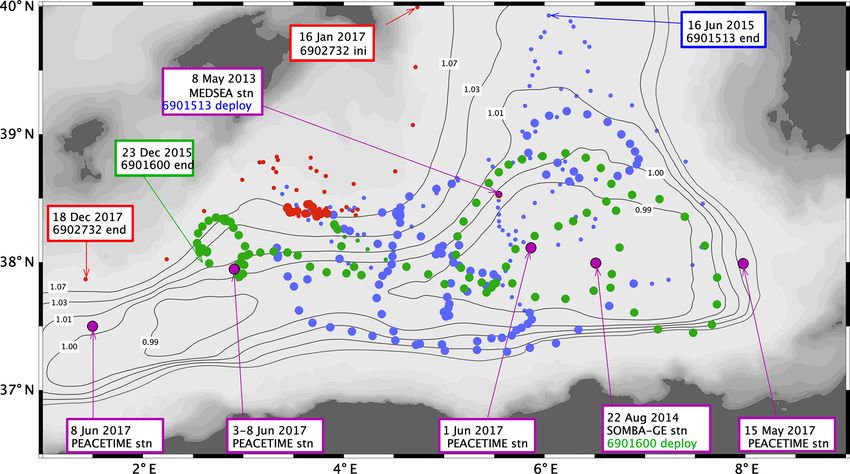
V. Taillandier et al.: Profiling float observation of thermohaline staircases                                                       3345

Figure 1. Pathway of LIW in the western Mediterranean (dashed line), crossing the two geographical areas under study (black boxes).
Numbers in white circles correspond to the nitrate concentrations (µmol kg−1 ) in LIW (at the salinity maximum) measured during the cruise
PEACETIME.

24 scans per second. The depth of each scan is given as a              ture and 2.4 dbar for pressure (Wong et al., 2019). CTD pro-
pressure value (bar). Raw data are processed into quality-             files are collected during ascent from the parking depth to
controlled profiles of salinity expressed in practical salinity        the surface, lasting about 3 h, with a nominal vertical speed
units and of potential temperature referenced to the surface           of 0.1 m s−1 . In the layer between 250 and 1000 dbar, each
(0 dbar), at the vertical resolution of 1 dbar (about 1 m). For        record is an average of temperature and salinity in 10 dbar
the sake of simplification in the present study, salinity cor-         bins (about 200 scans), which reduces the noise of raw ac-
responds to practical salinity (no dimension) and temper-              quisitions.
ature corresponds to the derived parameter potential tem-                 The selected BGC-Argo profiles were collected in two re-
perature (◦ C). The accuracy of measurement of the CTD                 gions: (38–42◦ N, 8–16◦ E) in the Tyrrhenian Sea and 36–
unit is about 1 dbar in pressure, 0.001 ◦ C in temperature             40◦ N, 2–9◦ E in the Algerian Basin (Fig. 1). The result-
and 0.003 in salinity. The PEACETIME shipboard dataset                 ing time series of CTD profiles covered 4 years between
is complemented with CTD profiles collected during three               May 2013 and May 2017 (date of the cruise PEACETIME) in
earlier cruises with the same instrumental package, Med-               the first region; it lasted 4.5 years between May 2013 and De-
SeA (Ziveri and Grelaud, 2015) in May 2013, SOMBA-GE                   cember 2017 in the second region (Table 1). The time series
(Mortier et al., 2014; Keraghel et al., 2020) in August 2014           have a nominal temporal resolution of 7 d that can increase
and BioArgoMed (Taillandier et al., 2018) in May 2015.                 up to 1 d. In the Tyrrhenian Sea, 323 CTD profiles were col-
   Another CTD dataset has been collected by profiling                 lected by two float deployments. The first float 6901491 was
floats, autonomous platforms that drift in the interior ocean          deployed in June 2013 during the cruise VENUS2 and was
and evenly surface for positioning and data transmission.              recovered while still active 2 years later in the southwest sec-
The profiling floats considered in this study belonged                 tor of the basin during the cruise BioArgoMed. The second
to the Mediterranean Biogeochemical (BGC) Argo array                   float 6901769 was deployed immediately (same time and lo-
(D’Ortenzio et al., 2020). The sampling strategy of this ar-           cation) following the recovery of float 6901491; it drifted
ray is better suited for observations of thermohaline stair-           across the Sardinian Channel for 2 years afterwards and was
cases than is the MedArgo array (Poulain et al., 2007)                 lost in January 2018. In the Algerian Basin, 336 profiles were
because the BGC-Argo profiles are deeper, 1000 dbar in-                collected by three consecutive float deployments. The first
stead of 700 dbar, and remain longer within the deploy-                float 6901513 was deployed in May 2013 during the cruise
ment basin thanks to a parking depth of 1000 dbar, instead             MedSeA, leaving the Algerian Basin more than 2 years later,
of 350 dbar for the MedArgo array. Furthermore, BGC-                   and was recovered in June 2016 in the Provençal Basin dur-
Argo floats have higher vertical resolution between 250 and            ing the cruise MOOSE-GE (Testor et al., 2010). The second
1000 dbar, 10 dbar instead of 25 dbar for MedArgo array.               float 6902732 was refitted following its previous deployment
These floats are equipped with SBE-41CP-pumped CTDs,                   in the Tyrrhenian Sea and deployed at the date and location
sensors of high stability adapted from mooring applications            of the float 6901513 recovery; it entered the Algerian Basin
that provide continuous acquisition at 0.5 Hz with an instru-          offshore Minorca in January 2017 and left the basin 1 year
mental precision of 0.01 for salinity, 0.002 ◦ C for tempera-          later. The third float 6901600 was deployed during the cruise

https://doi.org/10.5194/bg-17-3343-2020                                                         Biogeosciences, 17, 3343–3366, 2020
3346                                              V. Taillandier et al.: Profiling float observation of thermohaline staircases

SOMBA-GE in August 2014 and was lost in the western part           2.3   Thermohaline staircases
of the basin after more than 1 year of operation.
   Overall, this study encompasses a dataset of about              For the sake of clarity, the terminology used in the text is
700 profiles, acquired by BGC-Argo floats at a 10 dbar verti-      illustrated in Fig. 2. Thermohaline staircases are observed
cal resolution and the shipboard CTD package at a 1 dbar ver-      where large-scale temperature and salinity fields decrease
tical resolution, with a metrological harmonization at the pre-    with depth in a manner that favors the mixing process of salt
cision of the BGC-Argo standards (0.002 ◦ C in temperature         fingering (Schmitt, 1994). This natural process has been pre-
and 0.01 in salinity). The systematic metrological verifica-       dicted by theoretical models and reproduced by laboratory
tion of BGC-Argo CTD sensors, comparing their first profile        experiments and numerical simulations (Schmitt, 1994; Stern
at deployment with the concomitant shipboard CTD profile,          and Turner, 1969; Merryfield, 2000; Radko et al., 2014). Salt
confirmed the absence of an initial calibration shift for the      fingers take the form of tiny cells (some centimeters wide,
five floats. This metrological verification has also been car-     some tens of centimeters tall) across which the rising and
ried out for the recovered floats (6901513, 6901491), which        sinking fluids mostly exchange heat, as thermal molecular
confirmed the absence of temporal drift larger than the nom-       diffusivity is larger than that of salt by 2 orders of magnitude.
inal uncertainties in CTD measurements.                            In the vertical extension of the cells, sinking (conversely ris-
                                                                   ing) fluids find themselves saltier (conversely fresher) than,
2.2    Nitrate concentrations                                      but with the same temperature as, waters at the same depth.
                                                                   The resulting buoyancy instability drives convection in the
During the cruise PEACETIME, dissolved inorganic nitrate           adjoining mixed layers. When salt fingering is active, the
was determined in seawater samples collected by Niskin bot-        whole transition zone between the warm and salty waters and
tles at discrete depth levels in conjunction with the shipboard    the cold and fresh waters will be reorganized into mixed lay-
CTD profiles. Two distinct sets were processed (Guieu et           ers separated by thin stratified interfaces, until an equilibrium
al., 2020): one analyzed within the surface mixed layer at         of well-developed staircases is reached (Radko, 2005). The
nanomolar concentration levels and one analyzed below at           relative stability of this arrangement, whether across a sin-
submicromolar concentration levels, the latter of which is         gle interface (local) or considering the whole transition zone
considered in the present study. For this latter set, concen-      (bulk), can be expressed in terms of the density ratio:
trations were measured on board by the standard automated
colorimetric method (Aminot and Kerouel, 2007), using a            Rρ = (α · ∂θ/∂z)/(β · ∂S/∂z),                                 (1)
SEAL Analytical continuous flow analyzer, AutoAnalyzer 3           which relates the stabilizing vertical temperature (θ ) gradient
(AA3). The profiles have a vertical resolution of 10 m in the      and the destabilizing vertical salinity (S) gradient. α and β
surface layer (0–100 dbar), 50 m in the intermediate layer
                                                                   are the thermal expansion and haline contraction coefficients
(100–500 dbar) and 500 m in the deep layer (below 500 dbar
                                                                   of seawater referenced to the same pressure as potential tem-
depth down to the sea bottom). Note that the sampling of the
                                                                   perature:
surface layer was performed more than once during two long
stations in the western Algerian Basin (10 times) and in the       α = −(1/ρ) · ∂ρ/∂θ, β = (1/ρ) · ∂ρ/∂S,                        (2)
central Tyrrhenian Sea (4 times). For the latter station only,
the vertical resolution was increased to 100 m in the upper        where ρ is the potential density derived from pressure, tem-
part of the deep layer (500–1000 dbar).                            perature and salinity using the equation of the state of sea-
   Another dataset of nitrate concentrations has been col-         water. Based on field observations, low values of the density
lected by the BGC-Argo float 6901769 (Table 1). The float          ratio (between 1 and 1.7) are conditional for staircase for-
was equipped with a Satlantic SUNA (Submersible Ultravio-          mation (Schmitt et al., 1987). In the Tyrrhenian Sea and the
let Nitrate Analyzer) sensor, a miniaturized ultraviolet spec-     Algerian Basin, the probability distribution of local density
trophotometer with which nitrate concentrations can be re-         ratios fits the low conditional values (1–1.7) for staircase for-
trieved from absorbance spectra (Johnson and Coletti, 2002).       mation under the LIW core (Onken and Brembilla, 2003).
To do so, a version of the algorithm developed by Sakamoto            The detection of thermohaline staircases in the CTD
et al. (2009) has been adapted to the specificity of the           dataset (Sect. 2.1) is carried out by extracting the depth
Mediterranean Sea (Pasqueron de Fomervault et al., 2015).          range of the transition zone for each profile from the salin-
The SUNA sensor underwent offset and gain calibration cor-         ity maximum (LIW) and the salinity minimum (DW) under-
rected by reference measurements at deployment (detailed in        neath 250 dbar. The bulk vertical gradients of temperature
Taillandier et al., 2018); its temporal drift was adjusted to      and salinity are derived from water properties at the top and
a climatological value at 1000 dbar. Overall, a collection of      at the bottom of the transition zone. The resulting bulk den-
144 profiles was acquired in the Tyrrhenian Sea, every 5 to        sity ratio (Rρ ; Eq. 1) is checked to see if it is in the range of
7 d during a period of 2 years, with a vertical nominal resolu-    1–1.7. Following that, the distribution of pairs (salinity, tem-
tion of 10 m in the upper layer (0–250 dbar) and 25 m in the       perature) that belong to the transition zone is evaluated by a
lower layer (250–1000 dbar).                                       rapid hierarchical classification algorithm in order to detect

Biogeosciences, 17, 3343–3366, 2020                                                   https://doi.org/10.5194/bg-17-3343-2020
V. Taillandier et al.: Profiling float observation of thermohaline staircases                                                            3347

Table 1. Selection of CTD profiles collected by five floats in the Algerian Basin and in the Tyrrhenian Sea. Each deployment is labeled using
the World Meteorological Organization (WMO) float number. Left columns: date and cycle number of the first and the last profiles of this
selection. Right columns: number of profiles with staircase detection/total number of profiles (fraction of profiles with staircase detection).

                     WMO float no.      First profile        Last profile             Algerian Basin       Tyrrhenian Sea
                     6901513            9 May 2013 – 0       16 Jun 2015 – 182        116/183 (63 %)       –
                     6901600            23 Aug 2014 – 1      23 Dec 2015 – 101        92/102 (90 %)        –
                     6902732            16 Jan 2017 – 41     18 Dec 2017 – 91         16/51 (31 %)         –
                     6901491            16 Jun 2013 – 0      30 May 2015 – 178        –                    152/179 (85 %)
                     6901769            31 May 2015 – 0      02 May 2017 – 143        –                    102/144 (71 %)
                     Total              9 May 2013           18 Dec 2017              224/336 (67 %)       254/323 (79 %)

                                                                            the percent of profiles with at least one concentration point
                                                                            per profile (reported in Table 1). The continuity of layers
                                                                            is displayed among the shipboard and BGC-Argo datasets
                                                                            by the persistence of some layer properties. Layers are con-
                                                                            ventionally numbered using the fine-structure characteris-
                                                                            tics of the profiles collected during the cruise PEACETIME.
                                                                            Changes in temperature (1θi ) and salinity (1Si ) within ev-
                                                                            ery indexed layer (i) are examined among the BGC-Argo
                                                                            dataset in terms of lateral density ratio:
                                                                            RLi = (α · 1θi )/(β · 1Si ).                                   (3)
                                                                            RLi is determined by least-squares fits of layer distributions
                                                                            in a temperature–salinity diagram normalized by β/α.

                                                                            2.4   Vertical fluxes of nitrate

                                                                            The vertical transfer of nitrate is parameterized as a diffusive
Figure 2. Terminology used to characterize the vertical structure of
typical thermohaline staircases in the study area. The layer number         flux and written as the product of the vertical diffusivity of
(i) and the interface number (i/i + 1) increase downward.                   salts (K) with the vertical gradient in nitrate concentration
                                                                            (C):
                                                                            FNO3 = K · ∂C/∂z.                                              (4)
concentration points representative of mixed layers (Jambu,
1981). A concentration point is identified as a set of succes-              Fluxes of nitrate are mostly driven by turbulent diffusion, but
sive scans in which temperature does not vary by 0.005 ◦ C                  in the presence of thermohaline staircases, the diffusivities of
and salinity does not vary by 0.005. In addition, this set of               nitrate are enhanced by salt fingering in the same manner as
scans must be composed of at least 3 scans for BGC-Argo                     those of salinity (Hamilton et al., 1989). Of consequence for
profiles and 15 scans for shipboard profiles, limiting the de-              the present study, the two mixing processes are considered
tection to layers thicker than 30 and 15 m, respectively. The               separately, turbulent diffusion above LIW and salt fingering
scans belonging to the concentration points are superimposed                below LIW, which implies the utilization of alternative for-
onto the full profile, and the vertical alternation of interfaces           mulations for vertical diffusivities.
and layers is checked by a visual inspection. After this final                 Above LIW across the nitracline, K is equal to the vertical
step, the profile is reported as an observation of staircases.              eddy diffusivity of density, which can be expressed by the
   Several diagnostics are run on the set of profiles with stair-           buoyancy frequency (N),
case detection. The fine-structure characterization includes                N = (−g/ρo · ∂ρ/∂z)1/2 ,                                       (5)
layer properties (i.e., seawater temperature and salinity at ev-
ery validated concentration point), interlayer differences in               and the turbulent kinetic energy dissipation rate (ε), using the
temperature and salinity, associated interlayer density ratios,             Osborn relationship (Osborn, 1980), as
layer thickness (i.e., number of concentration points times                 Kturb = 0 · ε/N 2 ,                                            (6)
vertical resolution of profiles), and interface thickness (i.e.,
depth interval between two adjacent layers). The occurrence                 where g is the gravitational constant, 0 is the mixing effi-
of staircases is estimated among the BGC-Argo dataset by                    ciency and ρo the reference density of seawater. A constant

https://doi.org/10.5194/bg-17-3343-2020                                                            Biogeosciences, 17, 3343–3366, 2020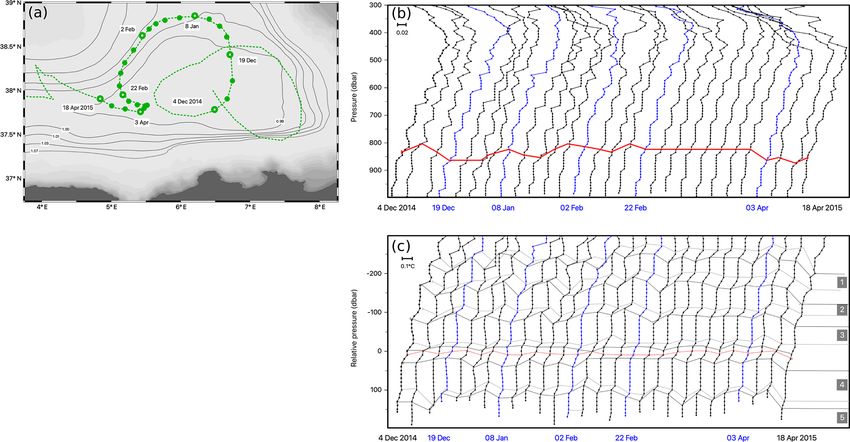
3348                                               V. Taillandier et al.: Profiling float observation of thermohaline staircases

mixing efficiency 0 = 0.2 is applied under the assumption           Table 2. Lookup table for turbulent kinetic energy dissipation rates
that the buoyancy Reynolds number,                                  and vertical eddy diffusivity derived from a Thorpe-scale-based pa-
                                                                    rameterization and applied to the full-resolution CTD profiles of
Reb = ε/ν · N 2 ,                                            (7)    the cruise PEACETIME collected in the Algerian Basin and in the
                                                                    central Tyrrhenian Sea. The methodological approach described by
                                                                    Park et al. (2014) has been strictly followed, by averaging in 50 m
with kinematic viscosity ν = 1.8 × 10⁻⁶ m2 s−1 , remains in
                                                                    bins over the 13 profiles represented in Figs. 3 and 7. For surface
the range 8.5–400 (Bouffard and Boegman, 2013; Ferron et            values (∗ ), the range of estimation proposed by Cuypers et al. (2012)
al., 2017). Substituting Eq. (6) in Eq. (4), the vertical flux of   is used.
nitrate is expressed across isopycnals as the product of ε and
the diapycnal gradient of nitrate concentration:                             Depth interval                              Kturb
                                                                             (dbar)           (10−9 W kg−1 )      (10−5 m2 s−1 )
FNO3 = −0 · ρo /g · ε · ∂C/∂ρ.                               (8)
                                                                             20–100                     6–10∗
                                                                             100–150                7.7 ± 10.4         3.5 ± 4.8
   This formulation is preferred to the one of Eq. (4) because               150–200                 4.6 ± 4.6         6.0 ± 6.0
the temporal consistency in the density–nitrate relationship                 200–250                 4.7 ± 4.4       11.0 ± 10.2
is stronger than in the depth–nitrate relationship (Omand                    250–300                 3.1 ± 1.7        14.0 ± 7.9
and Mahadevan, 2015). There were no direct measurements                      300–350                 3.1 ± 2.3       24.4 ± 18.3
of dissipation rates during the cruise PEACETIME, so we                      350–400                 0.9 ± 0.3         9.6 ± 3.0
rely on estimates from a Thorpe-scale-based parameteriza-
tion to infer ε values from vertical overturns of density (Dil-
lon, 1982). Following Park et al. (2014), the full-resolution       three different formulations. Although they have been ex-
CTD records collected in the Tyrrhenian Sea and the Alge-           tensively reviewed and compared with each other, the mo-
rian Basin (13 casts) have been reprocessed in order to iden-       tivation here is to provide uncertainties in Ksf values. First,
tify density overturns in the depth interval above LIW, com-        the formulation of salt-fingering buoyancy flux proposed by
pute the associated Thorpe scales and reconstruct ε profiles.       Schmitt (1981) can be expressed in terms of diffusivity using
A lookup table composed of ε values averaged over the 13            Eq. (4) as
profiles by 50 dbar vertical intervals is reported in Table 2.
The values inside the surface stratified layer (0–100 dbar)         Ksf = (0.05 + 0.3/Rρ3 ) · (g · kT )1/3 · (β · δS)4/3 /(∂S/∂z), (9)
were too inconsistent to be considered, but the next bin (100–
150 dbar) was kept even though its average value still con-         where kT = 1.4 × 10⁻⁷ m2 s−1 is the molecular diffusivity
tains important uncertainties; in the other bins, ε values de-      of heat, δS the maximum value of interface salinity dif-
crease with depth by 1 order of magnitude with standard de-         ferences, (∂S/∂z) the mean vertical salinity gradient across
viations comparable to the average. Combined with a mean N          the transition layer and Rρ the bulk density ratio given by
profile, there is an increasing turbulent diffusivity Kturb down    Eq. (1). The second formulation was proposed by Radko and
to the LIW depths where its maximum value is reached. For           Smith (2012):
the surface layer (20–100 dbar), the lookup table is comple-
mented with ε values in the range of [6, 10] ×10−9 W kg−1 ,         Ksf = kT · Rρ · (135.7/(Rρ − 1)1/2 − 62.75).                     (10)
as reported by Cuypers et al. (2012) in the same geographical
area. The amplitudes used in the lookup table are in agree-           The third formulation comes from the model of K-profile
ment with microstructure observations collected over several        parameterized diffusivities (Large et al., 1994)
cruises from 2012 to 2014 in the same locations (Ferron et
al., 2017). These direct measurements documented sharply            Ksf = 10−4 · (1 − ((Rρ − 1)/(1.9 − 1))2 )3 , 1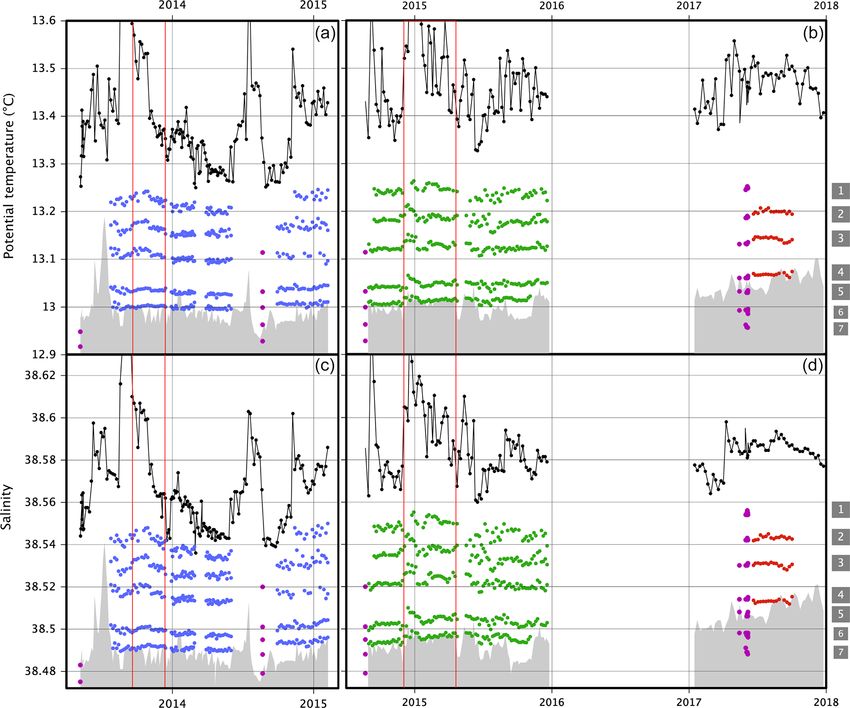
V. Taillandier et al.: Profiling float observation of thermohaline staircases                                                    3349

                                                                       terface temperature–salinity differences: 0.06–0.19 ◦ C and
                                                                       0.02–0.05.
                                                                          The spatiotemporal extensions of observations can be in-
                                                                       ferred from two BGC-Argo deployments that preceded the
                                                                       cruise PEACETIME. This dataset provides continuous ob-
                                                                       servations of the vertical structure in the upper 1000 dbar
                                                                       with a resolution of 1 to 7 d from June 2013 until May 2017
                                                                       (Sect. 2.1, Table 1). Temperature and salinity in the depth
                                                                       range of 300 to 1000 dbar show three stripes with roughly
                                                                       constant properties (Fig. 4). The stripes correspond to a high
                                                                       density of scans indicating well-mixed layers, while lower
                                                                       densities of scans in between the stripes correspond to inter-
                                                                       faces. The temperature and salinity values along these stripes
                                                                       are diagnosed by the detection method (Sect. 2.3) and ana-
                                                                       lyzed together with the layer properties of the central station
                                                                       (Table 3). The quantification of layer and interface thick-
                                                                       nesses can be inaccurate on BGC-Argo profiles because of
                                                                       the limited vertical resolution and the limitation of profil-
                                                                       ing depth (1000 dbar) that may truncate the lowest detected
                                                                       layer. Thus, only the temporal evolution of the layer prop-
Figure 3. Sequence of daily salinity profiles observed in the cen-
tral Tyrrhenian Sea during the cruise PEACETIME over the whole
                                                                       erties (temperature, salinity) should be considered from the
water column. The salinity scale is correct for profile A, and each    BGC-Argo dataset.
subsequent profile is offset by 0.04. The layer numbering in Table 3      As shown in Fig. 4, thermohaline staircases were observed
is indicated by grey boxes at average layer depths.                    almost continuously during the 4-year period of BGC-Argo
                                                                       deployments. The proportion of staircase detection within
                                                                       this collection reaches 79 % (Table 1). This observation ex-
strong reproducibility of the vertical structure. LIW prop-            tends over the southwest sector of the Tyrrhenian Sea up to
erties remain stable at 14.34 ◦ C and 38.82, although with             the Sardinian Channel (Fig. 5a), suggesting a unique struc-
a slight uplift of the salinity maximum (470 dbar at cast              ture spreading from the central area up to the southwest
A, 400 dbar at cast D). DW properties remain equally sta-              border. The obtained vertical structure is in agreement with
ble at 12.98 ◦ C and 38.50 below 2500 dbar. The bulk tem-              the shipboard profiles collected at the station PEACETIME
perature and salinity gradients are similar for all the casts,         and at the float deployment locations 2 and 4 years be-
i.e. 0.00065◦ C m−1 and 0.00015 m−1 , respectively. The bulk           fore (Fig. 5b, upper plot). Two layers appear quasi-persistent
density ratio Rρ is equal to 1.32, which is lower than 1.7, the        with steady properties (Fig. 5b, lower plots). The first one
upper threshold for the development of thermohaline stair-             at 13.65 ◦ C and 38.67 corresponds to layer 3 of the sta-
cases (Sect. 2.3). The transition zone is occupied by mixed            tion PEACETIME (Table 3); the second one at 13.55 ◦ C and
layers of homogeneous properties (variance close to the in-            38.65 corresponds to layer 4. The temperature and salinity
strumental precision) and of thickness ranging from a few              gradients at interface 3/4 are of similar amplitude. In addi-
meters to some hundreds of meters at the metric resolution             tion to the above-mentioned structure, layer 2 was detected
of the profiles. Interface salinity gradients can be sharp or          twice for periods of about 1 year, layer 1 during a period
gradually smoothed by small transient layers that split and            of 6 months and layer 5 during a short period of 3 months.
merge during the 4 d of observation. For example, between              As a result, changes on the top of the transition zone can re-
cast C and cast D (Fig. 3), the transient layers disappeared           duce the number of layers, when LIW are fresher and cooler
from the interface at 1250 dbar and appeared in the interface          (second half of 2015), or increase the number of layers,
at 1700 dbar; meanwhile the layer in between was lifted by             when LIW become warmer and saltier (second half of 2016).
about 20 dbar.                                                         Changes in the average depth of a layer similarly modulate
   As reported in Table 3, the layer and interface thickness           the number of layers, due to vertical shifts of the whole struc-
could fluctuate by up to 17 m during the 4 d of observation            ture (Fig. 5b).
(a sign of active convection), while the temperature–salinity
characteristics remained stable. The amplitude of the inter-           3.2   Observation of staircases in the Algerian Basin
face temperature–salinity differences increased with depth
until reaching 956 dbar (interface 4/5) and then decreased             The CTD dataset in the Algerian Basin (Fig. 6) covers most
progressively. The three main layers (5, 6, 7) were located            of the abyssal plain where thermohaline staircases are able
between 983 and 1871 dbar, with thicknesses ranging be-                to develop (Krahmann, 1997; Bryden et al., 2014). It is com-
tween 184 and 332 m. They were associated with large in-               posed of a zonal transect of coarse spatial resolution between

https://doi.org/10.5194/bg-17-3343-2020                                                       Biogeosciences, 17, 3343–3366, 2020
3350                                                 V. Taillandier et al.: Profiling float observation of thermohaline staircases

Table 3. Characteristics of the staircases in the Tyrrhenian Sea, extracted from the four casts carried out during the PEACETIME cruise
(Fig. 3). The selected layers are thicker than 15 m. The layer numbering increases with depth. Parameters are presented as the average value
and standard deviation over the four casts A–D.

  Layer       Depth interval          Layer           Layer              Layer     Interface         Interface        Interface       Density
                 (dbar)           thickness      temperature           salinity   thickness       temperature           salinity        ratio
               Top      Bottom          (m)             (◦ C)                           (m)    difference (◦ C)      difference
  1        614 ± 3      660 ± 1      46 ± 2   13.862 ± 0.000    38.720 ± 0.000
                                                                                      4±1       0.079 ± 0.000     0.017 ± 0.000    1.38 ± 0.03
  2        664 ± 2      728 ± 3      64 ± 3   13.784 ± 0.001    38.703 ± 0.000
                                                                                    14 ± 4      0.134 ± 0.001     0.031 ± 0.000    1.32 ± 0.03
  3        741 ± 6      821 ± 8      80 ± 9   13.650 ± 0.001    38.672 ± 0.000
                                                                                      6±2       0.096 ± 0.001     0.022 ± 0.000    1.31 ± 0.03
  4        827 ± 8      956 ± 8     129 ± 5   13.554 ± 0.001    38.650 ± 0.000
                                                                                    28 ± 6      0.192 ± 0.001     0.047 ± 0.000    1.26 ± 0.01
  5        983 ± 3    1259 ± 15    276 ± 14   13.362 ± 0.000    38.603 ± 0.000
                                                                                   56 ± 10      0.147 ± 0.001     0.038 ± 0.000    1.20 ± 0.00
  6       1314 ± 7     1647 ± 8     332 ± 1   13.216 ± 0.000    38.565 ± 0.000
                                                                                    40 ± 9      0.063 ± 0.001     0.018 ± 0.000    1.14 ± 0.03
  7       1687 ± 7     1871 ± 5     184 ± 8   13.153 ± 0.000    38.547 ± 0.000
                                                                                    78 ± 8      0.054 ± 0.001     0.015 ± 0.000    1.16 ± 0.03
  8       1948 ± 9    2033 ± 20     85 ± 13   13.099 ± 0.000    38.532 ± 0.000
                                                                                   35 ± 15      0.022 ± 0.000     0.006 ± 0.000    1.20 ± 0.02
  9       2067 ± 8    2167 ± 17    100 ± 14   13.077 ± 0.000    38.526 ± 0.000
                                                                                   32 ± 16      0.021 ± 0.000     0.007 ± 0.000    1.19 ± 0.03
  10      2199 ± 8    2275 ± 18     76 ± 17   13.056 ± 0.000    38.519 ± 0.000

1 and 8◦ E and three BGC-Argo float deployments inside the              during the first days of observation. The structure was eroded
central basin with an average speed of 4 km d−1 (with a max-            in the last days (casts F–G), probably due to the growing in-
imum at 10 km d−1 ), twice as fast as the floats in the Tyrrhe-         fluence of a mesoscale eddy sampled at the westernmost sta-
nian Sea. Such large drifts at 1000 dbar can be attributed to           tion (deeper LIW in cast A) progressively moving eastwards
a vigorous basin-scale barotropic circulation, characterized            at that time.
by two permanent cyclonic gyres and delineated by closed                   Despite the spatial and short-scale temporal fluctuations,
f/H contours (Testor et al., 2005). The area of staircase de-           the bulk temperature and salinity gradients remained similar
tection (67 % of the profiles; Table 1) seems to be shaped by           for all the central casts, 0.00060◦ C m−1 and 0.00013 m−1 ,
the barotropic circulation leading to staircase formation pri-          respectively, as did the bulk density ratio Rρ (equal to 1.38).
marily inside the so-called Algerian gyres – more precisely             The transition zone was layered quasi-evenly, with six in-
inside the box 37◦ 20’ N–38◦ N, 4–6◦ E – whereas staircases             terfaces of about 0.05 ◦ C in temperature and 0.01 in salinity
were more sporadic everywhere else.                                     (Table 4). The largest interface 3/4 separated the two thickest
   During the PEACETIME cruise, four stations were car-                 layers (both about 70 m). Interlayer density ratios decrease
ried out along the 38◦ N parallel with nine casts, including            from 1.4 to 1.25, with a major variation at the interface 3/4.
six daily casts repeated at one station (Fig. 7). Thermoha-                The spatiotemporal extensions of this observation were in-
line staircases were observed at every station, in the tran-            ferred from three BGC-Argo deployments that preceded the
sition zone from the LIW (300–500 dbar) down to the DW                  cruise (Sect. 2.1). Two separate periods were sampled: from
(1400 dbar). They exhibited well-ordered steps and layers in            May 2013 to January 2016 and again during the whole of
the middle of the transect (casts B–H), with saltier LIW in             2017 (Table 1). The temperature and salinity scans in the
cast H, while the profiles at the edges show no readily ap-             depth range of 300 to 1000 dbar show clear stripes over sev-
parent pattern. In the latter casts (A and I), temperature and          eral periods lasting some months (Fig. 8). In other periods
salinity profiles within the layers are inverted, indicating lat-       of a similar duration, steps were less marked, with a denser
eral intrusions of heat and salt along isopycnals. At the sta-          concentration of scans between stripes. The continuity of the
tion with repeated casts (B–G), the largest steps were gradu-           layers (stripes) is less clear than in the Tyrrhenian Sea, and
ally smoothed by small transient layers that split and merged

Biogeosciences, 17, 3343–3366, 2020                                                            https://doi.org/10.5194/bg-17-3343-2020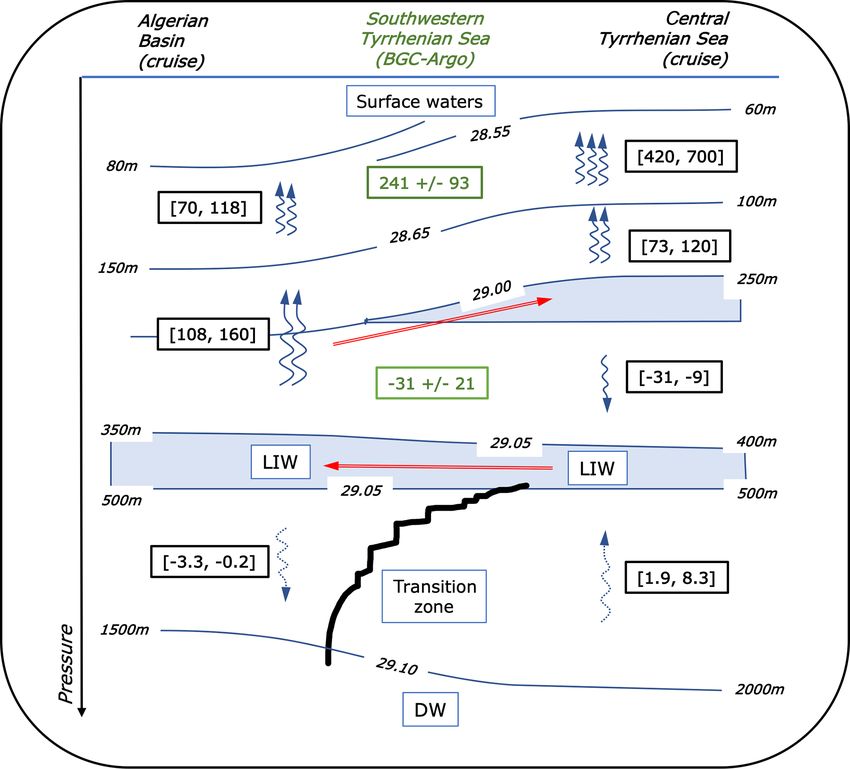
V. Taillandier et al.: Profiling float observation of thermohaline staircases                                                                3351

Figure 4. Temperature (a) and salinity (b) recorded between 300 and 1000 dbar at a vertical resolution of 10 dbar, by the consecutive
deployments of floats 6901491 and 6901769 in the Tyrrhenian Sea. On the x axis, the number of successive profiles for each float with a
resolution of 1 to 7 d is indicated. The years of deployment are indicated by the vertical lines.

Table 4. Characteristics of the staircases in the Algerian Basin, extracted from the nine casts carried out during the PEACETIME cruise
(Fig. 7). The selected layers are thicker than 15 m. The layer numbering increases with depth. Parameters are presented as the average value
and standard deviation over the nine casts A–I.

  Layer        Depth interval            Layer            Layer            Layer     Interface         Interface        Interface       Density
                   (dbar)             thickness      temperature          salinity   thickness       temperature          salinity         ratio
                                            (m)            (◦ C)              (m)                difference (◦ C)      difference
  1        611 ± 21     636 ± 17        25 ± 8    13.249 ± 0.003   38.555 ± 0.001
                                                                                       33 ± 6     0.062 ± 0.002     0.013 ± 0.001    1.42 ± 0.04
  2        669 ± 18     713 ± 15       44 ± 10    13.188 ± 0.001   38.542 ± 0.000
                                                                                       32 ± 8     0.054 ± 0.002     0.012 ± 0.001    1.37 ± 0.05
  3        744 ± 21     807 ± 13       63 ± 12    13.133 ± 0.002   38.530 ± 0.001
                                                                                      48 ± 13     0.072 ± 0.001     0.016 ± 0.000    1.31 ± 0.02
  4        850 ± 16         923 ± 8    74 ± 15    13.061 ± 0.002   38.514 ± 0.000
                                                                                      41 ± 12     0.030 ± 0.001     0.007 ± 0.001    1.23 ± 0.09
  5        965 ± 12         999 ± 4    35 ± 11    13.031 ± 0.003   38.507 ± 0.001
                                                                                       35 ± 9     0.039 ± 0.001     0.009 ± 0.001    1.25 ± 0.06
  6        1034 ± 9    1101 ± 23       67 ± 25    12.992 ± 0.001   38.498 ± 0.001
                                                                                      45 ± 26     0.034 ± 0.002     0.008 ± 0.001    1.24 ± 0.07
  7       1154 ± 13    1193 ± 30       39 ± 29    12.957 ± 0.003   38.489 ± 0.001

https://doi.org/10.5194/bg-17-3343-2020                                                              Biogeosciences, 17, 3343–3366, 2020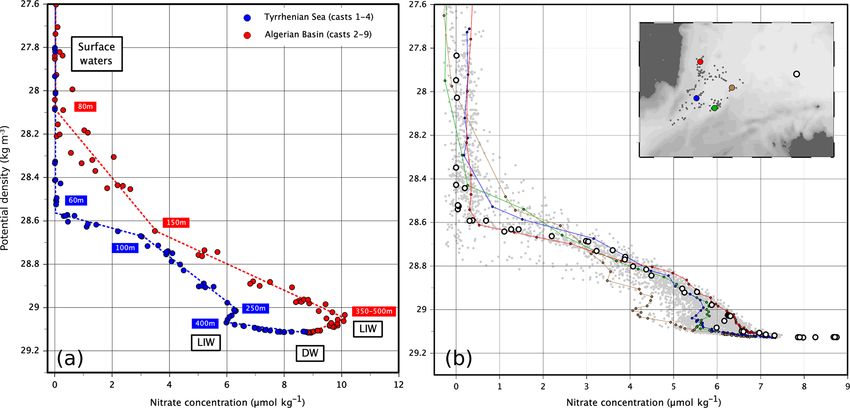
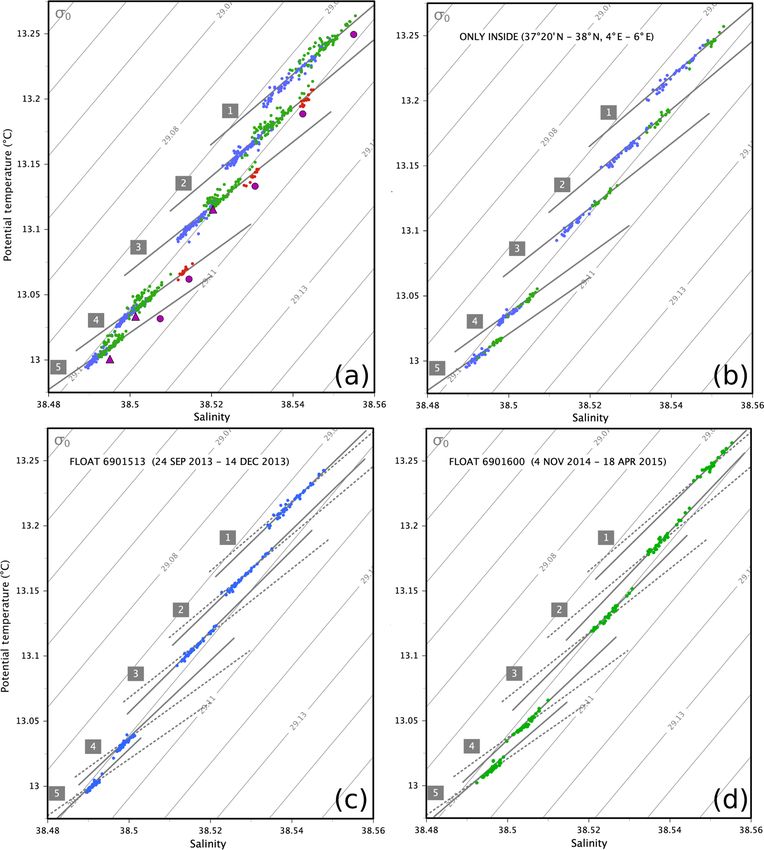
3352                                                    V. Taillandier et al.: Profiling float observation of thermohaline staircases

Figure 5. (a) Location of staircase detected along the trajectory of the consecutive floats deployed in June 2013 and May 2015. (b) Time
series of layer properties and depth (colored dots) of shipboard and float profiles with staircases. LIW properties and depth are indicated in
black lines. Grey shadows indicate the depth ranges below 1000 dbar. The layer numbering of the station PEACETIME (Table 3) is indicated
inside the grey boxes. In all panels, station locations and layer properties are indicated in purple for shipboard profiles, blue for float 6901491
and green for float 6901769.

the sharpness of the steps is more variable (depicted in Fig. 8                During the first episode lasting 3 months, float 6901513
by different densities of scan concentration between stripes).              drifted eastwards profiling every 20 km, along a 250 km
   The layer properties have been diagnosed by the staircase                zonal transect around the 37◦ 300 N parallel (Fig. 10a). In con-
detection method (Sect. 2.3). Their evolution is depicted con-              trast with the middle of the transect, the profiles appear jum-
sidering the shipboard CTD and BGC-Argo datasets (Fig. 9).                  bled at the eastern and western edges (Fig. 10b), indicating a
The profiles collected by the floats, although limited to                   disruption of the layers as consequence of lateral intrusions.
1000 dbar, can provide an observation of most of the ver-                   These local inversions among layers reflect the changes in
tical structure (the first five layers of the seven reported in             layer properties reported above (Fig. 9). Changes in layer and
Table 4). They reveal the reproducibility of the layering pat-              interface thicknesses can be more clearly seen from profiles
tern over years, in continuity with the patterns documented                 aligned at the depth of the interface 3/4 (Fig. 10c). Staircases
in their vicinity by ship surveys. Moreover, gradients at the               appear well developed in the middle of the transect: steps are
largest interface 3/4 are in agreement with the values from                 sharper and layers are thicker than at the edges, showing a
PEACETIME stations (Table 4), about 0.07 ◦ C in tempera-                    small transient layer splitting the interface 3/4. This observa-
ture and 0.02 in salinity. Layer properties changed as tem-                 tion suggests well-ordered thermohaline staircases confined
perature and salinity of LIW increased, as suggested by the                 inside an epicentral region between 4◦ 150 and 5◦ 300 E merid-
two episodes delimited by the red lines in Figs. 8 and 9.                   ians.

Biogeosciences, 17, 3343–3366, 2020                                                              https://doi.org/10.5194/bg-17-3343-2020
V. Taillandier et al.: Profiling float observation of thermohaline staircases                                                     3353

Figure 6. Locations of the CTD profiles in the Algerian Basin. The large dots mark the positions where staircases were detected. Float
6901513 deployment is indicated in blue, 6901600 in green and 6902732 in red. Shipboard stations during float deployments and the cruise
PEACETIME are indicated in purple. Thin black lines: contours f/H normalized by fo at 37◦ 450 N and Ho = 2800 m.

                                                                        the neighborhood of the position 37◦ 450 N, 5◦ 200 E. As men-
                                                                        tioned earlier, local inversions within layers are associated
                                                                        with changes in layer properties (Fig. 9b, d) that intensify
                                                                        with distance to the position 37◦ 450 N, 5◦ 200 E, documenting
                                                                        the development of lateral intrusions in the surrounding area.
                                                                           The two episodes detailed the spatial extension sketched
                                                                        out in Fig. 6, with active well-ordered thermohaline stair-
                                                                        cases confined inside the eastern Algerian gyre and their pro-
                                                                        gressive erosion all around. Moreover, these episodes con-
                                                                        firmed the connection between layers of fluctuating proper-
                                                                        ties and their continuity over the whole period of observa-
                                                                        tion (suggested in Figs. 8 and 9). The layer properties in a
                                                                        temperature–salinity diagram are aggregated by layer along
                                                                        separate lines (Fig. 12a). Floats and cruises records are dis-
                                                                        tributed from the oldest to the newest along these lines, with
                                                                        the temporal succession starting with float 6901513 (blue),
                                                                        followed by SOMBA-GE (purple triangles), float 6901600
Figure 7. Sequence of salinity profiles along a zonal transect with
                                                                        (green), PEACETIME (purple dots) and float 6902732 (red).
four stations across the Algerian Basin during the PEACETIME
                                                                        As a result, these lines document interannual trends, as the
cruise. The second station was repeated six times (casts B–G). The
casts were performed from the surface to the bottom, except cast B      five connected layers become warmer (by about 0.06 ◦ C) and
(down to 2500 dbar) and cast G (down to 1000 dbar). The salinity        saltier (by about 0.02) during the 4 years of observation.
scale is correct for profile A, and each subsequent profile is offset      The changes in layer properties in terms of the lateral den-
by 0.025. The layer numbering of Table 4 is indicated by grey boxes     sity ratio as expressed in Eq. (3) and estimated from the slope
at the average layer depths.                                            of layer distributions in the temperature–salinity diagrams
                                                                        (Sect. 2.3) are reported in Table 5. Considering the whole
                                                                        period, each layer is distributed along a line crossing isopyc-
                                                                        nals as a composite of segments nearly parallel to isopycnals
   During the second episode lasting 4 months, float 6901600
                                                                        (Fig. 12a). The gross lateral density ratio associated with this
completed a cyclonic gyration, profiling every 10 km along
                                                                        distribution is in the range of 0.65–0.78, with an average of
a path of a 60 km radius inside the eastern Algerian gyre
                                                                        0.72. In each episode considered separately, the distribution
(Fig. 11a). Lateral intrusions were found in most of the area
                                                                        of layer properties is encapsulated in single segments with
surveyed by the float until 22 February 2015 (Fig. 11b), cov-
                                                                        slopes closer to isopycnals (Fig. 12c, d). Lateral density ra-
ering the sector north of 38◦ 100 N and east of 5◦ 400 E. In
                                                                        tios are in the range of 0.89 to 0.93 for the first episode and
contrast, the layering is well defined in profiles collected in

https://doi.org/10.5194/bg-17-3343-2020                                                        Biogeosciences, 17, 3343–3366, 2020
3354 V. Taillandier et al.: Profiling float observation of thermohaline staircases
Figure 8. Temperature (a–c) and salinity (d–f) recorded between 300 and 1000 dbar with a vertical resolution of 10 dbar, by the three floats
6901513 (a, d), 6901600 (b, e) and 6902732 (c, f) deployed in the Algerian Basin. Values on the x axis correspond to the number of the
successive profiles with a temporal resolution of 1 to 7 d. The timeframe (in trimesters) is superimposed on top of the x axis. The two episodes
described in the text (Sect. 3.2) are delimited by red vertical lines.
0.82 to 0.98 for the second episode, with an average of 0.91 gerian station (salinity 38.6 at 450 dbar). The three interme-
in both episodes. Given the short timescale of each episode diate stations have transitional properties, reaching 38.7 in
(3–4 months), these ratios are inferred by changes in layer salinity southwest of Sardinia. Nitrate concentrations follow
properties attributed to spatial variations, in agreement with an inverse trend as compared to salinity: profiles at the five
the previous descriptions of the episodes. In the epicentral re- stations are clearly differentiated below 250 dbar, showing
gion, the distribution extends along lines crossing isopycnals inflow of low-nutrient waters from the Ionian Sea to the east-
(Fig. 12b). Lateral density ratios are in the range of 0.74 to ern Tyrrhenian (same nitrate values at 450 dbar) and their
0.83, with an average of 0.80. This ratio is the result of the progressive enrichment until reaching the Algerian Basin.
interannual trend in the relative changes between layer tem- In the central Tyrrhenian Sea and Algerian Basin where
perature and layer salinity. As detailed further in Sect. 4.3, thermohaline staircases occur (Fig. 14a), the sunlit surface
these estimations of lateral density ratios assume water mass layers were equally depleted at this time of the year, while
conversion within thermohaline staircases driven by two dis- the nutrient stocks were similar in the DW with nitrate
tinct processes, one acting at large spatial scales and the other concentrations of about 8.7 µmol kg−1 . Differences occur
at large temporal scales. in the transition zone: in the Algerian Basin, nitrate con-
centrations slightly decrease by 0.7 µmol kg−1 over a depth
3.3 Estimation of nitrate fluxes in presence of range of 500–1500 dbar towards their DW concentrations,
thermohaline staircases while in the Tyrrhenian Sea nitrate concentrations increase
by 2.3 µmol kg−1 over a depth range of 500 to 2000 dbar.
The large-scale nutrient distribution in the LIW, based on Another major difference between the two basins appears in
nitrate profiles collected during the PEACETIME cruise in the depth extension of the nitracline. In the Algerian Basin,
May–June 2017, shows a progressive increase along its path- the base of the nitracline is within the LIW (350–500 dbar),
way from the Ionian Sea to the Algerian Basin (Fig. 1). The where nitrate concentrations reach their maximum value, fol-
LIW enrichment is particularly significant in the Tyrrhenian lowed by a decrease towards DW values. In the Tyrrhenian
Sea, with an increase of 2 µmol kg−1 in nitrate concentration Sea, the nitracline instead extends to 250 dbar, nitrate con-
between the eastern Tyrrhenian station and the southwest- centrations reach a local maximum above the LIW, and they
ern Sardinian station. This observation is analyzed using five slightly decrease inside the LIW core where the salinity max-
contrasted stations selected along the LIW pathway (Fig. 13). imum is found at 400 dbar.
Saltier LIW are found in the Ionian station (higher than 38.9) The S-shape delineated by the nitrate profile between
at 200 dbar depth, whereas fresher LIW are found in the Al- LIW and the nitracline marks the isopycnal inflow inside
Biogeosciences, 17, 3343–3366, 2020 https://doi.org/10.5194/bg-17-3343-2020V. Taillandier et al.: Profiling float observation of thermohaline staircases 3355
Figure 9. Time series of properties (colored dots) of shipboard and float profiles for detected staircase layers. Temperature is shown in
panels (a–b) and salinity in panels (c–d). LIW properties are indicated by the black lines. The shipboard CTD profiles are indicated in purple
and the float CTD profiles in blue (float 6901513), green (float 6901600) and red (float 6902732). Grey shadows indicate the depth ranges
below 1000 dbar. Time series of floats 6901513 (a, c) and 6901600 (b, d) are represented in different panels to avoid overlapping. The layer
numbering for the stations PEACETIME (Table 4) is indicated inside the grey boxes on the right. The two episodes described in the text
(Sect. 3.2) are delimited by red vertical lines.
Table 5. Lateral density ratios (RL i ; Eq. 3) defined by the changes in temperature and salinity within each layer (i). Ratios computed
considering the whole dataset (Fig. 12a), the selection inside the box (37◦ 20–38◦0 N, 4–6◦ E; Fig. 12b) and the two episodes (Fig. 12c and
d). Average values over the five layers also reported.
Layer All datasets Inside box (37◦ 200 –38◦0 N, Float 6901513 Float 6901600
May 2013–Dec 2017 4◦ –6◦ E) Sep 2013–Dec 2013 Nov 2014–Apr 2015
1 0.78 0.82 0.89 0.91
2 0.77 0.83 0.90 0.98
3 0.73 0.83 0.93 0.94
4 0.67 0.76 0.90 0.89
5 0.65 0.74 0.91 0.82
Average 0.72 0.80 0.91 0.91
the Tyrrhenian Sea of the nutrient-poor waters from the Io- tribution, with a decrease in nitrate concentrations down to
nian Sea. Float 6901769 documented this feature during the 4 µmol kg−1 along the isopycnal 29. Moving west towards
2 years preceding the cruise (Fig. 14b). The S-shape ap- the Sardinian Channel, the minimum reaches 5.6 µmol kg−1 .
pears as a persistent feature in the southwest sector of the In the central Tyrrhenian Sea, the minimum increases to
basin, with variable amplitude depending on the location. It 6 µmol kg−1 . Along the eastern Sardinian coast, the nitrate
is pronounced in the southeasternmost profiles of the dis- profile shows only a slight inflexion at 6.5 µmol kg−1 . In
https://doi.org/10.5194/bg-17-3343-2020 Biogeosciences, 17, 3343–3366, 20203356 V. Taillandier et al.: Profiling float observation of thermohaline staircases Figure 10. Drift trajectory (a) and successive profiles of temperature (b) and salinity (c) collected by float 6901513 between 24 Septem- ber 2013 and 14 December 2013, with a vertical resolution of 10 dbar. Temperature profiles are shifted by 0.1 ◦ C, salinity profiles by 0.02. Values on the y axis correspond to the pressure referenced to the surface (b) or to the relative pressure referenced to the interface 3/4 indicated by the red line (c). Figure 11. Drift trajectory (a) and successive profiles of temperature (b) and salinity (c) collected by float 6901600 between 4 December 2014 and 18 April 2015, with a vertical resolution of 10 dbar. Temperature profiles are shifted by 0.1 ◦ C, salinity profiles by 0.02. Values on the y axis correspond to the pressure referenced to the surface (b) or to the relative pressure referenced to the interface 3/4 indicated by the red line (c). Biogeosciences, 17, 3343–3366, 2020 https://doi.org/10.5194/bg-17-3343-2020
V. Taillandier et al.: Profiling float observation of thermohaline staircases                                                                 3357

Figure 12. Temperature–salinity diagram of the layers. Colored dots correspond to the different floats in blue (6901513), green (6901600)
and red (6902732); stations PEACETIME in 2017 are given by the purple circles, station SOMBA-GE in 2014 by the purple triangles. Layer
numbers are similar to those in Table 4. The least-squares fit for each layer is indicated by the grey lines. Whole dataset (a), selection inside
the box (37◦ 200 –38◦0 N, 4◦ –6◦ E) (b), and the two episodes (c, d). The least-squares fit in (a) is reported in (c) and (d) with the dotted lines.

summary, the Ionian water inflow gradually impacts the nu-                  poral inhomogeneities are found which affect only the sur-
trient distribution above LIW. This will be further discussed               face layer; (iii) using data collected by float 6901769, with
in connection to the LIW circulation pathway in Sect. 4.4.                  a broader range (see Fig. 5) but less accurate nitrate mea-
   In order to quantify the roles played by thermohaline stair-             surements (Sect. 2.2). In the two first cases, diapycnal ni-
cases or Ionian–Algerian inflows on LIW nutrient distribu-                  trate fluxes are computed using parameterizations detailed
tion, the vertical transfers of nitrate were estimated on three             in Sect. 2.4; stages of computation and results are reported
distinct approaches and locations: (i) the central Tyrrhenian               in Table 6. In the case of float data, only diapycnal fluxes
station of the cruise PEACETIME, with four casts at the                     above the LIW were estimated using a similar procedure as
same location providing a snapshot of density and nitrate                   for the other estimates (Table 6). An average nitrate flux has
concentrations, each measured with high accuracy; (ii) the                  been estimated using 98 % of the float-based profiles, yield-
Algerian stations of the cruise, in which spatial and tem-                  ing 241 ± 93 µmol m−2 d−1 upward through the nitracline,

https://doi.org/10.5194/bg-17-3343-2020                                                                Biogeosciences, 17, 3343–3366, 2020
You can also read