Progress against the national target of 30% of Australia's wastewater being recycled by 2015 - Report prepared for the Department of ...
←
→
Page content transcription
If your browser does not render page correctly, please read the page content below
Progress against the national target of 30% of
Australia’s wastewater being recycled by 2015

Report prepared for the Department of Sustainability,
Environment, Water, Population and Communities
(DSEWPaC)

MARSDEN JACOB   ASSOCIATES

Marsden Jacob Associates
Financial & Economic Consultants

ABN 66 663 324 657
ACN 072 233 204

Internet: http://www.marsdenjacob.com.au
E-mail: economists@marsdenjacob.com.au

Melbourne office:
Postal address: Level 3, 683 Burke Road, Camberwell
Victoria 3124 AUSTRALIA
Telephone: +61 3 9882 1600
Facsimile: +61 3 9882 1300

Brisbane office:
Level 14, 127 Creek Street, Brisbane
Queensland, 4000 AUSTRALIA
Telephone: +61 7 3229 7701
Facsimile: +61 7 3229 7944

Canberra office:
Unit 10, 11 Mackay Gardens, Turner
ACT 2612, AUSTRALIA
Telephone: +61 2 6247 6549

Perth office:
Level 1, 220 St Georges Terrace, Perth
Western Australia, 6000 AUSTRALIA
Telephone: +61 8 9324 1785
Facsimile: +61 8 9322 7936

Sydney office:
Hunters Hill, New South Wales, 2110 AUSTRALIA,
Telephone: 0418 765 393

Authors: Kym Whiteoak, Phil Jones, Phil Pickering
         +61 3 9882 1600
         kwhiteoak@marsdenjacob.com.au

This report has been prepared in accordance with the scope of services described in the contract or agreement between
Marsden Jacob Associates Pty Ltd ACN 072 233 204 (MJA) and the Client. Any findings, conclusions or recommendations only
apply to the aforementioned circumstances and no greater reliance should be assumed or drawn by the Client. Furthermore,
the report has been prepared solely for use by the Client and Marsden Jacob Associates accepts no responsibility for its use by
other parties.

  MARSDEN JACOB                 ASSOCIATES

The views and opinions expressed in this publication are those of the authors and do not necessarily reflect those of the
Australian Government or the Minister for Sustainability, Environment, Water, Population and Communities. While
reasonable efforts have been made to ensure that the contents of this publication are factually correct, the Commonwealth
does not accept responsibility for the accuracy or completeness of the contents, and shall not be liable for any loss or damage
that may be occasioned directly or indirectly through the use of, or reliance on, the contents of this publication.

© Commonwealth of Australia 2012
This work is copyright. Apart from any use as permitted under the Copyright Act 1968, no part may be reproduced by any
process without prior written permission from the Commonwealth. Requests and enquiries concerning reproduction and
rights should be addressed to Department of Sustainability, Environment, Water, Populations and Communities, Public
Affairs, GPO Box 787 Canberra ACT 2601 or email public.affairs@environment.gov.au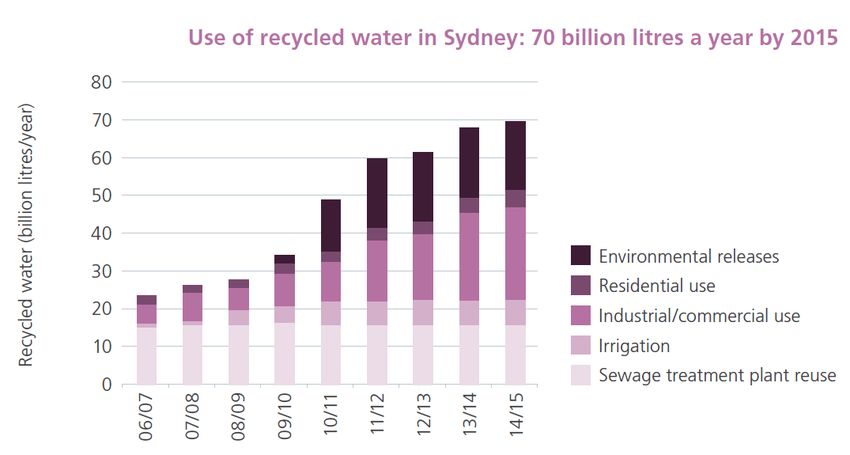
TABLE OF CONTENTS
                                                                                                                                                Page

Executive Summary .............................................................................................................. 1

1     Introduction ................................................................................................................ 10
      1.1      Project scope ..............................................................................................................................11
      1.2      Report structure ........................................................................................................................ 12

2     Water Recycling in Australia ......................................................................................... 13
      2.1      Recycled water in Australian water supply planning ....................................................................13
      2.2      The national picture – current and expected water recycling in Australia to 2015 .........................15
      2.3      National recycled water themes................................................................................................. 19
      2.4      Stormwater recycling ................................................................................................................ 21

3     New South Wales ........................................................................................................ 23
      3.1      Discussion ................................................................................................................................. 23
      3.2      NSW water recycling 2009/10 .................................................................................................... 24
      3.3      NSW progress against the Commonwealth target to 2015 ......................................................... 26
      3.4      Stormwater reuse in NSW ......................................................................................................... 29

4     Victoria ....................................................................................................................... 30
      4.1      Discussion ................................................................................................................................. 30
      4.2      Victorian water recycling 2009/10 .............................................................................................. 30
      4.3      Victorian progress against the Commonwealth target to 2015 ....................................................35
      4.4      Stormwater reuse in Victoria ..................................................................................................... 38

5     Queensland ................................................................................................................. 39
      5.1      Discussion ................................................................................................................................. 39
      5.2      QLD water recycling 2009/10 ..................................................................................................... 40
      5.3      QLD progress against the Commonwealth target to 2015 .......................................................... 43
      5.4      Stormwater reuse in Queensland ............................................................................................... 46

6     South Australia ........................................................................................................... 47
      6.1      Discussion ..................................................................................................................................47
      6.2      SA water recycling 2009/10 ........................................................................................................ 48
      6.3      SA progress against the Commonwealth target to 2015 ..............................................................51
      6.4      Stormwater reuse in SA ..............................................................................................................51

7     Western Australia ........................................................................................................ 54
      7.1      Discussion ................................................................................................................................. 54
      7.2      WA water recycling 2009/10 ...................................................................................................... 55
      7.3      WA progress against the Commonwealth target to 2015 ............................................................ 56
      7.4      Stormwater reuse in WA ............................................................................................................ 58

8     Tasmania .................................................................................................................... 59
      8.1      Discussion ................................................................................................................................. 59
      8.2      Tasmanian water recycling 2009/10 ........................................................................................... 60
      8.3      Tasmanian progress against the Commonwealth target to 2015 ................................................ 61
      8.4      Stormwater reuse in Tasmania .................................................................................................. 61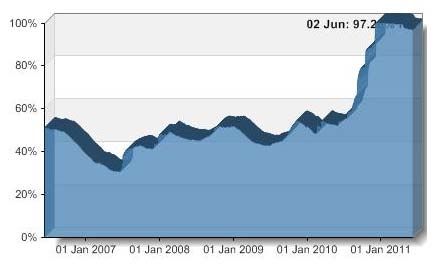
9      Northern Territory ....................................................................................................... 62
       9.1       Discussion ................................................................................................................................. 62
       9.2       NT water recycling 2009/10 ....................................................................................................... 62
       9.3       NT progress against the Commonwealth target to 2015 ............................................................. 63
       9.4       Stormwater reuse in the Northern Territory ............................................................................... 64

10     Australian Capital Territory .......................................................................................... 65
       10.1      Discussion ................................................................................................................................. 65
       10.2      ACT water recycling 2009/10 ..................................................................................................... 66
       10.3      ACT progress towards the Commonwealth target to 2015 ..........................................................67
       10.4      ACT Stormwater reuse .............................................................................................................. 68

11     Opportunities to enhance recycled water use in Australia .............................................. 70
       11.1      Excess recycled water capacity ...................................................................................................70
       11.2      Demand for recycled water – Indirect Potable Reuse (IPR) ..........................................................72
       11.3      Identification of recycled water projects ..................................................................................... 73

LIST OF TABLES

                                                                                                                                                        Page

Table 1: Desalination plants by location and volume ....................................................................................... 14
Table 2: Wastewater and stormwater recycling targets by location ................................................................. 15
Table 3: 2015 projections from current report, compared to 2008 report ......................................................... 19
Table 4: Melbourne recycled water volumes supplied as a percentage of total sewage flows ........................... 33
LIST OF FIGURES
Page
Figure 1: Australian wastewater recycling 2009/10, by capital cities and rest of Australia (ML/year) ................... 1
Figure 2: Australian wastewater recycling 2009/10, by jurisdiction (ML/year) .................................................... 2
Figure 3: Expected Australian wastewater recycling by jurisdiction, 2015 (ML/year) .......................................... 3
Figure 4: 2009/10 recycled wastewater volumes and augmentations to 2015 by capital city and rest of
jurisdiction (ML/year) ....................................................................................................................................... 4
Figure 5: Current and expected wastewater recycling by 2015, by use (ML/year) ............................................... 5
Figure 6: Projected supplies of recycled water compared to capacity, 2015 (ML/year) ....................................... 7
Figure 7: Expected stormwater recycling capacity by 2015, by jurisdiction (ML/year) ......................................... 8
Figure 8: Australian wastewater recycling 2009/10, by capital cities and rest of Australia (ML/year)................. 16
Figure 9: Australian wastewater recycling 2009/10, by jurisdiction (ML/year) .................................................. 16
Figure 10: Expected Australian wastewater recycling by jurisdiction, 2015 (ML/year) .......................................17
Figure 11: 2009/10 recycled wastewater volumes and augmentations to 2015 by capital city and rest of
jurisdiction (ML/year) ..................................................................................................................................... 18
Figure 12: Current and expected wastewater recycling by 2015, by use (ML/year) ........................................... 20
Figure 13: Current and expected wastewater recycling by 2015, by use (ML/year) ............................................ 22
Figure 14: NSW wastewater recycling volumes and proportions, 2009/10 (ML/year)........................................ 24
Figure 15: Sydney wastewater recycling by use, 2009/10 (ML/year) ................................................................. 25
Figure 16: NSW non-metropolitan wastewater recycling by use, 2009/10 (ML/year) ........................................ 26
Figure 17: Wastewater Recycling – Sydney Metropolitan Region ..................................................................... 27
Figure 18: Sydney wastewater recycling growth to 2015 (ML/ year)................................................................. 28
Figure 19: Expected NSW recycling and implicit Commonwealth target (ML/year) .......................................... 29
Figure 20: Victorian wastewater recycling volumes and proportions, 2009/10 (ML/year) ................................. 31
Figure 21: Melbourne wastewater recycling by use, 2009/10 (ML/year) ........................................................... 32
Figure 22: Planned and actual recycled water, Western Water, 2004/05 to 2014/15 ......................................... 34
Figure 23: Wastewater recycled 2009-10 – Regional Victorian Water Authorities (ML/year) ............................. 35
Figure 24: Melbourne wastewater recycling to 2015 (ML/year) ........................................................................ 36
Figure 25: Wastewater recycled to 2015 – non-Melbourne Victorian water authorities (ML/year) .....................37
Figure 26: Expected Victorian recycling and implicit Commonwealth target (ML/year).................................... 38
Figure 27: Queensland wastewater recycling volumes and proportions, 2009/10 (ML/year) ............................. 40
Figure 28: SEQ wastewater recycling by use, 2009/10 (ML/year) ..................................................................... 42
Figure 29: Regional QLD wastewater recycling by use, 2009/10 (ML/year) ...................................................... 43
Figure 30: SEQ wastewater recycling to 2015 (ML/year) .................................................................................. 44
Figure 31: Wastewater recycled to 2015 – rest of Queensland (ML/year).......................................................... 45
Figure 32: Expected Queensland recycling and implicit Commonwealth target (ML/year) ............................... 45
Figure 33: South Australian wastewater recycling volumes and proportions, 2009/10 (ML/year) ...................... 48
Figure 34: Metropolitan Adelaide recycled wastewater percentage, 1996/97 – 2009/10 ................................... 49
Figure 35: Adelaide Wastewater recycling 2009/10, by type (ML/year) ............................................................ 49
Figure 36: Non-metropolitan wastewater recycling, South Australia, 1996/07 – 2009/10 ................................. 50
Figure 37: Recycled water progress to 2015, South Australia (ML/year) ........................................................... 51
Figure 38 – Perth drinking water supply demand gap to 2060 (GL/year) .......................................................... 55
Figure 39: Western Australian wastewater recycling volumes and proportions, 2009/10 (ML/year) .................. 56
Figure 40: recycled water progress to 2015, Western Australia (ML/year) ........................................................ 58
Figure 41: Tasmanian wastewater recycling volume and proportion, 2009/10 (ML/year).................................. 60
Figure 42: Expected Tasmanian wastewater recycling and implicit national target, 2015 (ML/year) ................. 61
Figure 43: Northern Territory wastewater recycling volume and proportion 2009/10 (ML/year) ....................... 63
Figure 44: Expected Northern Territory wastewater recycling and implicit national target, 2015 (ML/year) ..... 64
Figure 45: Total ACT storage levels since 2006................................................................................................ 66
Figure 46: ACT wastewater recycling 2009/10 with/without return flows (ML/year) ......................................... 67
Figure 47: Expected ACT wastewater recycling and implicit national target, 2015 (ML/year)............................ 68
Figure 48: National recycled water with project capacity, 2015 (ML/year).........................................................71MARSDEN JACOB ASSOCIATES
Executive Summary
1. The Department of Sustainability, Environment, Water, Population and Communities
(DSEWPaC) commissioned Marsden Jacob Associates (MJA) to undertake an assessment
of progress towards a national target of wastewater recycling of 30 per cent by 2015.
Across Australia, 16.8 per cent of wastewater flows were recycled in 2009/10. On
current estimates, national wastewater recycling by 2015 is expected to range from
18.7 per cent to 20.3 percent. 1
2. While the majority of wastewater recycling in 2009/10 stems from urban reuse (Figure 1),
a greater proportion of wastewater flows are recycled outside of capital cities
(21.7 per cent as opposed to 15.2 per cent in capital cities).
Figure 1: Australian wastewater recycling 2009/10, by capital cities and rest of Australia (ML/year)
Source: MJA analysis based on various sources.
3. Figure 2 summarises wastewater recycling by jurisdiction. Volumetrically, the largest
volumes recycled are in the states with the largest populations − Victoria, New South
Wales and Queensland. However, South Australia reuses the highest proportion of
wastewater at 28 per cent, followed by Victoria (24 per cent) and Queensland
(24 per cent). Tasmania and the Northern Territory recycled the least by both volume and
proportion, facing the lowest demand and abundant potable supplies in most of their
major centres.
1
This range is based on the potential inclusion of Perth’s Groundwater Replenishment recycled water project,
which is planned to produce 25-35 GL per year by 2015 if it goes ahead (we have used the average of 30GL per
year).
Department of Sustainability, Environment, Water, Population and Communities 1
Progress against the national target of 30% of Australia’s wastewater being recycled by 2015MARSDEN JACOB ASSOCIATES
Figure 2: Australian wastewater recycling 2009/10, by jurisdiction (ML/year)
Source: MJA analysis based on various sources.
4. Figure 3 shows expected wastewater recycling to 2015. Nationally, recycled wastewater
is expected to reach 18.7 per cent of wastewater flows in 2015, or 20.3 per cent if Perth’s
Groundwater Replenishment 2 project proceeds. Augmentations are expected mostly in
NSW, which is dominated by an 18GL per year environmental flow / potable substitution
project in Sydney, and smaller augmentations in Victoria. These are mostly increased
supply from existing projects, and various small new initiatives.
2
Shown as ‘IPR’ (indirect potable reuse) in the Figure. IPR projects augment drinking water supplies indirectly;
for example through high level treatment before storage and filtration in natural aquifers, or by storage in rivers
and dams prior to retreatment and delivery through potable supply systems. Perth’s project involves
groundwater aquifer storage.
Department of Sustainability, Environment, Water, Population and Communities 2
Progress against the national target of 30% of Australia’s wastewater being recycled by 2015MARSDEN JACOB ASSOCIATES
Figure 3: Expected Australian wastewater recycling by jurisdiction, 2015 (ML/year)
Source: MJA analysis based on various sources.
Note: * The National average increase reflects inclusion of indirect potable reuse (IPR). In addition, if Perth’s
Groundwater Replenishment IPR project is implemented, WA’s recycling proportion would increase to 30 per cent. In
addition, the national average would be boosted with the addition of SA’s stormwater recycling projects totalling
10GLper year, taking their recycling proportion to 30 per cent.
5. There are expected declines in water recycling proportions in Queensland, predominantly
from a reduction in output from SEQ’s Western Corridor Recycled Water Project
(WCRWP) compared with 2009/10. In addition, recycled water use in South Australia,
Western Australia, the Northern Territory and the ACT is expected to flatten, reducing
the output in percentage terms as wastewater volumes grow with population.
6. Western Australia’s recycling to 2015 is dependent upon the potential for Australia’s first
operating wastewater recycling project used for indirect potable reuse (IPR). If approved,
the Groundwater Replenishment project will supply between 25 and 35GL per year to
Perth’s potable supplies, using recharge to aquifers. This would increase recycled water
use in WA from 12 per cent to 30 per cent, and the national proportion to 20.3 per cent, as
well as potentially revolutionising recycled water use in Australia.
7. The contribution of stormwater reuse to total water recycling in 2015 is shown in orange
bars in Figure 3. The main contributions are in South Australia, New South Wales,
Victoria and the ACT. These volumes do not contribute to percentages shown in the
Figure, which represent recycled wastewater use only.
Department of Sustainability, Environment, Water, Population and Communities 3
Progress against the national target of 30% of Australia’s wastewater being recycled by 2015MARSDEN JACOB ASSOCIATES
Figure 4: 2009/10 recycled wastewater volumes and augmentations to 2015 by capital city and rest of
jurisdiction (ML/year)
Source: MJA analysis based on various sources.
8. Figure 4 shows current recycled water volumes by capital city and the remainder of the
State or Territory, in addition to expected augmentations to 2015. This chart highlights
the volumetric contribution of Sydney to overall augmentations (from a comparatively
low proportional base), and the potential of Perth’s IPR project to contribute to the total.
Further, recycling in the ACT challenges the very definition of recycled wastewater,
returning the vast majority of potable supplies (97 per cent) to the Murrumbidgee for
downstream use, beyond more conventional recycling activities.
NATIONAL RECYCLED WATER TRENDS
9. There are a number of common recycled water trends emerging nationally. These include
a shift in recycled water use towards uses that substitute for potable consumption, a
movement towards indirect potable consumption (IPR) of recycled water, an excess of
recycled water capacity in several centres, and the more recent growth in stormwater
reuse.
A shift towards potable substitution
10. The early recycled water projects that produced significant volumes of water were
predominantly agricultural initiatives which used recycled water with low levels of
treatment.
11. Figure 5 shows current wastewater recycling projects by use (in blue), and expected
augmentations to 2015. While agricultural projects dominate the historical picture, future
augmentations are dominated by municipal, industrial and commercial, as well as
Department of Sustainability, Environment, Water, Population and Communities 4
Progress against the national target of 30% of Australia’s wastewater being recycled by 2015MARSDEN JACOB ASSOCIATES
environmental projects. These include Sydney’s environmental flows project. Should it
proceed, Perth’s Groundwater Replenishment project will also add a further 25-35GL per
year of indirect potable reuse (IPR) to this picture.
Figure 5: Current and expected wastewater recycling by 2015, by use (ML/year)
Source: MJA analysis based on various sources.
12. Importantly, from an urban water supply perspective, up to half of wastewater recycling
will substitute for potable supplies by 2015 (with the inclusion of Perth’s IPR project),
and thus contribute to urban water supply security. Additionally, the Western Corridor
project is being used as a potential 85GL per year drought response option, which is the
first dedicated use of a recycled water project for urban water security in Australia.
13. As such, recent and future recycled water projects are contributing to urban water supply
security as never before.
Indirect Potable Reuse (IPR) developments
14. The use of recycled wastewater to augment potable supplies remains largely unsupported
in Australia. In 2008 the Western Corridor project in SEQ was scheduled to be the first
Australian IPR project in use, supplying 85GL per year into SEQ storages once combined
storages fell below 40%. While this did not occur and rainfall has returned to SEQ, it
remains an integral part of the State’s water supply strategy.
15. Perth’s Groundwater Replenishment project involves treatment of wastewater to drinking
water standards followed by injection into an aquifer and subsequent recovery. If proven
to be cost effective and with demonstrated community support, it will form an ongoing
part of future potable supplies for Perth’s water supply system. By 2015, subject to
approval, the project would produce between 25 and 35GL per year, with long-term
volumes up to 70GL per year.
16. If successful, the project will revolutionise recycled water use and potable water supply
planning in Australia, and could lead to far greater use of IPR in future.
Department of Sustainability, Environment, Water, Population and Communities 5
Progress against the national target of 30% of Australia’s wastewater being recycled by 2015MARSDEN JACOB ASSOCIATES
17. An IPR project involving stormwater reuse is in operation in Orange, NSW. The first
IPR project of any kind in Australia, it harvests between 1.3 and 2.1GL per year of
stormwater from high flow events in Blackmans Swamp Creek, which is added to surface
water storages. Further augmentations are planned to this project.
Excess recycled water capacity
18. There is evidence in a number of jurisdictions of a significant surplus in supply over
demand, or insufficient latent demand to justify further growth, especially where
large-scale projects have been developed. Examples include:
− SEQ’s Western Corridor Recycled Water Project has the capacity to produce 85GL
per year of potable quality recycled water from a number of sites across Brisbane
and Ipswich, with a delivery network already in place. While the project is currently
being used as a drought management tool with potential IPR, estimated volumes
recycled to 2015 are in the order of 14-22GL per year. Thus, there is a latent supply
of around 65-70GL per year which could be used for industrial, commercial and
municipal use, of which up to 32GL per year has been offered to agricultural users in
the Lockyer Valley, should a demand arise, that can be met at the marginal cost of
delivery; 3
− Melbourne’s Eastern Treatment Plant upgrade will result in 100GL per year of Class
A treated wastewater available for use from July 2012. At this stage, no significant
users have been identified, with current exploration of potential agricultural demand
in the Bunyip Food Belt on Melbourne’s south eastern fringe. As with other
agricultural schemes, capacity to pay is a key issue and long-term demand of more
than 15GL per year would appear unlikely;
− a number of smaller centres such as Coffs Harbour (NSW) and Mackay (QLD) have
made significant investments in recycled water capacity, with supply now higher
than current demand. 4
19. It is important to note that if key projects operated at maximum capacity, the national
target would be much closer to realisation by 2015. Figure 6 provides an illustration of
national recycled water capacity at 2015, were the Eastern Treatment Plant (100GL per
year), Western Corridor (85GL per year) and Perth’s Groundwater Replenishment IPR
project (35GL per year) to operate at full capacity.
20. With all projects operating at capacity, and stormwater volumes (20GL per year)
included, total recycled water use would exceed 30 per cent, and fall just below the target
if Perth’s Groundwater Replenishment scheme does not proceed.
3
http://www.qwc.qld.gov.au/planning/pdf/seqws-full.pdf p.3.
4
These regional projects are driven by a range of factors, including the environmental health of receiving waters.
However, where supply significantly exceeds demand, it would suggest that further augmentations would be
ineffective in recycled water use in the short term.
Department of Sustainability, Environment, Water, Population and Communities 6
Progress against the national target of 30% of Australia’s wastewater being recycled by 2015MARSDEN JACOB ASSOCIATES
Figure 6: Projected supplies of recycled water compared to capacity, 2015 (ML/year)
Source: MJA analysis.
Notes: Blue bar is expected recycled water use to 2015, white bar is excess capacity of key projects: Eastern
Treatment Plant, Western Corridor Recycled Water Project, Perth’s Groundwater Replenishment project. Diamond
demonstrates the national 30 per cent target. Orange bar is national stormwater capacity at 2015, for illustrative
purposes.
21. Data collated for this report indicates that the projects shown in Figure 6 are likely to
operate at a fraction of full capacity by 2015. It is unlikely that new projects would be
undertaken in major urban centres while this significant excess of supply over demand
remains.
Stormwater recycling
22. Stormwater harvesting is a relative newcomer to recycled water in Australia, with a
significant number of projects appearing over the past decade. Compared with
wastewater recycling, stormwater recycling can suffer from a number of barriers and
challenges:
− unlike the steady availability of wastewater, stormwater is rainfall dependent and
highly variable over time;
− as most stormwater recycling projects are undertaken in urban settings, a shortage of
available land for low cost treatment through wetlands and storage facilities inhibits
projects being developed. Adelaide’s use of aquifer storage and recovery (ASR) has
avoided the use of surface water storages, improving cost effectiveness; and
− regulatory regimes for accessing stormwater and for stormwater reuse have tended to
lag behind those for wastewater recycling.
23. However, in contrast to wastewater recycling, stormwater reuse projects almost
invariably contribute to potable substitution, supplementing for urban irrigation and
industrial use, and contributing to water supply security. They also avoid the
‘yuck factor’ that plagues public perception of consumption of recycled wastewater.
Department of Sustainability, Environment, Water, Population and Communities 7
Progress against the national target of 30% of Australia’s wastewater being recycled by 2015MARSDEN JACOB ASSOCIATES
24. Estimation of stormwater recycling volumes is inherently imprecise. Not only does
demand vary with climatic conditions (like most wastewater recycling use), but supply
also depends upon rainfall. Very few projects have been in operation long enough to
develop a reliable predictive method, and most projects report on capacity (i.e., how
much the project can deliver in a given year).
25. As such, in lieu of estimated likely yield of projects in 2015, we use project yield at
capacity as reported by project proponents in this report, based on projects in operation
and those expected to be operating by 2015. This may overestimate actual volumes,
given that supply and demand may vary annually.
26. Additionally, while yields may not reach the stated capacity in 2015, there are many
small projects driven by local councils that are unreported at state and national levels.
Only South Australia and NSW have made any concerted effort to compile a list of
projects in their jurisdictions.
National stormwater recycling
27. Based on projects funded by the Commonwealth, and other projects reported by
jurisdictions, capacity for 20.8GL per year of stormwater recycling will exist by 2015
(Figure 7). Over half of this will be found in South Australia (10GL per year), with
significant contributions from New South Wales (5.4GL per year), Victoria (3.2GL per
year) and the ACT (1.5GL per year). A small number of mostly Commonwealth funded
projects are being implemented in other jurisdictions.
Figure 7: Expected stormwater recycling capacity by 2015, by jurisdiction (ML/year)
Source: MJA analysis based on various sources.
Department of Sustainability, Environment, Water, Population and Communities 8
Progress against the national target of 30% of Australia’s wastewater being recycled by 2015MARSDEN JACOB ASSOCIATES
28. In terms of contribution to water supply security, South Australia and the ACT are the
two jurisdictions that currently plan for stormwater to play a significant role in the long
term:
− the South Australian Government plans to increase stormwater reuse to 70GL per year
by 2050; and
− the ACT Government has medium term plans to reuse 3GL per year of stormwater –
equivalent to the entire public open space irrigation volume.
Department of Sustainability, Environment, Water, Population and Communities 9
Progress against the national target of 30% of Australia’s wastewater being recycled by 2015MARSDEN JACOB ASSOCIATES
1 Introduction
Ten years of below average rainfall across most of Australia until 2010, combined with rapid
population growth in major urban centres, highlighted the need for planners to prepare a
diversified water supply portfolio, including rainfall-independent water supply options such as
recycled wastewater and desalination.
Reliance solely on dams, which are heavily dependent on ‘average’ rainfall and potentially
inadequate for faster growing centres, is being replaced with augmentations from diverse
sources, many of which provide reliability during times of drought, and other natural crises.5
Government commitments at all levels towards water supply source diversification, as well as
the persistence of economic and regulatory barriers seen as inhibiting the unassisted growth of
water recycling activities, have seen most jurisdictions commit to wastewater recycling targets
over various time horizons. In 2007, the Australian Government itself committed to a national
target of recycling 30 per cent of wastewater by 2015, and provided support to achieve that
target.
MJA undertook a progress report in June 2008 which took a ‘snapshot’ of water recycling rates
across Australian jurisdictions, estimating that by 2015 around 23.8 per cent of wastewater
effluent would be recycled (24.6 per cent including stormwater recycling) based on available
data and planned investments.
However, much has changed at the policy and climatic levels since 2008.
The ten year record drought, which exposed the dam-dependency of most urban water
planning strategies, broke from 2010, replenishing water supply sources across eastern
Australia. Higher rainfall through 2010 and 2011 has reduced the demand for water from
alternative sources and increased wastewater flows due to infiltration into the sewerage
system. As a result, progress towards the 30 per cent national target by 2015 has effectively
slowed.
Further, significant replenishment of major urban centre dam supplies may defer immediate
decisions on augmentation options, such as South East Queensland’s (SEQ) Western
Corridor Recycled Water Project (WCRWP), which was scheduled to commence indirect
potable reuse at the end of 2008. As significant inflows to SEQ’s water supply at
Wivenhoe Dam returned, the need to supplement water storages with recycled water has
been deferred.
5
For example, the Gold Coast desalination plant provided welcome water supply reliability during South East
Queensland’s recent flood crisis.
Department of Sustainability, Environment, Water, Population and Communities 10
Progress against the national target of 30% of Australia’s wastewater being recycled by 2015MARSDEN JACOB ASSOCIATES
Significant investment in stormwater reuse, partly through Commonwealth funding, has
occurred across jurisdictions at varying scales. Although often undertaken at small scales,
these investments are likely to continue towards 2015 with the announcement in 2010 by
the Australian Government for an additional grant round of $100 million. This third round
of grants was launched in June 2011 with projects expected to commence in 2012.
Large-scale investments in South Australia continue, with the Waterproofing the West
initiative commencing in 2011.
Aquifer storage and recovery (ASR) for indirect potable consumption and other uses
continue to be developed, especially in Western Australia (as well as for stormwater in
South Australia).
Frameworks have been developed and implemented in New South Wales for third party
access of wastewater for recycled water projects, with the Rosehill-Camellia project due
online in 2011.
An increasing number of funding bodies have both begun and expanded operations across
Australia. These operations have funded both on-the-ground projects and research and
examined a broadening scope of options for recycling. This has in turn provided impetus
for new development and further research.
The policy landscape between environmental protection and water supply continues to
change, with Environmental Protection Agencies increasingly supportive of wastewater
recycling projects in contrast to riverine disposal options. 6
Meanwhile, the early starters in recycled water projects are now maturing (such as Rouse
Hill, Pimpama-Coomera and various industrial projects), providing rich data sets and
insights for next-generation projects.
It is in the context of these continuing changes that the current project is prepared.
1.1 Project scope
The current report/study is, in part, an update of the report completed by MJA in 2008, 7 which
explored then recycling rates and planned recycled water activities to 2015 across Australian
jurisdictions and as a whole. The scope of this report was extended to convey a
comprehensive picture of current wastewater and stormwater recycling activities, and those to
2015, across jurisdictions. Additionally, key policy issues and changes affecting each
jurisdiction are discussed.
Major water authorities 8 from all Australian jurisdictions report against key water supply and
wastewater functions to the National Water Commission National Performance Report, (NWC
NPR) the most recent of which is 2009/10, Urban Water Utilities. This data has provided the
backbone of the statistical analysis for this report, and has been augmented with:
6
Although interestingly, some water authorities have received credit from State Governments for high-level
treatment of recycled water and riverine disposal, for subsequent downstream water supply.
7
http://www.environment.gov.au/water/publications/urban/pubs/national-recycling-snapshot.pdf
8
Those supplying more than 50,000 connected properties.
Department of Sustainability, Environment, Water, Population and Communities 11
Progress against the national target of 30% of Australia’s wastewater being recycled by 2015MARSDEN JACOB ASSOCIATES
other 2009/10 water authority data where data gaps have been identified; 9 and
publicly available information on specific projects currently delivering recycled water;
Forecasting analysis to 2015 has built on this data with the following sources:
data supplied by water authorities of their own forecast wastewater recycling activities to
2015; and
published information on project development to 2015.
All analysis has been verified through discussions with policy officers in jurisdictional
departments, and semi-structured interviews with key agents in relevant water authorities.
The main gap in data is from small towns where current and forecast project information is not
publicly available. A full collection of data of this kind is beyond the scope of this consultancy.
Unlike the current report, MJA’s 2008 report projected recycling activities according to
jurisdictional targets to 2015 and beyond, if actual project data was lacking. For the 2008 report,
the use of targets provided a reasonable basis for forecasting the volume of recycled water to be
supplied 2015 in the absence of specific project data.
However, from the vantage point of 2011, a 2015 target must be associated with specific
projects in development for it to be likely to be met. As such, jurisdictional targets are not used
to forecast expected recycled water volumes by 2015 in this report.10
1.2 Report structure
The remainder of this report is structured as followed:
Section 2 provides some water policy context for Australian water recycling, before
detailing results at the national level;
Sections 3-10 provide the same context and data analysis for each Australian jurisdiction;
and
Section 11 provides policy insights and suggestions for further work.
9
For example, reporting to the NPR is voluntary in Queensland, however many authorities report to the
Queensland Water Directorate, which has supplied data to the project with permission.
10
The exception is Sydney, which has specific projects associated with a target for 70GL of recycled water
produced by 2015.
Department of Sustainability, Environment, Water, Population and Communities 12
Progress against the national target of 30% of Australia’s wastewater being recycled by 2015MARSDEN JACOB ASSOCIATES
2 Water Recycling in Australia
2.1 Recycled water in Australian water supply planning
Ten years of below average rainfall across most of Australia from 2000 to 2010 resulted in an
urgent need to secure drinking water supplies across jurisdictions, encouraging significant
investment in recycled water at all levels of government. These conditions changed
dramatically from 2010, when rainfall returned across eastern Australia and water storages
increased sharply.
Flooding in Queensland, New South Wales and Victoria associated with a ‘La Niña’ weather
pattern described as “the strongest in Australia in almost 40 years” 11 reduced the immediacy of
water supply planning problems for most capital cities. The exceptions are Adelaide, for which
dam storages provide a relatively small water supply buffer, and Perth, which did not benefit
significantly from La Niña-induced rainfall.
Desalination has also changed the urban water picture in Australia in recent years. Three
desalination plants are already in operation around Australia, and three more expect to be in
operation by 2012, implying that a capital-intensive, climate independent potable water supply
source will be available in the five largest capital cities in Australia by 2012 (Table 1). These
investments have placed pressure on residential water bills and focussed attention on the cost-
effectiveness of new water supply augmentations.
11
http://www.theaustralian.com.au/business/la-nina-blowing-away-wests-last-hopes/story-e6frg8zx-
1226057072938
Department of Sustainability, Environment, Water, Population and Communities 13
Progress against the national target of 30% of Australia’s wastewater being recycled by 2015MARSDEN JACOB ASSOCIATES
Table 1: Desalination plants by location and volume
Location Expected Annual volume (at Proportion of water supply
commencement date capacity)
South East Queensland 2009 45GL per year 7% (of around 620GL per year for SEQ)
Sydney 2010 90GL per year 15% (of around 600GL per year)
Melbourne End 2011 150GL per year 25% (of around 600GL per year)
Perth (Kwinana) 2006 45GL per year 17% (of around 250GL per year)
Perth (Binningup) End 2011 50GL per year 20% (of around 250GL per year)
Adelaide 2012 100GL per year 50% (of around 200GL per year)
12
Sources: see below.
Targets
Most Australian jurisdictions have had aspirational targets for the proportion of wastewater
recycled, either in capital cities or for the entire jurisdiction.
The jurisdictional targets identified are summarised in Table 2. Sydney’s goal of 70GL per year
equates to less than 15 per cent of expected wastewater flows by 2015, and appears to be on
target. Melbourne’s 70GL per year target equates to just over 20 per cent of expected
wastewater flows (due to lower wastewater volumes) and has been achieved. SA’s 2010
strategic document Water For Good set further ambitious wastewater and stormwater targets out
to 2050.
12
http://www.dlgp.qld.gov.au/projects/water/gold-coast-desalination-project.html ,
http://www.smh.com.au/environment/water-issues/sydneys-desal-plant-switched-on-20100128-n13h.html
http://www.partnerships.vic.gov.au/CA25708500035EB6/WebObj/ProjectSummaryforVictorianDesalinationPr
oject/$File/Project%20Summary%20for%20Victorian%20Desalination%20Project.pdf
http://www.watercorporation.com.au/D/desalination.cfm http://www.rpsgroup.com.au/project/binningup-
desalination-plant
http://www.sawater.com.au/NR/rdonlyres/0447A380-639E-4DA4-A041-7EF67237668D/0per
yearDPearly2011.pdf
Department of Sustainability, Environment, Water, Population and Communities 14
Progress against the national target of 30% of Australia’s wastewater being recycled by 2015MARSDEN JACOB ASSOCIATES
Table 2: Wastewater and stormwater recycling targets by location
Location Target Comment
Australia 30 per cent recycled per year by 2015 Wastewater target
Sydney 70GL per year by 2015
Melbourne 20 per cent recycled per year by 2010 Officially achieved , no
new target provided
Perth 30 per cent recycled by 2030
60 per cent recycled by 2060
South Australia 35 per cent recycled by 2015 (urban) GL targets from Water
29 per cent recycled by 2015 (country) For Good, 2010
60GL per year stormwater recycling by 2050 (Adelaide)
75GL per year stormwater recycling by 2050 (State)
75GL per year wastewater recycling by 2050 (urban)
13
Sources: see below.
Concurrently, a number of jurisdictions retain a formal ban on the use of recycled wastewater
for indirect potable reuse. Additionally, a lack of policy frameworks can further prevent
indirect potable consumption of stormwater in some jurisdictions, although not all.14
2.2 The national picture – current and expected water
recycling in Australia to 2015
Water authorities from all Australian jurisdictions report against key water supply and
wastewater functions to the National Water Commission’s National Performance Report,
(NWC NPR) the most recent of which is 2009/10, Urban Water Utilities. Most data in this
section is based on this reporting arrangement, augmented with further research and discussions
with key jurisdictional representatives on data gaps and future recycled water activities.
Across Australia, 16.8 per cent of wastewater flows were recycled in 2009/10. While the
majority of wastewater recycling stems from metropolitan reuse (Figure 8), a greater proportion
of wastewater flows are recycled outside of capital cities (21.7 per cent as opposed to 15.2 per
cent in capital cities).
13
Sydney: 2010 Metropolitan Water Plan.
Melbourne: New Water For Victoria, 2002.
Perth: Water Forever, towards climate resilience, 2009.
South Australia: Water For Good, 2010, Waterproofing Adelaide 2005.
14
In Victoria, Yarra Valley Water’s Kalkallo Stormwater Project proposed indirect potable consumption of
stormwater from roofs and paved surfaces, however was refused permission by the Health Department, citing a
lack of frameworks (http://www.theage.com.au/environment/water-issues/officials-block-radical-stormwater-
recycling-plan-20110307-1bl7i.html). In contrast, a stormwater harvesting project in Orange, NSW, supplies
potable storages with recycled stormwater.
Department of Sustainability, Environment, Water, Population and Communities 15
Progress against the national target of 30% of Australia’s wastewater being recycled by 2015MARSDEN JACOB ASSOCIATES Figure 8: Australian wastewater recycling 2009/10, by capital cities and rest of Australia (ML/year) Source: MJA analysis based on various sources. Figure 9 summarises wastewater recycling by jurisdiction. Volumetrically, the largest volumes recycled are in the states with the largest populations - Victoria, New South Wales and Queensland. However by proportion of wastewater flows, South Australia reuses the most wastewater at 28 per cent, followed by Victoria (24 per cent) and Queensland (24 per cent). Tasmania and the Northern Territory recycled the least by both volume and proportion, facing the lowest demand and abundant potable supplies in their major centres. Figure 9: Australian wastewater recycling 2009/10, by jurisdiction (ML/year) Source: MJA analysis based on various sources. Figure 10 shows expected wastewater recycling to 2015, based on expected changes in each jurisdiction. Recycled wastewater is expected to reach 18.7 per cent of wastewater flows in 2015, or 20.3 per cent if Perth’s Groundwater Replenishment project proceeds. Augmentations Department of Sustainability, Environment, Water, Population and Communities 16 Progress against the national target of 30% of Australia’s wastewater being recycled by 2015
MARSDEN JACOB      ASSOCIATES

are expected mostly in NSW, which is dominated by an 18GL per year environmental
flows/potable substitution project in Sydney, and smaller augmentations in Victoria. These
mostly increase supply from existing projects, but also include various small new initiatives.

Figure 10: Expected Australian wastewater recycling by jurisdiction, 2015 (ML/year)

Source: MJA analysis based on various sources.
Notes: * The National average increase reflects inclusion of IPR (Perth’s Groundwater Replenishment project). If
the project is implemented, WA’s recycling proportion increases to 30 per cent.
In addition, the National average would be boosted with the addition of SA’s stormwater recycling projects totalling
10GL per year.

There are expected declines in water recycling proportions in Queensland, which is expecting a
reduction in output from SEQ’s Western Corridor Recycled Water Project (WCRWP) compared
with 2009/10, and a flattening of output in South Australia, Western Australia, the Northern
Territory and the ACT. This will reduce output in percentage terms as wastewater volumes
grow with population.
Western Australia’s recycling to 2015 is dependent upon the potential for Australia’s first
operating wastewater recycling project used for indirect potable reuse (IPR). If fully realised,
the Groundwater Replenishment project, has the potential to supply between 25 and 35GL per
year to Perth’s potable supplies, using aquifer storage and recover (ASR). This will increase
their recycled water use in WA from 12 per cent to 30 per cent, and the national proportion to
20 per cent, as well as potentially revolutionising recycled water use in Australia.
The contribution of stormwater reuse to total water recycling in 2015 is shown in orange bars in
Figure 10. The main contributions occur in South Australia, New South Wales, Victoria and the
ACT. These volumes do not contribute to stated percentages.

Department of Sustainability, Environment, Water, Population and Communities                                    17
Progress against the national target of 30% of Australia’s wastewater being recycled by 2015
MARSDEN JACOB   ASSOCIATES

Figure 11: 2009/10 recycled wastewater volumes and augmentations to 2015 by capital city and rest
of jurisdiction (ML/year)

Source: MJA analysis based on various sources.

Figure 11 shows current recycled water volumes by capital city and the remainder of each
jurisdiction, in addition to expected augmentations to 2015. This chart highlights the volumetric
contribution of Sydney to overall augmentations (from a comparatively low proportional base),
and the potential of Perth’s IPR project to contribute to the total. Further, recycling in the ACT
challenges the very definition of recycled wastewater, returning the vast majority of potable
supplies (97 per cent) to the Murrumbidgee for downstream use, beyond more conventional
recycling activities.

Significant changes since the 2008 assessment
As noted, recycled wastewater is expected to total 18.7 per cent of wastewater flows in 2015,
and total recycled wastewater forms 20.3 per cent should Perth’s Groundwater Replenishment
project proceed. This compares with a 2008 estimate that 23.8 per cent would be recycled.

Department of Sustainability, Environment, Water, Population and Communities                           18
Progress against the national target of 30% of Australia’s wastewater being recycled by 2015
MARSDEN JACOB ASSOCIATES
Table 3: 2015 projections from current report, compared to 2008 report
Location 2015 estimate from 2015 estimate from
2008 report current report
% %
NSW 16.7 14.7
VIC 28.5 27.2
QLD 31.5 20.1
WA 27.3 11.9 – 30
SA 28.7 27.1
TAS 9.0 6.6
NT 10.0 5.9
ACT 31.1 12.7
AUS 23.8 18.7-20.3
Source: MJA analysis.
Note: Range represents inclusion or not of Perth’s Groundwater Replenishment Project.
Across the country, every jurisdiction appears likely to recycle lower volumes in 2015 than was
anticipated in 2008. The key changes include:
the single largest contributor to the reduction in volume is SEQ’s Western Corridor project,
which was expected to deliver 85GL per year of IPR into the water grid, but will instead
deliver only 14-22GL per year to industrial and municipal uses. Reductions in WCRWP
output to 2015 compared with 2009/10 volumes actually reduce SEQ’s recycled water use
over this time period;
the ACT’s Water Purification Scheme was an IPR project which was being prepared for
demonstration in 2008, for potential production of 9.1GL per annum by 2015. This project
was discontinued by the project proponent ACTEW;
many individual projects planned to 2015 were reported at maximum capacity, but have
delivered significantly below this capacity due to demand shortages. Expected growth to
2015 can be expected to fall short of capacity for many projects;
while not contributing to wastewater recycling percentages stated above, South Australia’s
stormwater projects were estimated to harvest 18GL per year by 2015. Current estimates
suggest that 10GL per year will now occur (although estimations of stormwater yield are
notoriously imprecise). Additionally, agricultural wastewater recycling demand in South
Australia is now considered exhausted and future growth to 2015 is unlikely.
2.3 National recycled water themes
The current study highlights a number of important national themes.
Department of Sustainability, Environment, Water, Population and Communities 19
Progress against the national target of 30% of Australia’s wastewater being recycled by 2015MARSDEN JACOB ASSOCIATES 2.3.1 A shift towards potable substitution The early recycled water projects producing significant volumes of water were predominantly agricultural projects using recycled water with low levels of treatment. Figure 12 shows current wastewater recycling projects by use (in blue), and expected augmentations to 2015. While agricultural projects dominate the historical picture, future augmentations are dominated municipal, industrial and commercial, in addition to environmental projects, including Sydney’s environmental flows project. Should it proceed, Perth’s Groundwater Replenishment project will also add a further 25-35GL per year of indirect potable reuse (IPR) to this picture. Figure 12: Current and expected wastewater recycling by 2015, by use (ML/year) Source: MJA analysis based on various sources. Importantly, from an urban water supply perspective, by 2015 up to half of wastewater recycling will substitute for potable supplies (with the inclusion of Perth’s IPR project), and thus contribute to urban water supply security. Additionally, the Western Corridor project is being used as a potential 85GL per year drought response option, which is the first dedicated use of a recycled water project for urban water security in Australia. As such, recent and future recycled water projects are contributing to urban water supply security as never before. 2.3.2 Indirect Potable Reuse (IPR) developments The use of recycled wastewater to augment potable supplies remains controversial in Australia. While direct potable reuse of recycled wastewater is absent from planning in Australia, a number of indirect potable reuse (IPR) projects have been mooted in different jurisdictions. IPR involves high level treatment of wastewater, with subsequent storage (and natural filtration) in groundwater aquifers or receiving waters (rivers, dams). Department of Sustainability, Environment, Water, Population and Communities 20 Progress against the national target of 30% of Australia’s wastewater being recycled by 2015
You can also read