PROJECTIONS TO 2020 THE ECONOMIC IMPACT OF END-STAGE KIDNEY DISEASE IN AUSTRALIA
←
→
Page content transcription
If your browser does not render page correctly, please read the page content below
THE ECONOMIC IMPACT OF
END-STAGE KIDNEY DISEASE IN
        AUSTRALIA

   PROJECTIONS TO 2020
ACKNOWLEDGEMENTS AND DISCLAIMERS
This report was commissioned by Kidney Health Australia with the objective of conducting a
review and update of the first comprehensive research into the economic burden of kidney
disease in Australia, published in 2006. The George Institute for Global Health assures the
integrity of the data and appropriateness of the analyses. The research was undertaken and the
report written by academics from the George Institute for Global Health, the Sydney Medical
School and Centre for Obesity, Diabetes and Cardiovascular Disease at the University of Sydney,
Royal Prince Alfred Hospital, Concord Repatriation General Hospital and the Central Northern
Adelaide Renal and Transplantation Service.
The data presented in this report is drawn from the Australian and New Zealand Dialysis and
Transplant Registry (ANZDATA). The analysis and conclusions presented are the responsibility of
the authors, not the ANZDATA Registry.
The research was undertaken and the Report written by (in alphabetical order) Alan Cass, Steven
Chadban, Martin Gallagher, Kirsten Howard, Alexandra Jones, Stephen McDonald, Paul Snelling
and Sarah White.
Corresponding author:
Professor Alan Cass
Senior Director
The George Institute for Global Health
PO Box M201
Missenden Road
Sydney NSW 2050 Australia
Phone +61 2 9993 4553
Fax +61 2 9993 4502
Email acass@thegeorgeinstitute.org.au
© Kidney Health Australia
This work is copyright. Apart from any use as permitted under the Copyright Act 1968, no part
may be reproduced without written permission from Kidney Health Australia. Requests and
enquiries concerning reproduction and rights should be directed to Kidney Health Australia, GPO
Box 9993, Melbourne, VIC 3001.
A copy of this report can be viewed on the Kidney Health Australia website at
www.kidney.org.au
ISBN: 978-0-9808596-3-8 (Web version)
This report was funded by an unrestricted educational grant from Roche Australia.

Published by Kidney Health Australia, 2010.

                                                                                              ii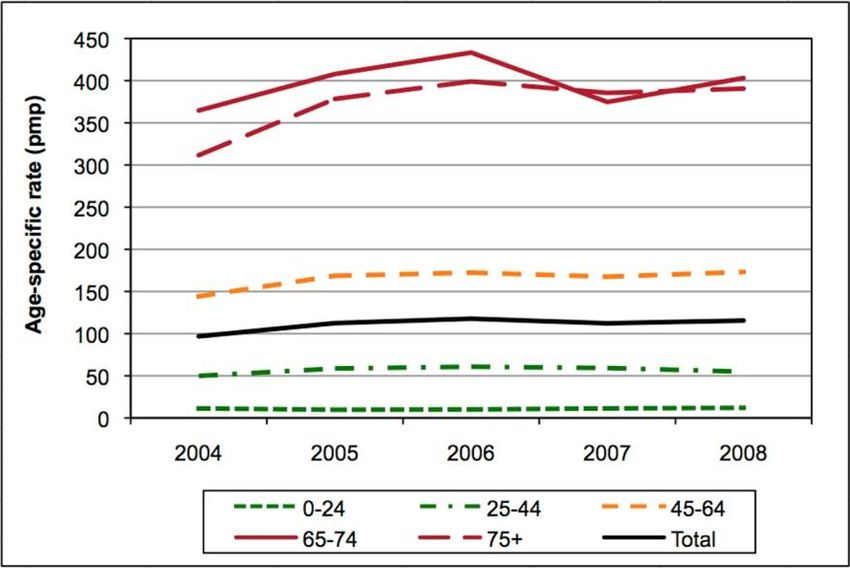
TABLE OF CONTENTS

ACKNOWLEDGEMENTS AND DISCLAIMERS                                                                      ii
Executive Summary                                                                                     1
Chapter 1        Introduction                                                                         9
  1.1       Background to the burden of ESKD in Australia                                             9
  1.2       CKD and ESKD in Australia 2005 to 2010                                                   10
  1.3       The current health care and reform context                                               13
  1.4       A continued need for more cost-effective models of service provision                     14
Chapter 2      Projections of the burden of disease                                                  16
  2.1     Projected burden of disease to 2020                                                        16
  2.2     Trends and implications                                                                    19
Chapter 3     ESKD overview – current data and trends                                                21
  3.1     Changes in demographics of the population on RRT 2004-2008                                 21
  3.2     Changes in modality utilisation patterns 2005-2009                                         22
Chapter 4       Current and future costs of ESKD                                                     24
  4.1      Research Questions                                                                        24
  4.2      Overview of Methods                                                                       24
      4.2.1     The Economic Model                                                                   24
      4.2.2     Health State Utilities (Quality of life weights)                                     25
      4.2.3     Resource use and costs                                                               26
      4.2.4     Transition probabilities                                                             28
      4.2.5     Calculation methods including sensitivity analyses                                   28
  4.3      Cost and health outcomes of treatment to 2020                                             30
      4.3.1     Cost of treating current cases of ESKD                                               30
      4.3.2     Cost of treating new cases of ESKD out to 2020                                       30
      4.3.3     Cost of treating current and new cases of ESKD out to 2020                           32
      4.3.4     Projected annual health sector costs of treating all cases of end-stage kidney disease
                (ESKD) to 2020                                                                       32
      4.3.5     Health outcomes (in life years and quality-adjusted life years) of treating new cases of
                ESKD (to 2020)                                                                       33
  4.4      Costs and health outcomes of alternative models of service provision                      35
      4.4.1     Increasing the utilisation of home-based dialysis therapies                          35
      4.4.2     Increasing the rate of kidney transplantation                                        35
Chapter 5        Challenges and opportunities                                                         38
  5.1       Implications of the projected future burden of ESKD in Australia: from here to 2020       38
  5.2       Key challenges to expansion of home-based dialysis in Australia                           39
  5.3       The critical role of kidney transplantation in meeting the needs of Australians with ESKD 40
  5.4       Steps to improved rates of kidney transplantation in Australia                            40
  5.5       The future of RRT and how this will affect the cost-effectiveness of dialysis and
            transplantation                                                                           43
  5.6       Limitations of this analysis and future challenges                                        44
Chapter 6        Appendices                                                                          46
Appendix A – Undiscounted Costs                                                                      47

                                                                                                      iii
Appendix B – Model Methods                                                               48
  6.1      Methods for the analysis of costs and benefits                                48
      6.1.1    Costs                                                                     48
      6.1.2    Utility based quality of life (QoL)                                       50
  6.2      The model structure and assumptions                                           52
      6.2.1    Main assumptions                                                          52
      6.2.2    Transition probabilities                                                  56
  6.3      Calculation of present value of costs and benefits                            58
      6.3.1    Costs and health outcomes of prevalent and incident patients              58
      6.3.2    Costs and health outcomes of alternative service provision distribution   59

                                                                                         iv
Executive Summary
Key messages
In 2008, 2,476 Australians of all ages commenced renal replacement therapy
(RRT). At 31 December 2008, there were 17,578 Australians receiving RRT, of
whom 7,516 had a functioning transplant and 10,062 were receiving dialysis.
By 2020 it is projected that between 3,335 and 4,472 Australians of all ages will
commence RRT, an increase of 35% to 81% over 2008 numbers.
The total number of patients receiving treatment for end-stage kidney disease
(ESKD) in Australia in 2020 is projected to lie between 27,013 and 30,293 based on
the same models, an increase of 54% to 72% above 2008 numbers.
The cumulative cost, in today’s dollars, of treating all current and new cases of
ESKD from 2009 to 2020 is estimated to be between approximately $11.3 billion
and $12.3 billion.
Increasing the utilisation of home-based dialysis (home haemodialysis and
peritoneal dialysis) over this period would lead to estimated net savings of
between $378 and $430 million.
After factoring additional costs associated with increasing organ donation,
increasing the rate of kidney transplantation by 50%, to match rates currently
achieved in the United States and numerous European countries, would be
associated with cost savings and with greater health benefits. Performing more
kidney transplants would be both less expensive and more effective than current
practice.
The projected growth in the burden of ESKD necessitates a ‘whole of government’
approach to chronic disease prevention, early identification and intervention.
Social, behavioural and biological determinants of health should be addressed
within the framework of an overarching national chronic disease strategy.
Priorities in renal service planning include developing strategies to overcome the
financial and structural barriers affecting the ability to shift dialysis treatment
from the hospital sector to home-based care and to increase the availability of
organs for transplantation.
Page 1Background and Objectives
In 2005, Kidney Health Australia commissioned a comprehensive report on the economic
burden of kidney disease in Australia. The research and writing was undertaken by a
collaborative team from The George Institute, The University of Sydney, Royal Prince Alfred
Hospital, The Queen Elizabeth Hospital and The Australian and New Zealand Dialysis and
Transplant Registry (ANZDATA). The resulting report was in two parts: Part I — The Economic
Impact of End-Stage Kidney Disease in Australia; and Part II — The Cost-Effectiveness of Early
Detection and Intervention to Prevent the Progression of Chronic Kidney Disease in
Australia.
In our previous report, ‘The Economic Impact of End-Stage Kidney Disease in Australia’, we
estimated that, by 2010, between 2,185 and 2,698 Australians would commence renal
replacement therapy (RRT) each year. Based on conservative estimates, we suggested that
the cost of providing RRT to new and existing patients from 2004 to 2010 would exceed $4
billion. We reported that switching patients from hospital-based haemodialysis to home-
based dialysis options would result in net health sector cost savings, and that increasing the
kidney transplantation rate would result in both considerable health sector savings and
significantly improved health outcomes.
Since our original analyses were performed, the number of patients requiring RRT has
continued to grow, with the largest increase in the over-65 age category. Diabetes has
consolidated its position as the most common cause of kidney disease amongst Australians
commencing RRT. Although several state jurisdictions have established targets for home-
based dialysis, there has been minimal increase in the proportion of dialysis patients
receiving home-based therapies. The establishment of the Australian Organ and Tissue
Authority (AOTA) in 2009 has signalled a more concerted national effort to increase organ
donation rates, which, if successful, would consequently increase the rate of kidney
transplantation. In the context of a national health reform agenda, which includes a focus on
the prevention and management of complex chronic diseases, we present an updated report
on the economic impact of end-stage kidney disease (ESKD) in Australia projecting disease
burden to 2020.
The objectives of these new analyses are:
1. To estimate the health sector costs (and benefits) projected to 2020 of providing
RRT, in accordance with current clinical practice, to current and future ESKD
patients; and
2. To assess the relative costs and benefits of (i) an increase in the proportion of
ESKD patients receiving home-based dialysis; and (ii) an increase in rates of kidney
transplantation.
Page 2Methods
This Report establishes the baseline estimate of the national costs of renal service provision
for current and new (to 2020) patients, and of the benefits (survival and quality of life) of
treating all patients to 2020. We used similar methods in this report as in Part I of our
previous report to Kidney Health Australia. To estimate the current and future health sector
costs (and benefits) of RRT, and the impact of changing the clinical management of ESKD
patients, we first defined baseline practices as the existing patterns of RRT in Australia. Costs
and benefits of RRT in Australia from 2009 - 2020 were estimated based on a Markov model,
informed by an updated dataset of national patient outcomes from incident patients
commencing RRT during the period 2004 - 2008, as recorded by ANZDATA. Cost data were
based on the best available published data for this purpose. As indicated in Department of
Health and Ageing guidelines for preparing submissions to the Pharmaceutical Benefits
Advisory Committee, a discount rate of 5% per annum was applied to all modelling of future
cumulative costs, benefits and cost-effectiveness analyses.
Historic age-specific trends in the incidence of treated ESKD in the non-Indigenous and
Indigenous population were examined to determine likely future trends for the years 2009-
2020. We report both steady-state models (assuming that current observed age-specific
rates were maintained to 2020) and growth models (assuming that the linear trend of
increasing age-specific rates evident over the period 2000-2009 is maintained to 2020).
Compared to our previous analysis, we have made the following significant changes in this
updated report:
1. The cost of each dialysis modality was based upon the NSW Dialysis Costing Study,
2008, with prices indexed to 2009 dollars.
2. When estimating the impact of shifting dialysis management from the hospital to the
home, we combined the increased uptake of both peritoneal and home-
haemodialysis in the same model, aiming to reflect a realistic and potentially
achievable mix of dialysis therapies flexible to the requirements of individual States
and Territories.
3. When estimating the cost-effectiveness of increasing kidney transplant rates, we
included a nominal 5% increase in the cost of transplants to account for likely
increased resources required to achieve increases in transplant numbers.
Page 3Results
Projected incidence of treated ESKD to 2020
These projections indicate that, in 2020, the number of Australians of all ages commencing
RRT will lie between 3,335 (2,971 non-Indigenous and 364 Indigenous, steady-state model)
and 4,472 individuals (4,019 non-Indigenous and 453 Indigenous, growth model). On the
basis of these models, an increase of between 35% and 81% in the number of new patients
commencing RRT above 2008 figures is projected. The majority of this increase is driven by
new ESKD cases in the non-Indigenous population aged 75 years and over.
Figure ES-I: Projected incident RRT patients, 2009-2020
4500
4000
3500
3000
2500
n
2000
1500
1000
500
0
2009 2010 2011 2012 2013 2014 2015 2016 2017 2018 2019 2020
Non-Indigenous population: Model 1 (Growth)
Non-Indigenous population: Model 2 (Stable)
Indigenous population: Model 1 (Growth)
Indigenous population: Model 2 (Stable)
These projections are based upon observed, age-specific incidence rates for treated ESKD.
An increasing demand for RRT can be driven both by trends in the incidence and prevalence
of underlying risk factors for chronic kidney disease (CKD), including diabetes, obesity and
hypertension, as well as changing professional practice and community expectations of
access to health care, irrespective of age, and the ability of the health system to meet these
expectations. As noted above, new cases of ESKD in Australians aged 75 and over contribute
significantly to the projected demand for renal services. However, even when making
projections based upon the “Growth” model, the age-specific incidence of RRT in 2020
amongst Australians 75 and over is lower than the incidence in this age group in comparable
countries including the United States.
Page 4Projected prevalence of treated ESKD to 2020
These projections indicate that, on 31 December 2020, the number of Australians receiving
RRT will lie between 27,013 (steady-state model) and 30,293 individuals (growth model). On
the basis of these models, an increase of between 54% and 72% in the number of patients
receiving RRT above 2008 figures is projected.
Figure ES-II: Projected prevalent RRT population, 2009-2020 (alive and on RRT at 31
December)
32,000
30,000
28,000
26,000
n
24,000
22,000
20,000
18,000
16,000
2009 2010 2011 2012 2013 2014 2015 2016 2017 2018 2019 2020
Total incident & prevalent patients, Model 1 Total incident & prevalent patients, Model 2
Page 5Cost of treating current and new RRT patients out to 2020
As at 31 December 2020, these projections with respect to the future RRT population equate
to an annual cost of RRT service provision of between $1.58 billion and $1.86 billion in 2020
dollars ($922 million to $1.09 billion in 2009 dollars). In 2009 dollars the cumulative cost of
RRT for all current and new cases of ESKD is estimated to be between approximately $11.3
billion and $12.3 billion by the end of 2020 (Figure ES-III). These total cost estimates exclude
the following expenditures: i) the cost of providing RRT services to Australians under 25 (less
than 3% of new cases); ii) the cost of providing services for co-morbid conditions such as
cardiovascular disease and diabetes; and iii) the indirect or non-health sector costs
associated with ESKD.
Figure ES-III: The cumulative present value treatment cost for all new and existing RRT
patients treated out to 2020
$13,000
$12,000
$11,000
Cumulative Cost ($millions)
$10,000
$9,000
$8,000
$7,000
$6,000
$5,000
$4,000
$3,000
$2,000
$1,000
$0
2009 2010 2011 2012 2013 2014 2015 2016 2017 2018 2019 2020
Cumulative present value costs, Model 1 Cumulative present value costs, Model 2
Page 6Costs and health outcomes of alternate service provision models
Increasing the utilisation of home-based dialysis therapies
Increasing the utilisation of home-based therapies (home haemodialysis (HD) and peritoneal
dialysis (PD)) will lead to net savings of between $378 million and $430 million (Tables ES-I
and ES-II). In general, the alternate service provision models aim to reflect a realistic and
potentially achievable mix of dialysis therapies, consistent with recently developed state-
wide renal service strategies. Specifically the alternate service provision scenarios reflect
greater uptake of home HD within the first year of treatment and commencement of a
significant proportion of patients on PD, with subsequent change to other treatments over
the course of RRT (Table 8). According to these modelled scenarios, in the first year of RRT,
approximately 40% to 60% of dialysis patients, by age group, would be established on home-
based dialysis. Without robust Australian data on utility-based quality of life on each dialysis
modality, it is not possible to estimate the incremental benefits of the ‘switch modality’
scenarios. It is, however, reasonable to assume that there would also be improvements in
quality of life resulting from these changes.
Table ES-I: The present value costs and health benefits (out to 2020) of increasing the
utilisation of both Home HD and PD services in Australia (Incidence Model 1)
Total cost Incremental cost
Costs and benefits to 2020 Total LYS Total QALYs
($million) ($million)
Base Case $8,304.27 125,104.93 71,528.19
-$430.25
Increased Home HD & PD utilisation $7,874.03 125,104.93 71,528.19
Table ES-II: The present value costs and health benefits (out to 2020) of increasing the
utilisation of both Home HD and PD services in Australia (Incidence Model 2)
Total cost Incremental cost
Costs and benefits to 2020 Total LYS Total QALYs
($million) ($million)
Base Case $7,371.44 112,452.50 64,543.34
-$378.24
Increased Home HD & PD utilisation $6,993.19 112,452.50 64,543.34
Page 7Increasing the rate of kidney transplantation
A number of sensitivity analyses were conducted assessing the impact of varying increases in
transplant rates (10% or 50%) under different assumptions concerning the cost of achieving
these increases (no additional costs, or a 5% increase in costs per transplant). Under both
models of projected ESKD incidence, the incremental cost effectiveness of increasing kidney
transplants ranges from being dominant over current practice (i.e. less expensive and more
effective than current practice) to a maximum cost of approximately $26,000 per Quality-
Adjusted Life Year gained. Even when accounting for estimated additional costs associated
with achieving increased donor numbers, increasing the availability of donor organs is well
within the range of currently funded treatment and prevention programs. If a 50% increase
in the transplant rate is achieved, the additional costs are more than offset by the reduction
in costs associated with moving patients from dialysis (Tables ES-III and ES-IV).
Table ES-III: The present value costs and health benefits (out to 2020) of increasing the
current transplant rate by 50% over current levels (Incidence Model 1)
Costs and Total cost Incremental cost Total life Incremental Incremental
Total QALYs
Benefits to 2020 ($million) ($million) years life years QALYs
Base case $8,304.27 125104.93 71528.19
Increased transplant rate (no
$8,248.22 -$56.06 128215.43 3,110.50 74570.06 3,041.87
additional resources)
Increased transplant rate (assuming
5% additional resources required to $8,290.52 -$13.75 128215.43 3,110.50 74570.06 3,041.87
achieve increased donor rates)
Table ES-IV: The present value costs and health benefits (out to 2020) of increasing the
current transplant rate by 50% over current levels (Incidence Model 2)
Costs and Total cost Incremental cost Total Life Incremental Incremental
Total QALYs
Benefits to 2020 ($million) ($million) Years life years QALYs
Base case $7,371.44 112452.50 64543.34
Increased transplant rate (no
$7,314.79 -$56.64 115538.63 3,086.14 67561.34 3,018.00
additional resources)
Increased transplant rate (assuming
5% additional resources required to $7,356.57 -$14.87 115538.63 3,086.14 67561.34 3,018.00
achieve increased donor rates)
Page 8Chapter 1 Introduction
1.1 Background to the burden of ESKD in Australia
Chronic diseases represent a significant long-term challenge for the Australian health care
system, in terms of the number of people affected, and the associated morbidity, mortality
and health-system expenditure. Chronic diseases are estimated to be responsible for more
than 80% of the burden of disease and injury,1 and more than two thirds of all health
expenditure in Australia.2 Furthermore, chronic diseases disproportionately affect
Aboriginal and Torres Strait Islander people, contributing significantly to the gap in life-
expectancy between Indigenous and non-Indigenous Australians.
Chronic kidney disease (CKD) is the progressive deterioration of the filtration ability of the
kidneys. A prime example of the challenges of chronic disease, CKD is characterised by a
gradual and typically asymptomatic onset, a complex aetiology, increasing prevalence with
older age, the co-existence of multiple conditions and potential complications affecting
quality of life, leading to high rates of premature mortality. Affecting approximately 13% of
Australian adults according to recent estimates,3 the health burden associated with CKD is
twofold: first, even moderate reductions in kidney function are associated with significantly
increased risks of cardiovascular events and mortality; second, for those persons who
progress to End-Stage Kidney Disease (ESKD), at which point the options are dialysis, kidney
transplantation or palliation, the provision of renal replacement therapies (RRT) is highly
costly and consumes a sizeable portion of the health budget.
Nevertheless, opportunities exist to reduce the impact of the health burden associated with
CKD and ESKD via disease prevention and informed planning of health service delivery. CKD
usually develops over a number of years and, with early identification and management, the
disease can be slowed and progression to ESKD significantly delayed or prevented. Primary
prevention through intervention targeted to the principal modifiable risk factors for CKD,
diabetes and hypertension, is also critical. At the same time, the different RRT modalities –
which include hospital, satellite and home haemodialysis (HD), peritoneal dialysis (PD) and
kidney transplantation – are each associated with different patterns of resource utilisation,
infrastructure and staffing requirements, and therefore with different per patient costs.
Existing international evidence and local costings indicate that home-based dialysis is less
expensive than hospital or satellite HD, while for those patients who are suitable candidates,
kidney transplantation is more cost-effective than any form of dialysis. Significantly, kidney
1
National Priority Action Council, 2006. National Chronic Disease Strategy, Australian Government Department of Health
and Ageing, Canberra, p. 1
2
Australian Institute of Health and Welfare (AIHW) 2006. Chronic diseases and associated risk factors in Australia, 2006.
Canberra: AIHW.
3
White SL, Polkinghorne KR, Atkins RC, Chadban SJ. Comparison of the prevalence and mortality risk of CKD in Australia
using the CKD Epidemiology Collaboration (CKD-EPI) and Modification of Diet in Renal Disease (MDRD) Study GFR
estimating equations: the AusDiab (Australian Diabetes, Obesity and Lifestyle) Study. Am J Kidney Dis. 2010 Apr;55(4):622-7
Page 9transplantation is also associated with improvements in survival and quality of life when
compared to dialysis, making it a compelling treatment option for those who are suitable.
Service planning which actively pursues the optimal mix of modality utilisation for a given
population has the potential to contain the significant costs associated with the treatment of
ESKD. Cost-effective algorithms of RRT service provision are likely to be those that maximise
transplantation for all suitable candidates and support home-based dialysis for patients who
would prefer this option. Health service planning that takes this into account is essential to
maximise health gains for the available resources, especially in the context of an ageing
population and the epidemic of type 2 diabetes, factors which already exert noticeable
pressure on demand for RRT services in Australia. Informing the planning of renal services in
Australia is the ANZDATA registry, a comprehensive database monitoring ESKD patient
trends, service utilisation and patient outcomes. ANZDATA is an essential resource enabling
comprehension of the nature of the burden of ESKD in Australia and informing best practice
in the provision of RRT services.
1.2 CKD and ESKD in Australia 2005 to 2010
This report reprises an analysis of the economic impact of ESKD in Australia originally
conducted in 2005, which projected the burden of disease out to 2010.4 The modelling
performed is based on long-term trends in RRT service provision as recorded by ANZDATA. In
our previous report we determined, on the basis of conservative estimates, that the cost to
the health sector of providing RRT to new and existing patients in Australia for the period
from 2004 - 2010 would exceed $4 billion. We also reported that switching patients from
hospital-based haemodialysis to home-based dialysis options would result in net health
sector cost savings, and that increasing the kidney transplantation rate would result in both
considerable health sector savings and significantly improved health outcomes.
Since the original analysis was reported, there have been a number of developments in the
fields of public health, clinical medicine and health policy that have influenced awareness of
CKD, the clinical management of ESKD, priority setting in the planning of RRT services, and
the national policy framework within which the continuum of CKD/ESKD care is delivered. In
this context therefore, we present an updated report on the economic impact of ESKD in
Australia, projecting disease burden to 2020.
Increasing recognition of the burden of disease
A recent step towards greater recognition of CKD in its earlier stages among Australian
clinicians has been the implementation of routine reporting of estimated glomerular
filtration rate (eGFR), a measure of kidney function, from serum creatinine measurements
performed in pathology laboratories. While eGFR is the best readily measurable index of
disease severity in CKD, most clinicians do not routinely calculate eGFR from serum
creatinine results. The automatic reporting strategy was intended to opportunistically
4
Cass, A, Chadban, S, Craig, J, Howard, J, McDonald, S, Salkeld, G, White, S. The Economic Impact of End-Stage Kidney
Disease in Australia, Kidney Health Australia, Melbourne, 2006.
Page 10identify people with CKD, who might not previously have been identified as having reduced
kidney function, with a view to facilitating appropriate management. Anecdotal reports
indicate that automated reporting has aided the detection of asymptomatic CKD at an
earlier stage, better decision making, and appropriate referral for those affected. 5
Opportunities exist for intervention to reduce avoidable morbidity and mortality at each
stage across the renal health continuum. The advantage of early identification is that greater
opportunities are available for management to delay or prevent progression to ESKD and the
subsequent requirement for dialysis. Effective disease recognition in primary care is also a
critical factor in timely referral to a nephrologist where specialist management is
appropriate. Timely referral, in turn, is critical to maximising the treatment options available
to the person with ESKD and, in particular, making home-based dialysis more feasible as the
individual is in a better position to make considered treatment choices and to prepare for
dialysis.
Recognition of the potential benefits of early detection and intervention in CKD is also
reflected in the incorporation of guidelines for the early identification and management of
CKD into the Royal Australian College of General Practitioners (RACGP) Red Book. Current
guidelines recommend the opportunistic screening by general practitioners for CKD in
people with diabetes, hypertension, a family history of CKD, and for Indigenous Australians.6
Screening for early signs of kidney damage is relatively inexpensive and simple, involving a
urine dipstick test for albuminuria or proteinuria, measurement of blood pressure, and a
blood sample to measure serum creatinine, tests which lend themselves well to
opportunistic screening.
In addition to opportunistic screening within the primary care setting, community-based or
workplace-based kidney health screening programs have been suggested as potentially
effective and affordable means of CKD detection. Since 2000, the National Kidney
Foundation in the United States has been running the Kidney Early Evaluation Program
(KEEP), a nation-wide community-based kidney health screening program targeting adults
with diabetes, hypertension or a family history that places them at risk.7 In 2010, the Kidney
Evaluation for You (KEY) pilot program was conducted in Australia, based on the KEEP model.
Targeting high-risk groups within the community, the KEY pilot project recruited participants
in the communities of Townsville, Roxby Downs and Perth, and offered a free and
comprehensive on-the-spot evaluation of kidney function, cardiovascular health and
diabetes risk, with subsequent referral to GPs of test abnormalities. Of 402 high-risk
individuals recruited, findings were suggestive of CKD in 20.4%, with 58% referred to their
primary care providers for further action. High rates of disease detection and follow-up
5
Mathew TH. Chronic kidney disease and automatic reporting of estimated glomerular filtration rate: revised
recommendations. Med J Aust, 2007; 187:459-463
6 th
Guidelines for preventive activities in general practice, 6 edition. Eds. Harris M, Bailey L, Bridges-Webb C et al. Royal
Australian College of General Practitioners, Melbourne, 2005.
7
http://www.kidney.org/news/keep/KEEPhealthcare.cfm
Page 11suggest that the KEY approach to early detection of CKD may be suitable for broader
evaluation.8
Policy developments
In addition to programs seeking to address the early stages of CKD, a number of Australian
States and Territories have recently developed plans for the delivery of renal services,
emphasising the provision of better coordinated care, promotion of self-management and
investments in home-based therapies and transplantation in the provision of RRT.9 NSW and
Queensland have set benchmarks for home-based dialysis, with a target of 50% of all dialysis
to be delivered as home-based self-care dialysis. The Tasmanian State Plan for Renal Services
outlines a reorientation of renal service delivery to a single state-wide Renal Service,
reallocation of resources to support the achievement of targets for home-based dialysis, and
the integration of renal services across the continuum of care including the development of
partnerships with the primary health sector.
Uptake of kidney transplantation is limited by the availability of donor organs. Deceased
donation remains low by international standards, yet substantial regional variation in donor
rates, for example a rate of 20.3 deceased donors per million population (pmp) achieved in
South Australia in 2009 compared to a national average of 11.3 donors pmp, is a clear
indication that improvement is possible.10 It is evident that opportunities for deceased
donation are frequently missed through refusal of consent to donation and other critical
factors preventing the conversion of potential donors to actual donors. In response to the
need for a nationally coordinated approach to maximise organ and tissue donation for
transplantation, the Australian Government established The Organ and Tissue Authority on 1
January 2009.11 The Authority is an independent statutory authority within the Australian
Government Health and Ageing portfolio.
The responsibilities of the Authority include coordination of a national network of clinicians
and other hospital staff involved in organ donation and transplantation; ongoing
professional education; oversight and regulation of a new national network of State and
Territory organ and tissue donation agencies; introduction of a national data and reporting
system; community awareness and education programs; formulation of national policies and
clinical practice protocols and standards; and monitoring and evaluation of practice. The
potential impact of national coordination of organ donation and transplantation activities
has been demonstrated in countries such as Spain where, 20 years after implementing a
8
Mathew T, Corso O, Ludlow M et al. Screening for chronic kidney disease in Australia: a pilot study in the community and
workplace. Kidney Int, 2010;77 (Suppl 116):S9–S16.
9
Statewide Services Development Branch. Service Planning Series: NSW Renal Dialysis Service Plan to 2011. NSW
Department of Health, Sydney, 2007.
Queensland Government. Queensland Statewide Renal Health Services Plan, 2008-17. Part One: The Way Forward,
Queensland Government, Brisbane 2007
Tasmanian Government (2009), Tasmanian State Plan for Renal Services 2010-2020, Part One: Overview and Action Plan.
Tasmanian Government, Hobart.
10
http://www.anzdata.org.au/
11
http://www.donatelife.gov.au/
Page 12similar nationally coordinated organisational model, deceased donation rates have reached
35 donors pmp and continue to increase.12
Changes in clinical management of ESKD
Pharmaceutical costs represent a significant proportion of the total cost associated with
treating ESKD. The introduction of newer, more expensive agents has the potential to
increase costs. Recent years have seen the introduction and widespread use of new
pharmaceuticals — sevalamer, cinacalcet and lanthanum — for treatment of mineral and
bone disorders associated with CKD, all of which are substantially more expensive than
existing agents (including calcium carbonate and activated vitamin D). Conversely, recent
evidence showing adverse patient outcomes with high or inappropriate dosing of
erythropoietic agents used to treat anaemia has led to a reduction in their use. Changes in
the use of these medications and newer regimens for post-transplant immunosuppression
have been taken into account in the updated modelling for this report.
1.3 The current health care and reform context
In 2005, The Australian Health Ministers’ Conference (AHMC) endorsed the National Chronic
Disease Strategy (NCDS), seeking to provide an overarching policy framework and national
direction for managing and improving chronic disease prevention and care. Within the
Strategy, the national service frameworks identify opportunities to reduce the impact of
specific chronic diseases, including diabetes. Critical intervention points and areas for
facilitating improvements are identified, and have been drawn upon by individual states and
territories in developing their own plans. Common themes across jurisdictions include
strategies for greater coordination and integration across the care continuum, and a growing
focus on self-management of chronic diseases. For ESKD in particular, policy developments
in all jurisdictions have been broadly consistent with these priority areas for intervention
outlined in the NCDS.
In 2010, the Federal Government announced significant changes to Australia’s health,
hospital and aged care systems via a National Health and Hospitals Network. The reform
agenda includes a number of themes relevant to the management of chronic diseases. These
include enhanced connection and integration of health and aged care; better utilisation of
specialist services; continued strengthening and reliance on primary health care services;
and implementation of evidence-based improvements to delivery and organisation of health
services. Targeted measures seek to strengthen these outcomes in groups facing particular
health inequities including Aboriginal and Torres Strait Islander populations, and those in
rural and remote communities.
Lastly, while a ‘fee for service’ model remains the cornerstone of outpatient healthcare
funding in Australia, there has been increasing recognition that such a funding model poses
significant challenges to the effective management of chronic diseases. Policies in recent
years such as providing access to Medicare funding for allied health groups, reimbursing
12
Matesanz R, Dominguez-Gil B. Strategies to optimize deceased organ donation. Transplant Rev, 2007;21:177-188
Page 13renal physicians for supervision of home-based dialysis, and plans to explore limited
capitation payments in primary care for management of diabetic patients, all signal a shift
toward mixed funding models for the future. This trend is likely to continue and it is
probable that this will impact upon current models of management of CKD and ESKD.
1.4 The ongoing need for more cost-effective models of service provision
Planning for the future burden of kidney disease continues to be vital to containing costs of
ESKD while maximising the benefits of treatment. The development of renal services plans
by individual States has been an important step forward. Nevertheless, there is an ongoing
need to provide high level evidence regarding the cost-effectiveness of the various RRT
modalities to inform policy-making, and to enable these economic realities to be reflected in
service delivery.
A number of key recent trends in delivery of RRT must be noted. Firstly, there has been
limited expansion of home-based dialysis services since 2005 and current patterns of usage
emphasise the long periods required to establish people on home HD. Limited resources and
facilities for home HD training remain a persistent barrier to achieving targets for home-
based treatment. Secondly, the proportion of patients receiving dialysis in satellite centres
has increased steadily over the past decade, and this trend has mirrored the decline in home
HD over the same period. Although satellite dialysis originally emphasised self-care, the
distinction from hospital HD with respect to dependency on nursing care and other health
workers is less and less apparent, despite the cost implications.13 Thirdly, despite an
increasing awareness of CKD and the importance of early detection, this is yet to translate
into measurable improvements in late referrals which remain above 20%. Late referral to a
nephrology service, within three months of commencing RRT, directly impacts on
preparation for RRT. Patients who are referred late are less likely to utilise home-based
dialysis and kidney transplantation. Finally, regional variation in rates of transplantation and
comparisons with international benchmarks continue to underscore the extent of
improvement that is possible with respect to organ donation and transplantation in
Australia.
The ageing of the Australian population and increasing prevalence of diabetic nephropathy
will continue to be major drivers of the demand for RRT services into the future. In this
report we project the future burden of ESKD in Australia, based on considered
methodologies that use recent age-specific trends for the actual national patient cohort. We
estimate the health sector costs (and benefits) projected to 2020 of providing RRT, in
accordance with current clinical practice, to the population of current and future ESKD
patients. We assess the relative costs and benefits of increases in the proportion of dialysis
delivery at home and in rates of kidney transplantation. In the context of the NCDS, Health
and Hospital Reform and the Organ and Tissue Authority, a framework is now in place by
which the needs of the population with respect to ESKD, from prevention to the optimal
treatment of end-stage disease, might be systematically addressed at a national level.
13
Agar J, Hawley C, George C, Mathew T, McDonald S, Kerr P. Home haemodialysis in Australia – is the wheel turning full
circle? MJA, 2010; 192(7):403-406
Page 14Therefore, this is an opportune time for a concerted effort to move towards more cost-
efficient models of RRT service provision that, crucially, will also deliver better outcomes in
terms of survival and quality of life to those Australians affected by ESKD.
Page 15Chapter 2 Projections of the burden of disease
2.1 Projected burden of disease to 2020
The annual incidence of treated ESKD was projected to 2020. Separate estimates were
generated for the Indigenous and non-Indigenous populations, and the age-specific trends
within each of these groups examined. Estimates of future incidence of RRT patients are
based on Australian Bureau of Statistics population projections. Mid-range (series B)
population projections were used for the non-Indigenous population,14 whereas upper-range
projections were applied for the Indigenous population.15 For both groups, the numerical
impact of this choice is small relative to other sources of variation affecting growth of RRT
populations.
Separate prediction models for the Indigenous and non-Indigenous populations were
necessary due to the heavy burden of ESKD among Indigenous Australians, the different
demographic characteristics of the Indigenous and non-Indigenous RRT populations, and the
volatility in census counts and demographic data for the Indigenous population, which
introduces uncertainties in projections of future population growth.
Two models projecting incidence were created for both the Indigenous and non-Indigenous
populations. The two models account for changing trends in the incidence of treated ESKD
over recent years; whereas the trend over the past 10 years has been towards growth in
new RRT patients, the trend over the past 3 years alone suggests that incidence has reached
a plateau. A key unknown factor is whether this is a ‘true’ stabilisation of rates, or an
artefact reflecting random fluctuations in observed numbers. Hence separate models
generated from each scenario produce upper (growth) and lower range (steady-state)
projections of ESKD incidence to 2020.
Model 1:
Model 1 uses a Poisson model based on RRT trends observed over the last 10 years (2000-
2009), for all age groups, with the exception of the non-Indigenous, 45-64 year old age
group, where the last 20 years of data was used due to a high degree of unexplained
variability in recorded rates for this group. The basic assumption underlying this model is
that the observed trend in rates towards growth over the previous 10-year period will
continue in a similar manner into the future. These age-specific trends have been largely
stable over the past 10 years.
Model 2:
Model 2 assumes that recently observed age-specific rates will remain constant over the
period to 2020 (i.e. a steady-state model). This model is based on the arithmetic mean of
14
3222.0 – Australian Bureau of Statistics. Population Projections, Australia, 2006 to 2101 (www.abs.gov.au)
15
3238.0 – Australian Bureau of Statistics. Experimental Estimates and Projections, Aboriginal and Torres Strait Islander
Australians, 1991 to 2021 (www.abs.gov.au)
Page 16age-specific incidence rates recorded over the last 3 (non-Indigenous) or last 4 (Indigenous)
years. The historical and projected age-specific rates are summarised in Figure 1 and Figure
2.
Figure 1: Observed and projected rates, incidence of non-Indigenous RRT patients to 2020
(per million population per year)
Observed and predicted rates, non-Aboriginal
0-24 25-44 45-64
20 60
160
15 50
140
40
10 120
30
Rate (pmpy)
5 100
1990 2000 2010 2020
65-74 75+
500 800
400 600
300 400
200 200
100 0
1990 2000 2010 2020 1990 2000 2010 2020
year
Observed rate & CI Model 1 prediction Model 2 prediction
Graphs by agecat
Figure 2: Observed and projected numbers of incident Indigenous RRT patients to 2020
Observed and predicted rates, Aboriginal
0-24 25-44 45-64
800 3000
60
600
40 2000
400
20 1000
200
Rate (pmpy)
0 0 0
1990 2000 2010 2020
65-74 75+
4000 3000
3000
2000
2000
1000
1000
0 0
1990 2000 2010 2020 1990 2000 2010 2020
year
Observed rate & CI Model 1 prediction Model 2 prediction
Graphs by agecat
Page 17There is little variation between the two models when applied to most age groups in either
the Indigenous or non-Indigenous populations. The exception is the non-Indigenous 75+ year
age group, for which Model 1 predicts a rate of 840 per million per year (pmpy) by 2020.
Although this represents a doubling of current rates, it is still significantly lower than the
current rate of ESKD reported for US Whites aged 75+ (1441 pmpy).16 The prediction for the
75+ category is a key driver of the longer term numbers.
Table 1: Predicted incident counts of non-Indigenous patients 2009-2020 (Model 1)
Age group 2009 2010 2011 2012 2013 2014 2015 2016 2017 2018 2019 2020
0-24 74 74 74 74 74 74 74 74 74 74 74 74
25-44 290 295 300 305 310 314 319 323 327 332 337 342
45-64 780 800 818 831 847 864 883 904 924 942 960 976
65-74 611 644 678 727 771 813 857 900 942 986 1025 1063
75+ 604 653 709 771 838 912 994 1083 1184 1292 1421 1564
Total new patients 2359 2466 2579 2708 2840 2977 3127 3284 3451 3626 3817 4019
Table 2: Predicted incident counts of non-Indigenous patients 2009-2020 (Model 2)
Age group 2009 2010 2011 2012 2013 2014 2015 2016 2017 2018 2019 2020
0-24 74 75 76 76 77 78 78 79 79 80 80 81
25-44 295 299 303 306 310 314 318 321 324 327 331 335
45-64 798 811 823 828 836 846 856 869 881 890 899 905
65-74 606 632 658 697 731 761 793 823 851 881 905 928
75+ 528 539 552 566 581 596 613 631 650 670 695 722
Total new patients 2301 2356 2412 2473 2535 2595 2658 2723 2785 2848 2910 2971
Table 3: Predicted incident counts of Indigenous patients 2009-2020 (Model 1)
Age group 2009 2010 2011 2012 2013 2014 2015 2016 2017 2018 2019 2020
0-24 5 5 5 5 5 5 5 5 5 6 6 6
25-44 70 74 78 83 88 94 99 106 113 121 130 139
45-64 155 163 171 180 188 197 206 215 222 230 238 246
65-74 26 28 29 32 34 37 39 42 45 48 51 55
75+ 4 4 4 4 4 5 5 5 6 6 7 7
Total new patients 260 274 287 304 319 338 354 373 391 411 432 453
Table 4: Predicted incident counts of Indigenous patients 2009-2020 (Model 2)
Age group 2009 2010 2011 2012 2013 2014 2015 2016 2017 2018 2019 2020
0-24 6 6 6 6 6 6 6 6 6 6 6 7
25-44 68 69 71 72 74 76 78 79 82 84 87 89
45-64 147 154 160 166 172 178 184 190 195 200 205 210
65-74 25 27 28 30 32 34 36 39 41 44 47 50
75+ 5 5 5 5 5 6 6 6 7 7 8 8
Total new patients 251 261 270 279 289 300 310 320 331 341 353 364
16
USRDS 2009 Annual Data Report: Atlas of Chronic Kidney Disease and End-Stage Renal Disease in the United States,
National Institutes of Health, National Institute of Diabetes and Digestive and Kidney Diseases, Bethesda, MD, 2009.
Page 182.2 Trends and implications
These projections indicate that, in 2020, the number of Australians of all ages commencing
RRT will lie between 3,335 individuals (2,971 non-Indigenous and 364 Indigenous, steady-
state model) and 4,472 (4,019 non-Indigenous and 453 Indigenous, growth model).
Therefore, on the basis of these models, an increase of between 35% and 81% in the number
of new patients commencing RRT above 2008 figures is projected.
These projections are based upon observed, age-specific incidence rates for treated ESKD.
An increasing demand for RRT can be driven both by trends in the incidence and prevalence
of underlying risk factors for CKD, including diabetes, obesity and hypertension, as well as
changing community expectations of access to health care, irrespective of age, and the
ability of the health system to meet these expectations. As noted above, new cases of ESKD
in Australians aged 75 and over contribute significantly to the projected demand for renal
services. However, even when making projections based upon the “Growth” model, the age-
specific incidence of RRT in 2020 amongst Australians 75 and over is lower than the
incidence in this age group in comparable countries including the United States.
In our previous report, the annual number of patients commencing RRT in Australia was
projected to the year 2010. Similarly, Indigenous and non-Indigenous patients were modeled
separately, and two prediction models were created to account for the alternative scenarios
of the continuation of growth trends, or the maintenance of current rates of incidence.
Model 1 (growth model) assumed that the linear trend in age-specific incidence rates over
the period from 1991 - 2004 would be maintained to 2010. Model 2 (steady-state model)
assumed that age-specific incidence rates averaged over the 2002-2004 period would be
maintained to 2010, based on an observed ‘leveling-off’ in incident patient numbers during
these years.
Figure 3 shows that, for the non-Indigenous population over 25 years of age, the observed
number of new patients commencing RRT in each of the years 2005-2009 most closely
approximates the growth model for this period. This observation lends credibility to the
upper-range projections reported here for the period 2009-2020.
Page 19Figure 3: Observed and projected RRT counts 2004-2010, (A) non-Indigenous population
aged 25 years and older, (B) Indigenous population aged 25 years and older
A B
2500 350
2250 300
n
n
2000 250
1750 200
1500 150
2004 2005 2006 2007 2008 2009 2010 2004 2005 2006 2007 2008 2009 2010
Observed Observed
Model 1 Projections Model 1 - Growth, high-range
Model 2 Projections Model 2 - Growth, low-range
Model 3 - Stable high-range
Model 4 - Stable, low-range
Page 20Chapter 3 ESKD overview – current data and trends
3.1 Changes in demographics of the population on RRT 2004-2008
In our original report we noted the approximately linear growth of the RRT population in
Australia over the period from 1991-2004. In the five years since the original report, the
number of Australians receiving RRT has continued to increase, from 14,291 individuals (711
pmp) at 31 December 2004, to a figure of 17,578 (822 pmp) reported as of 31 December
2008.17 The annual intake of new patients commencing RRT has increased over this interval,
from 1,949 individuals (97 pmp) in 2004, to 2476 (116 pmp) individuals in 2008, an increase
of nearly 20%. Population-adjusted incidence rates are highly variable across the States and
Territories, ranging from a high of 405 pmpy in the Northern Territory to 99 pmpy in Victoria.
For Australia as a whole, increases in the incidence of treated ESKD have been observed in
all age groups, with the exception of 0-24 year-olds. The largest population-adjusted
increases have been in the 65+ age group (Figure 3). Correspondingly, the median age at
start of dialysis rose slightly from 62.5 years in 2004 to 63.1 years in 2008. The RRT
population therefore continues to grow with a demographic shift towards older age groups.
Figure 4: Acceptance of new RRT patients 2004-2008,
age specific rates (per million population)17 At the time of our original
report, diabetic nephropathy
had emerged for the first year
as the single most common
cause of ESKD in the Australian
population. Consistent with
international trends, diabetes
has continued for the past five
years as the most common
cause of primary renal disease
in Australians receiving RRT
(Figure 5).
17
http://www.anzdata.org.au/v1/annual_reports_download.html
Page 21Figure 5: Acceptance of new RRT patients 2004-2008, rates by primary renal disease (per
million population)17
3.2 Changes in modality utilisation patterns 2005-2009
National variability in dialysis utilisation patterns reflects differences between the States and
Territories with respect to the scale of the burden of ESKD in the resident population, the
characteristics of ESKD patients and their treatment needs, and the local health services
delivery context. In most State/Territory jurisdictions the majority of patients receive
satellite or hospital haemodialysis rather than the less expensive home-based treatment
options of home haemodialysis or peritoneal dialysis. Although several State jurisdictions
have established targets for home-based dialysis,9 there has been minimal increase in the
proportion of dialysis patients receiving home-based therapies.
Figure 6: Proportions on each dialysis modality within each State and Territory, 2004-200817
100%
90%
80%
70%
60%
50%
40%
30%
20%
10%
0%
QLD NSW ACT VIC TAS SA NT WA
Hospital HD Satellite HD Home HD APD/CAPD
Page 22Data from the ANZDATA registry show that, from 2004 - 2008, there has been a trend
towards expansion of satellite dialysis services (Figure 6). Home-based dialysis therapies are
accessed by a variable proportion of dialysis patients; from 41.8% in New South Wales in
2008 to 13.1% in the Northern Territory. This proportion has fallen in the ACT, increased in
Tasmania and appears relatively stable in other states.
Figure 7: Annual cumulative number of kidneys Of the Australians receiving RRT on
transplanted from deceased donors, 2005-201018 31 December 2004, 44% had a
functioning transplant. As of 31
December 2008, this proportion was
essentially unchanged with 43%
having a functioning kidney
transplant. Nevertheless, there have
been recent increases in organ
donation and transplantation in
Australia. In particular, 2008 saw a
substantial increase in transplant
numbers. With 813 kidney transplant
operations performed, this
represented the highest annual
number of transplants performed in
Australia and is attributable to
increases in both living and deceased donor transplants. As shown in Figure 7, the increased
number of kidneys retrieved and transplanted from deceased donors was sustained in 2009,
and initial data for 2010 indicate that there might be further increases in deceased donation.
In response to survey data indicating that 40% of Australians do not know the donation
wishes of family members, the Organ and Tissue Authority launched its DonateLife
campaign19 on 22 May 2010. The mass-media campaign ran nationally until 30 June 2010
and included television, radio, outdoor, online, cinema and print advertising, as well as
outdoor activities for the public. Actual deceased donors in June 2010 totalled 31, compared
with 17 in June 2009 and 18 in June 2008. Ongoing monitoring and evaluation will
substantiate whether short-term trends in increased deceased kidney donation will be
sustained.
18
http://www.anzdata.org.au/anzod/v1/summary-org-donation.html
19
http://www.donatelife.gov.au/News-and-Events/News/Media-Releases/Prime-Minister-Launches-Donatelife-Discuss-It-
Today-OK.html
Page 23Chapter 4 Current and future costs of ESKD
4.1 Research Questions
What is the total cost of treating new and existing ESKD?
What are the costs and benefits of increasing the proportion of patients on home-based
dialysis?
What are the costs and benefits of increasing the proportion of patients treated with
transplantation?
4.2 Overview of Methods
The approach used in this analysis follows a previously developed and reported
methodology for the analysis of costs and benefits of RRT in Australia.4 Many of the data
limitations identified in this earlier work are also applicable in the current setting. These
estimates of costs and benefits exclude the following: i) the costs and benefits of providing
RRT services to Australians under 25 (less than 3% of new cases); ii) the costs of providing
services for co-morbid conditions such as cardiovascular disease and diabetes; and iii) the
indirect or non-health sector costs associated with ESKD. Additional detail of the model, data
sources and assumptions are reported in Appendix B – Model Methods.
4.2.1 The Economic Model
A Markov model was constructed as the basis for estimating the costs and benefits of RRT in
Australia over 2009-2020. This model is based upon the general structure (including
assumptions) of the earlier model, with cohort transition probabilities based upon an
updated ANZDATA data set of patient outcomes and transitions estimated from incident
patients commencing RRT over the timeframe 2004 - 2008.
The model follows multiple cohorts of patients newly treated for ESKD (i.e. commencing
RRT), along with existing RRT patients. The length of each ‘treatment’ cycle in the model is
one year. The structure of the model is shown in detail in Appendix B. The model is stratified
by age.
In the absence of good-quality individual randomised control trials or large prospective
observational studies conducted in Australia, this study uses the best available Australian
data to derive estimates for the model parameters. This required a substantial secondary
analysis of ANZDATA in order to derive transition probabilities between health states and
RRT modalities. Details of the sources of cost and quality of life data are outlined in the
following section. If no published evidence or registry data could be found, the opinion of
clinical experts was sought.
Rates of treated ESKD for years 2009 - 2020 were projected based on two models of
incidence in the non-Indigenous and Indigenous populations: a growth model assuming that
linear increases observed over the period 2000-2009 are maintained to 2020; and a steady-
Page 24state model assuming that current rates are maintained to 2020. Details of the modelling of
future ESKD incidence are given in Section 2.1.
4.2.2 Health State Utilities (Quality of life weights)
There are no Australian data on utility (QoL) scores for patients in pre- (i.e. dialysis) and
post-transplant health states. The health utility scores for dialysis and post-transplant
states, derived from published international sources, are summarised in Table 5.
Table 5: Health utility scores for dialysis and post-transplant states
Assumptions Value Source Justification for source
Renal transplant Laupacis et al (1996) Pre-and post-transplant time
Time after transplant trade-off (TTO) utility
1 month 0.68 valuation study conducted
3 months 0.71 on transplant patients and
6 months 0.75 on dialysis patients (pre-
12 months 0.74 transplant)
Time weighted average 0-12 months 0.7325
18 months 0.7
24 months 0.7
Time weighted average 12-24 months 0.7
Dialysis (pre-transplant) 0.55 Laupacis et al (1996)
Death 0 Convention
Page 25You can also read