Promoting Cleaner & Efficient Vehicles in Malawi - Jane Akumu UN Environment - UNEP
←
→
Page content transcription
If your browser does not render page correctly, please read the page content below

Promoting Cleaner
& Efficient Vehicles
     in Malawi

               Jane Akumu
              UN Environment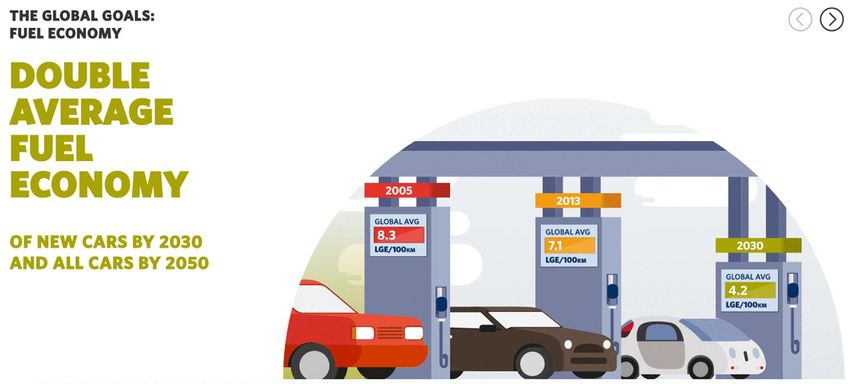
Impacts of Transport
Air Quality & Health
• Largest source of air pollution in
  cities, exceeding WHO standards
  and costing more than 5% GDP

Energy Security
• Consumes 25% of world energy,
  90% are fossil fuels

Climate Change
• Responsible for 23% global CO2
  emissions & fastest growing
  sector in GHG emissions, 2.5%
  yearly until 2020

CO2 Emissions from Transport

What is fuel economy?
• Vehicles use energy, and fuel economy measures energy per
  unit of vehicle travel. It is the RATE of energy use.
   • Litres per 100km (Europe)
   • Km per litre (Japan)
   • Miles per gallon (United States)

• Fuel economy, fuel efficiency, fuel intensity are all fairly
  interchangeable terms. But fuel economy always refers to fuel
  use relative to distance travelled.

• Also measured in CO2 emissions=CO2 g/km
GFEI Benefits
• Reduced urban air pollution

• Fuel savings: estimated at over
  USD 300 billion in 2025 and 600
  billion in 2050

• CO2 reduction: estimated at over
  1 gigatonne a year by 2025 and
  over 2 gigatonnes by 2050

  Partners

 Donors
Japan Automobile Manufacturers Association, Inc.

                               ◆ CO2 Emission Reduction in Japanese Transportation Sector

                               290

                               280
                                                                                                       22    Fuel Economy
                               270
                                                                                                             Traffic Flow
CO2 emissions (million tons)

                               260                                                                     11    Eco-Driving
                                                                                                             Alternative Fuels
                               250
                                                                                                             Travel Distance
                                                                    Integrated Approach                18    (modal shifts, etc)
                               240

                                                       Government                         Automakers
                                                                                                       8     Others
                               230
                                                            Fuel/Energy
                                                                                 Consumers
                               220                           Suppliers

                               210
                                     1990 91 92 93 94 95 96 97 98 99 2000 01 02 03 04 05 06 07 08 09
                                                                                                             Year

                                                                                                                    source : JAMA   7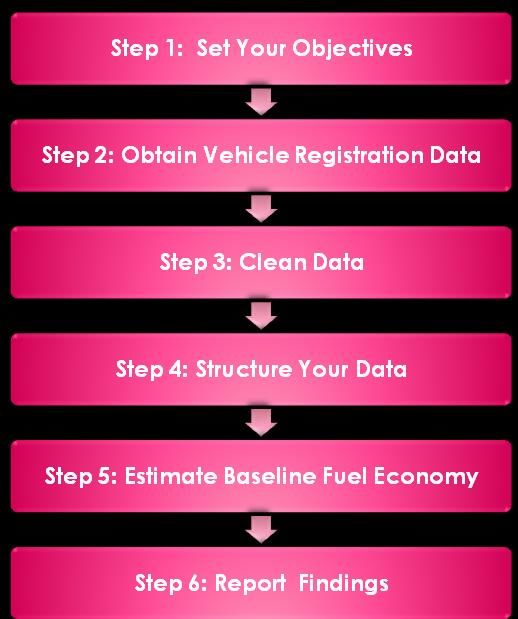
Cumulative oil savings from selected
  vehicle fuel-economy standards, 2010-2035

                                        8
    Billion barrels of oil equivalent

                                        7
                                        6
                                        5
                                        4
                                        3
                                        2
                                        1
                                        0
                                            United States   European Union   China   Japan   India

Already adopted & planned fuel-economy standards for passenger vehicles in the US,
 Japan, EU, China & India alone are set to save cumulatively 17 billion barrels of oil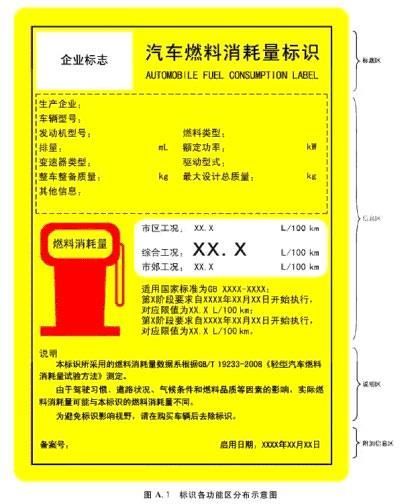
countries with ongoing
                                        new countries 2016/2017   Countries expressed interest
                      projects
                1Chile                    28Malaysia              63Panama
                2Ethiopia                 29Bangladesh            64Iran
GFEI Country    3Indonesia
                4Kenya
                5Georgia
                                          30Kazakhstan
                                          31Mali
                                          32Nigeria
                                                                  65Angola
                                                                  66Bhutan
                                                                  67Burkina Faso

Engagement      6Ivory Coast
                7Mauritius
                8Jamaica
                                          33Togo
                                          34Tanzania
                                          35Rwanda
                                                                  68Burundi
                                                                  69Cambodia
                                                                  70Cameroon
                9Montenegro               36Bolivia               71Cape Verde
               10Macedonia                37Argentina             72D.R. Congo
               11Costa Rica               38Ecuador               73Eritrea
               12Vietnam                  39Ukraine               74Fiji
               13Morocco                  40Jordan                75Guinea
               14Bahrain                  41Colombia              76Iran
               15Tunisia                  42Djibouti              77Kyrgyzstan
               16Thailand                 43Dominican Republic    78Laos
               17Peru                     44Guatemala             79Lesotho
               18Russia                   45Moldova               80Marshall Islands
               19Benin                    46Pakistan              81Mongolia
               20Algeria                  47Barbados              82Namibia
               21Uruguay                  50St. Lucia             83Niger
               22Nepal                    51Lebanon               84Papua New Guinea
               23Paraguay                 52Zambia                85Senegal
               24Sri Lanka                53Ghana                 86Sierra Leone
               25Philippines              54Malawi                87Solomon Islands
               26Uganda                   55Zimbabwe              88South Africa
               27Egypt                    56Honduras              89Tajikistan
                                          57Nicaragua             90Turkmenistan
                                          58El Salvador           91Turkey
                                          59Botswana              92Armenia
                                          60Mozambique            93Azerbaijan
                                          61Myanmar               94Serbia
                                          62Liberia               95Samoa
                                                                  96Gambia
                                                                  97Uzbekistan
                                                                  98Bosnia-Herzegovina
                                                                  99Albania
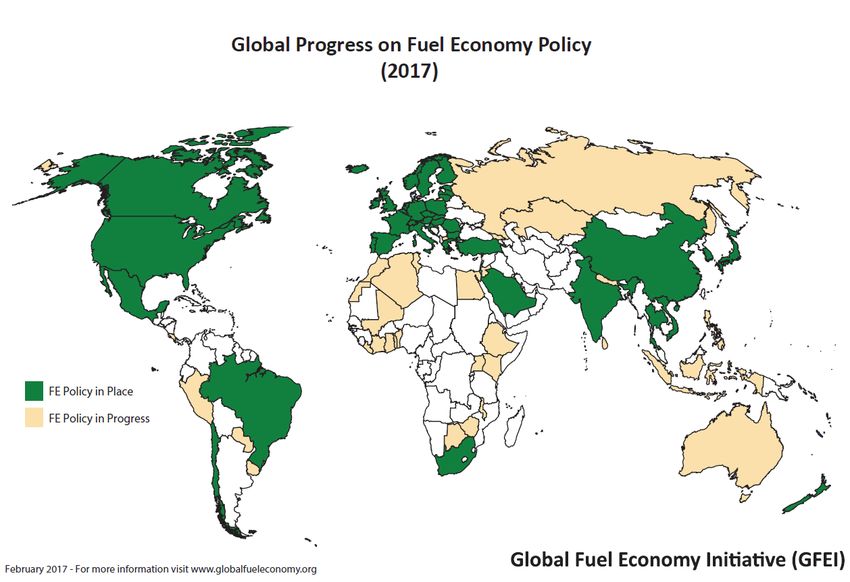
Regional fuel economy trends
• Countries with FE policies in place show encouraging improvement rates
• Size shift vs. technology evolution moderates non-OECD improvement

                                                        Source: IEA 2014
Average Fuel Economy Levels
Global 2005 2008 2011 2013 Uganda 2005 2008 2011 2014
Average 8.07 7.67 7.2 7.1 Average 10.94 11.14 11.34 12.15
(l/100km) (l/100km)
OECD 8.1 7.6 7.0 6.9
Average
Non-OECD 7.5 7.6 7.5 7.2
Average Kenya 2010 2011 2012
Average 7.4 7.6 7.7
(l/100km)
Mauritius 2005 2013 2014
Average 7.0 6.6 5.8
(l/100km)
Ethiopia 2005 2010
Algeria 2005 2008 2013 Average 8.4 7.9
(l/100km)
Average 7.5 7.4 7.0
(l/100km)Example of Uganda Uganda 2005 2008 2011 2014 Average 10.94 11.14 11.34 12.15 (l/100km)
Kenya Fuel Economy Levels

                     Average fuel consumption
       Year                                        Average CO2 emission (g/km)
                   metric combined (L/100km)
      2010                                  7.4                           178.2
      2011                                  7.6                           182.0
      2012                                  7.7                           185.4
Grand Average                               7.5                           181.7

                Year of vehicle                   Fuel Type
                   registration    Diesel           Petrol       Grand
                                                                Average
                  2010              8.0              7.2          7.4
                  2011              7.9              7.5          7.6
                  2012              8.0              7.6          7.7
                Grand Average       8.0              7.4          7.5
Fuel economy policies can work
substantially
Baseline Light-Duty Vehicle Fuel Economy and Trends for New LDVs Algeria
14 Bahrain
Chile
Liters per 100 kilometers (L/100km) normalized to NEDC Test Cycle
China
12 Costa Rica
Cote d'Ivoire
Egypt
10
Ethiopia
EU
8 Georgia
Indonesia
Japan
6 Kenya
Mauritius
Montenegro
4
Peru
Philippines
2 Sri Lanka
Uganda
Uruguay
0 US
2005 2007 2009 2011 2013 2015 2017 2019 2021 2023 2025
Source: UNEP, 2017 (unpublished).
15GFEI objectives at country level • Inventory of the current situation on fuel economy • Support government agencies to develop sound policies to encourage fuel economy improvement for vehicles produced and/or sold in their countries • Involve stakeholders to better understand the potential for fuel economy improvements and solicit their support • Support awareness initiatives to provide consumers and decision makers with information on options • Long term strategy that will involve multiple policy interventions
Vehicle Type
                                     GFEI Activities
Model
Manufacturer
Body type
                                           Data Collection
Simplified Body Type                        & Analysis
Segment
Axle configuration
Driven wheels
Engine cylinders
Engine ccm
CC Category
                       Information                           Support Policy
Engine kW
                        Campaigns             GFEI           Making Efforts
KW class
Engine horse power
Engine valves
Fuel type
Model year
Number of gears
Transmission type                            Outreach to
Turbo
                                            Stakeholders
Gross vehicle weight
Height
Length
Number of seats
GFEI is important to African countries
• The project provides a
good understanding of
vehicles imported into
the country e.g.
models, sizes,
technologies
• This will allow
policymakers to choose
the right combination
of policy instruments to
meet
o national emission
targets
o energy security, and
o efficiency goalsFuel Economy Estimation
• Data Collection
o Baseline Setting - 2005
o Analysis of Trend
(2010, 2013, 2016)
• Analysis of
o Vehicle fleet
o Vehicle regulations
o Fiscal incentives
o Fuel standards
• Policy Options
• National Consultations
• Regional ConsultationsVehicle data categories
• Data to be collected is for all vehicles entering a
country for the first time:
o new vehicles manufactured in the country
o new vehicles imported
o second hand vehicles imported into the country
o car that is already in-country, but re-registered
because re-sold should not be counted
• Useful to keep separate track of these categories of
vehicles, as well as creating a combined average set
of informationMinimum vehicle information required • Vehicle make and model • Model production year • Year of first registration • Fuel type (petrol or diesel) • Engine size • Domestically produced or imported • New or second hand import • Rated Fuel Economy per model and test cycle basis • Number of sales by model
Additional information

•   Vehicle Information / Identification Number
•   Injection system type
•   Body type
•   Transmission type and other vehicle configuration
    details, as available
•   Vehicle foot print
•   Vehicle curb weight
•   Emissions certification level
•   Use of vehicle (private, public, for hire, etc.)
Estimating average fuel economy • Look for the tested fuel economy number for the vehicle • If not available the fuel economy figures for a given make, model and year can usually be retrieved from the vehicle manufacturers • GFEI partners are compiling a list of fuel economies into a common database for use by countries undertaking baseline-setting exercise • For the sake of comparison, all drive cycle data obtained be converted to the NEDC cycle • Conversion factors can be downloadable from ICCT website www.theicct.org/info/data/GlobalStdReview_Conversionfac tor.xlsx
Final Data

                                                   Engine   Fuel     Model     Registration
Make         Model     Condition       Body Type   CC       Type     Year      Date              L/100km         CO2

BMW          316I      Used            S.WAGON     1596     Petrol      1989              2005             7.5         176

CHEVROLET    OPTRA     Used            SALOON      1799     Petrol      2005              2005             6.2         145

CHEVROLET    NULL      Used            S.WAGON     1799     Petrol      2005              2005             6.2         145

NISSAN       SUNNY     Not Specified   SALOON      1970     Diesel      1998              2005             6.6         177

MITSUBISHI   LANCER    Used            SALOON      1600     Diesel      1998              2005             6.9         185

SKODA        OCTAVIA   Used            SALOON      1800     Diesel      2004              2005             7.0         188

SKODA        OCTAVIA   Used            SALOON      1800     Diesel      2005              2005             7.0         188

TOYOTA       COROLLA   New             S.WAGON     1970     Diesel      1998              2005             7.0         188

TOYOTA       COROLLA   New             SALOON      2000     Diesel      1998              2005             7.0         188

FORD         RANGER    New             VAN         2500     Petrol      2005              2005             8.1         170

HONDA        CR-V      NULL            S.WAGON     1970     Petrol      1998              2005             9.3         217
Average fuel economy At the simplest level, taking a weighted average (by sales) of all new (including newly imported second hand) vehicles in the database will provide the average fuel economy of new vehicles sold in the country in the given year: In a similar way, average CO2 intensity can be obtained through weighted average with the sales of each model:
Additional information

•   A Test Cycle Conversion Tool: www.theicct.org/info/data/GlobalStdReview_Conversionfactor.xlsx

•   A global comparison of Vehicle Fuel Economy Standards: http://www.theicct.org/passenger-vehicles/global-pv-
    standards-update/

•   South African Comparative Passenger Car Fuel Economy AND CO2 Emissions Data:
    http://www.naamsa.co.za/ecelabels/

•   UNEP Vehicle Fuel Efficiency Baselines: Practicalities and Results - Global Fuel Economy Initiative in Africa,
    Working Session, November 2010. Summary and Country Case Study Presentations:
    www.unep.org/transport/PCFV/PDF/GFEIAfricaSummary_30%20November2010.pdf

•   U.S. Light-Duty Automotive Technology, Carbon Dioxide Emissions, and Fuel Economy Trends (1975 through
    2010): http://www.epa.gov/OMS/fetrends.htm

•   U.S. Fuel Economy Policy: http://www.fueleconomy.gov/

•   U.S. Fuel Economy Regulations: http://www.epa.gov/oms/climate/regulations.htm

•   U.S. Auto Fuel Economy Database: http://www.fueleconomy.gov/feg/findacar.htm
Fuel economy policies & instruments
Target group:
Consumer
Consumer
Monetary information
Fiscal Labelling
instruments
FE
Regulatory
Fuel economy
or CO2 emission
standards ManufacturerChina’s Example • China introduced Fuel Economy Standards for LDV in September 2004: phase 1 from July 2005 and 2 phase from Jan 2008 • 3rd most stringent in the world, behind the EU and Japan • requires display fuel economy labels from 2009 • banned the import of used vehicles for uses other than personal, diesel vehicles (except Jeeps) and two-stroke engine cars • penalize large-engine cars and encourages the purchase of fuel efficient cars
European Union

• 12% of total CO2 emissions from transport

• mandatory emission reduction targets for
  new cars

• average for all new cars is 130 grams of CO2
  per kilometre (g/km) by 2015 and 95g/km
  by 2021

• reductions of 18% and 40% compared to
  2007 -158.7g/km

• fuel consumption, the 2015 target is 5.6
  l/100 km of petrol or 4.9 l/100 km of diesel.
  The 2021 target to 4.1 l/100 km of petrol or
  3.6 l/100 km of diesel
Mauritius

• Vehicle CO2 tax introduced 2011
• Adopted a feebate scheme in 2011 that puts a fee/rebate
  on cars above/below 158 CO2g/km
• 2013 amended to 150 CO2g/km
• Scheme resulted to an improvement of fuel economy from
  7l/100km in 2005 to 5.8l/100km in 2014
• 50 % excise duty waived on electric and hybrid cars and
  Registration fee also reduced by 50%
• From 2009 to 2014, the number of hybrid and electric cars
  has increased from 43 to 1824 and from 0 to 8 respectively
• 2016 feebate abolished and moved to taxation system with
  additional incentives to electric vehicles
Hybrid and Electric cars in Sri Lanka
• Hybrid and electric cars in 2014 was 56% of the total
  number of cars
• Hybrid-petrol, petrol and diesel vehicles attract 58%, 253%
  and 345%, respectively, in excise tax
• Fully electric vehicles are levied at 25%.

31
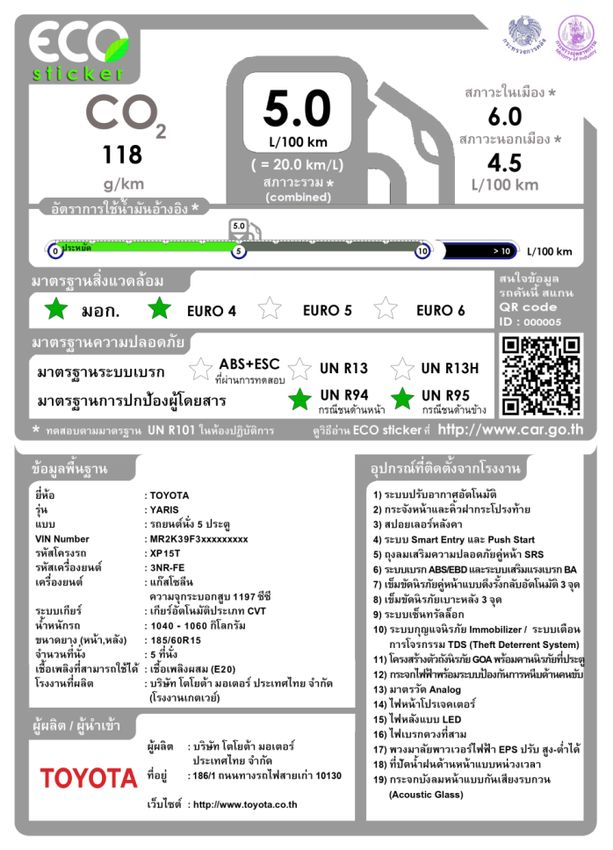
Labeling and CO2-based Tax in Thailand

  • Vehicle excise tax   Types of Vehicles                         Fuel type / Tax rates

    rates in Thailand                        CO2/ engine           E10/        E85/          Hybrid
                                             capacity              E20         NGV
    combines CO2
                         Passenger           ≤ 100 g/km            30          25            10
    ratings and engine   vehicles – cars                                                     20
                                             101-150               30          25
    capacity             and vans with       g/km
                         less than 10
  • Mandatory eco-       seats               151-200               35          30            25

    sticker                                  g/km
                                             >200 g/km             40          35            30

                                             >3,000 cc             50          50            50

                         ~~~~~~
                         Electric            ≤ 3,000 cc                             10
                         vehicle/ fuel       (180 Kw)
                         cell                > 3,000 cc                             50
                                             (180 Kw)

                                               Source: Energy Policy and Planning Office and Department of
  32                                                                 Alternative Energy Development, 2015
Summary • High growth rate of passenger car sales (and other vehicles) with relatively high fuel economy will persist without fuel economy policies • Implementing fuel economy policies can substantially reduce CO2 emissions – supporting the Paris Agreement • Also reduces fossil fuel consumption and national expenditures on fossil fuels • Improves air quality through adoption of more advanced vehicles and technologies
Air Quality and Mobility Unit
Economy Division
United Nations Environment
P.O. Box 30552
00100 Nairobi
Kenya

E-mail : Jane.Akumu@unep.org
You can also read