Protected areas, tourism economy and employment generation: A case study from India
←
→
Page content transcription
If your browser does not render page correctly, please read the page content below
Ecological Questions 31 (2020) 1: 23–33                                                     http://dx.doi.org/10.12775/EQ.2020.004

   Protected areas, tourism economy and employment generation:
                       A case study from India

                                 Shweta Sharma*, Shamli Sood, Pradeep Chaudhry

                       Indian Institute of Forest Management, Nehru Nagar, Bhopal, India – 462003
                                               *e-mail: ssharma20@iifm.ac.in
                                Received: 24 September 2019 / Accepted: 23 November 2019

Abstract. Wildlife tourism in the form of Tiger Tourism dominates in India as the country is home to more than half of the world’s
tiger population. The first tiger reserve was established in India in 1973.At present, there are 50 tiger reserves in the country, which
are administered by the National Tiger Conservation Authority (NTCA) at the central level and state forest & wildlife departments at
the field level. The present case study concerns the assessment of tourism economy and employment generation in one of the promi-
nent tiger reserves in India, i.e. the Satpura Tiger Reserve of the Madhya Pradesh state. Based on the primary and secondary data, it
has been estimated that the expenditure incurred by tourists in the Satpura Tiger Reserve between 2017 and 2018 amounted to INR
1,110 million (equivalent to USD 15,416,666; 1 USD = 72 INR). At the same time, around 127,187 man-days were generated for the
nearby local community from the tourism establishments.

Key words: protected area, tiger reserve, livelihood generation, community development, Pachmarhi Biosphere Reserve.

                      1. Introduction
                                                              state of India is known as tiger state of India because of the
                                                              maximum tiger presence while comparing with other states.
Protected areas (PAs) cover around 12 % of the world’s The state is bestowed with luxuriant forest which covers
geographical area (Chape et al, 2005). Though recorded more than 30% of its geographical area. There are six ti-
forest area of India is about 23.34 % (State of Forest Re- ger reserves, many national parks and sanctuaries, inhabit-
port, 2017) but the country’s protected area network cov- ing rich biodiversity along with picturesque landscape and
ers less than 5 % of the country’s area. India’s 771 PAs water bodies in the state. Studies related to the assessment
are small (average size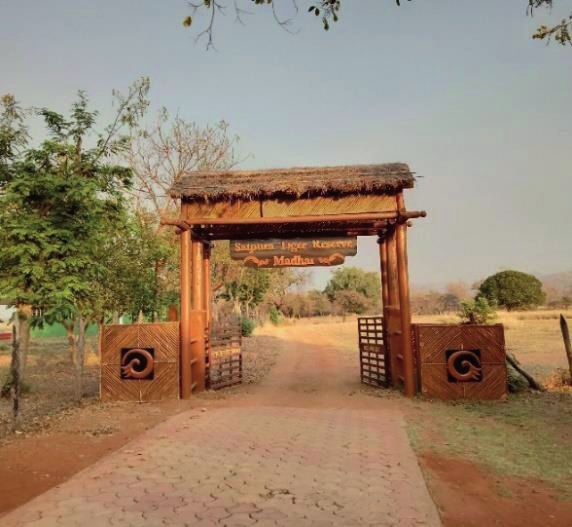
24 Shweta Sharma, Shamli Sood, Pradeep Chaudhry
Figure 1. Map of India Figure 2. Map of STR
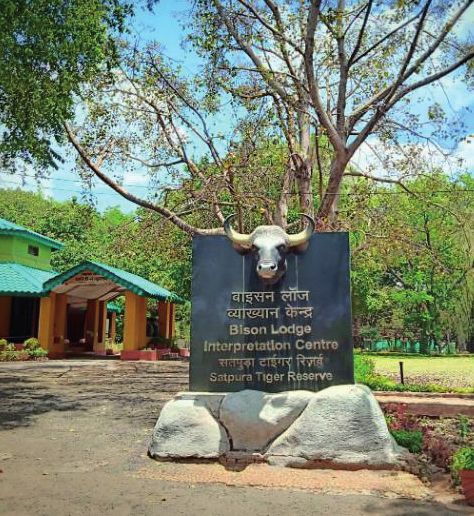
Figure 3. Entry gate of Satpura National Park Figure 4. Bison Lodge interpretation center at Pachmarhi
2. Study Area different altitudinal levels the reserve is the home to almost
62 big trees species, 30 small tree species, 58 shrub spe-
Satpura Tiger Reserve (STR) is located in Hoshangabad cies, 32 climber species, and nearly 64 grass species. Many
district of Madhya Pradesh. Its name is derived from San- rare and endemic species of medicinal plants and herbs are
skrit word Satpura which means seven mountains. It en- also found in this area. The reserve also provides home to
circles three protected areas namely Satpura National Park around 52 species of mammals and 31 species of reptiles.
(528.73 km2), Bori Sanctuary (485.71 km2), and Pachmarhi Moreover, STR is very rich in avian diversity as more than
Sanctuary (491.63 km2) which forms the Critical Tiger 300 species of birds are found in this tiger reserve (Satpura
Habitat (CTH), and a peripheral buffer area of 794.04 km2. Tiger Reserve).
National Tiger Conservation Authority guidelines allow
tourism only in 20% (301.214 km2) of the CTH. Due to
the combination of various climatic and edaphic factors at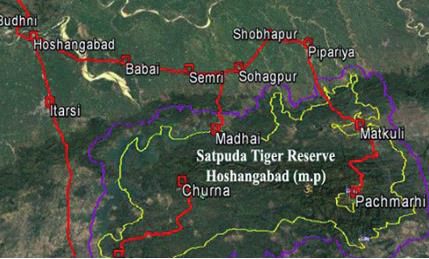
Protected areas, tourism economy and employment generation: A case study from India 25
7RXULVP=RQHVLQ675 LVIURP%KLPNXQGEDUULHU9LVLWRUVFDQH[SORUHWKLVDUHDLQ
their private vehicles.
Madhai
Bagra Buffer
This place falls under the core area of STR. The visitors
have to cross the Denwa river to reach this area. The eco- This buffer zone is located nearby Madhai. The visitors can
tourism activities offered in this area include vehicle safa- explore this area with their vehicles or any other private
ris, elephant safaris, boat riding, and canoeing. A vehicle vehicle owned by locals or resort owners. Only 56 vehicles
entering through this gate (Fig. 3) can choose any path can enter this buffer area per day either through Paraspani
DPRQJ .HUL\D -KLQMKLQL 0DKDO /DJGD DQG &KXWNLGHY gate or through Jamanidev gate.
Only 38 vehicles per day are allowed to enter the gate,
including morning and evening Safaris.
3. Materials and methods
Pachmarhi
Based on the understanding of existing literature, struc-
Pachmarhi (a hill station) was discovered by Captain J. tured questionnaires were prepared for three stakehold-
Forsyth of the British Army in 1862 and is designated as ers: tourists, hotels, and local professionals/businessmen
Queen of Satpura. It is under the administration of Canton- (Table 1). These questionnaires were modified later in the
ment Board (CB), Indian Army. The tourism at Pachmarhi field to incorporate some of the points that were left out
is based mainly on sight-seeing and is different from other while preparing the questionnaires.
tourism zones of STR, where predominantly tiger tourism Following secondary data was collected for the year
prevails. Endowed with a large number of waterfalls, nar- 2017-18, from the main office of MPTFS to meet the
row gorges, caves, mountain peaks, and ancient temples, objectives of the study:
Pachmarhi is a naturalists’ paradise. There are more than Number of domestic and foreign tourists visiting the
30 forest points in this area. Some of these points can only tourism zones of STR.
be accessed after getting entry ticket from Bison lodge Number of vehicles entering the tourism zones of STR.
(Fig. 4). which was the first building built at Pachmarhi Fund allocated to STR from the central and state gov-
by Captain J. Forsyth, and is now a wildlife and cultural ernment.
interpretation centre. Also, Pachmarhi is significant from Revenue generated from the park in the form of entry
the archaeological viewpoint as many of the rock paintings fee, rest house fees etc.
engraved on the caves are believed to be about 1000 years )LQDQFLDOVWDWHPHQW 9LNDV1LGKL ZKLFKLVDOVRNQRZQ
old. In May 2009, Pachmarhi was added to include in the as the Park Development Fund (PDF).
list of Biosphere Reserves by the UNESCO. The secondary data was analyzed to determine the net
economic value of tourism in the Satpura Tiger Reserve.
Churna 80 tourists and 10 hotels were surveyed in Madhai, in-
cluding samples of adjoining areas (Churna and Bagra
This area is situated in the deep core forest. There are two Buffer area). The tourists were surveyed at the entry gate
entrances to this area; one is from Madhai, and the other as well as in the hotels/resorts. 300 tourists and 40 hotels
Formulae Sheet
Tourist expenditure = (Stay +Food + Travel+ Souvenir +Other) expenditure
7RWDOQXPEHURIHQWULHV 1XPEHURIYLVLWRUVLQDJURXS 7RWDO6DIDULWDNHQSHUJURXS
Average expenditure per entry = Total expenditure of all entries/ Total number of entries
Expenditure incurred by entries in single strata= Average expenditure per entry * (Number of entries of given
strata in the sample / Total number of entries in the sample) * Total entries in a particular year
Total expenditure incurred by tourist = Expenditure incurred by tourists in all strata + Total entry fees in
a particular year + Total Gypsy fees + Total Guide fees
Leakage = Total expenditure incurred by tourists including entry and Gypsy fees- Total amount retained by
service providers involved in tourism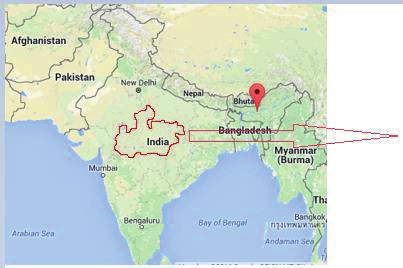
26                                     Shweta Sharma, Shamli Sood, Pradeep Chaudhry

Figure 5. Number of Indian and foreign entries in Madhai , Churna, and Bagra Buffer in 5 years

and 30 local professionals/businessmen were surveyed/                                    4. Results
interviewed at Pachmarhi to find out the amount that is
getting inflexed into the local economy. In nutshell thus,                                 Madhai
overall 380 tourists, 50 hotels, and 30 local businessmen                               Tourist inflow
were surveyed. Convenience sampling, a non-probabilis-
tic sampling technique where tourists are selected because       Figure 5 shows the trend of Indian and Foreign tourists in
of their convenient accessibility as well as proximity to        Madhai, Churna, and buffer area for the period 2013-14 to
the researcher, was used. Using this sampling technique          2017-18. It is observed that there has been a continuous
data was collected from tourists, hotels, and local profes-      increase in the number of tourists entering the park from
sionals/businessmen. The tourists were divided into three        2013-14 till 2017-18 except for the year 2016-17, and the
strata named as budget, premium, and luxury depending on         main reason behind the decline of tourist in 2016-17 was
their accommodation expenses. The expenditure incurred           demonetization that took place in India from November,
by each stratum was calculated separately using formulae/        8th 2016 night. During the demonetization process, INR
equation as given in the box.                                    500/- and INR 1000/- were discontinued by Central Gov-
    Like tourists, hotels were also divided into strata named    ernment to curb the black money in the economy of the
as budget, premium, and luxury, depending on their aver-         country.
age tariff/night. Afterward, average annual occupancy and
tariff/night were calculated for each segment1. Finally us-                         Primary Data Analysis
ing this average value, total income was calculated for each
strata of hotels. This annual turnover was calculated for        80 tourist units2 were surveyed at Madhai. Based on the
273 days in Madhai as the park remains open for about            unit/group size, the total visitors were 310. Out of these,
9 months only during the year and for 365 days in Pach-          11 tourist units came from Pachmarhi, so their expenditure
marhi as it remains open for 12 months at Pachmarhi. The         was included in Pachmarhi, and also there were 3 day-vis-
average earning of local shops and restaurants was also          itors who were excluded from the sample because of their
calculated from the sample size. The annual income was           less representation in the sample. But, there were a day-vis-
calculated by multiplying this value with the total number       itors in actual population, and excluding them may overes-
of shops.                                                        timate the revenue. Therefore, in order to counterbalance

1
  The terms “strata” and “segment” are used interchangeably to   2
                                                                  A tourist unit refer to family or group of people from which
represent category of hotels                                     only one member was surveyed.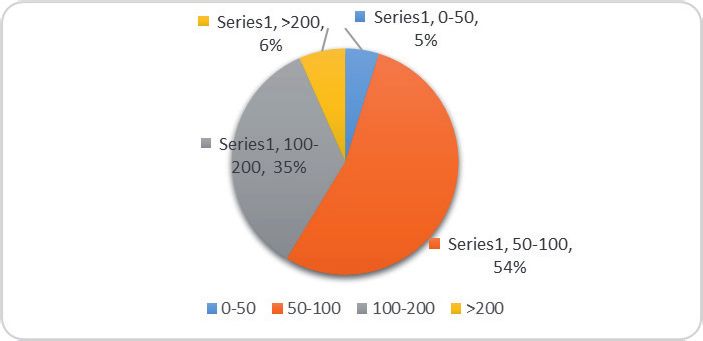
Protected areas, tourism economy and employment generation: A case study from India 27
Following assumptions were taken for carrying out the
analysis:
Foreigner’s package is inclusive of safari charges and
entry fees.
The strata of tourists in the sample taken in the year
2019 is an actual representation of tourists that entered
STR in 2017-18.
The tourists who visited the tiger reserve have taken
a safari.
The employee details of un-surveyed hotels were as-
sumed in the ratio estimated from surveyed ones.
Figure 6. Percentage breakup of tourist units according to their
One day-visitors were taken out of the sample because
monthly income range (expressed in INR 1000)
of their less representation in the sample.
For tourists who didn’t know their hotel price, it has
been estimated from their hotel plans.
this effect, high-end professionals like photographers, re- No. of Man-days generated were calculated considering
searchers, etc. were also excluded from the sample. INR 200 as daily wage.
Figure 6 describes the income range of respondents Foreign tourists’ analysis
surveyed in the field. Number of respondents with income Nine foreigner units were surveyed in Madhai, and all
less than INR 50,000 were comparatively lesser than other of these units encountered in the field fall under the luxury
groups, and the prime reason for that was higher entry and category. Based on the group or family size of surveyed
Safari fees as intimated by few respondents. The expendi- foreign tourist units, the total number of foreign visitors
ture incurred by tourists was calculated differently for the were 26. The average expenditure per entry in case of a for-
foreign and Indian tourists using the formulae sheet. eigner was INR 14,689.34. This value was extrapolated to
Table 1. Objectives for surveying different stakeholders
Questionnaires 2EMHFWLYHV
E
xpenditure details pertaining to food, stay and
Tourists travel
F
eedback of place
O
ccupancy details
Hotels and Resorts Number of local employees
Average tariff/night
Type of business
Local Professional/Businessman
Monthly income
Table 2. Percentage of budget, premium and luxury Indian tourist in a given sample size at Madhai
Category Sample units Percent
Budget 20 35.09%
Premium 25 43.86%
Luxury 12 21.05%
Total 57 100%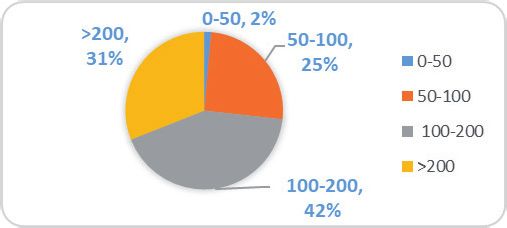
28                                     Shweta Sharma, Shamli Sood, Pradeep Chaudhry

           Figure 7. Number of tourists that entered forest points of Pachmarhi in 5 years

the total number of foreigners that entered Madhai, Churna        luxury tourists. The average amount spent per entry by
and Bagra buffer in the year 2017-18. The total expendi-          a luxury tourist was INR 9,566.46. Therefore, after ex-
ture incurred by foreigners during the year 2017-18 was           trapolating this average to the previous year, the total ex-
estimated to be INR 9,4,129,282.45 (USD 1,324,193.15).            penditure incurred by luxury tourists was estimated to be
                                                                  INR 4,1726,102 (USD 579,529.19).
                  Indian tourists’ analysis                           Therefore, the total expenditure incurred by Indi-
                          Budget                                  an tourists turned out to be INR 104,615,374.80 (USD
                                                                  1,452,991.32). Adding this to the expenditure of foreign-
The tourists who stayed in the hotels ranging below INR           ers, the total expenditure incurred by tourists in year 2017-
5,000/ night tariff were considered as budget tourists. Out       18 was INR 198,744,657.20 (USD 2,760,342.46). After in-
of 57 Indians surveyed, 20 fall under budget category.            cluding the gypsy, guide and entry fees, the total revenue
Based on the group size, 120 visitors were considered             generated from tourism in Madhai, Churna and adjoining
as budget tourists. The average expenditure incurred by           buffer area during the year 2017-18 was estimated to be
budget Indian per entry was calculated to be INR 2,112.21.        INR 221.40 million (USD 3,075,000).
After extrapolating this value to the previous year, the total
expenditure incurred by budget travelers was estimated to                                    9HULILFDWLRQ
be INR 1,9,843,027 (USD 275,597.60).
                                                                  A portion of the revenue generated from Madhai, Chur-
                          Premium                                 na and Bagra buffer was retained by the people involved
                                                                  in tourism in these areas like drivers, guides, and hotels.
The tourists who stayed in the hotels ranging from INR            Since there is no other option of entertainment, the major-
5,000-11,999/night tariff were considered as premium              ity of revenue generated from the above mentioned areas
tourists. Out of 57 Indians surveyed, 25 sampled units fall       was retained within these areas.
under premium category. Based on the group size, 152                  Of the 10 wildlife lodges surveyed, 3 were luxury,
visitors were considered as budget tourists. The average          3 were premium and remaining 4 were from budget seg-
expenditure incurred by premium Indian tourists per entry         ment. The estimated annual turnover of 12 wildlife lodges,
was INR 3,421.29, and after extrapolating this amount to          and associated services in Madhai was INR 164,657,902 or
the previous year, the total expenditure by premium cat-          USD 2,286,915.30. (Table 3). These lodges generate jobs
egory tourists was estimated to be INR 4,3,046,245.64             for residents of Madhai as well as outsiders, the details
(USD 597,864.52).                                                 of which are given below in Table 4.
                          Luxury                                      Of all these employees, the senior-level and middle-
                                                                  level staff were outsiders junior-level staff was from near-
The tourists staying in the hotels ranging above INR              by villages.
11,999/night tariff were considered as luxury tourists. Out           The sum total of annual income of different service
of total Indian surveyed, 12 units were of luxury category.       providers in Madhai was INR.192,697,763.5 or USD
Based on the group size, 38 visitors were considered as           2,676,357.83 (Table 5). Therefore, the leakage in Madhai
Protected areas, tourism economy and employment generation: A case study from India 29
was estimated to be INR 28,340,564.7 (USD 393,618.95) Budget
(Formulae sheet). Some of this leakage was the amount
spent by tourists in reaching the tourism zones via flight, As described in the analysis of Madhai, the tourists that
train or road transport. stayed in the hotel ranging below INR 5,000/ night tariff
were considered as budget tourists. The average expendi-
Pachmarhi ture per entry by budget tourists in Pachmarhi was esti-
Tourist inflow mated to be INR 2,143.47. After extrapolating this to pre-
vious year population, the total expenditure incurred by
Figure 7 shows the trend of tourists in Pachmarhi start- budget travelers turned out to be INR 615,607,446.8 (USD
ing from 2013-14 to 2017-18. Unlike Madhai, the effect 8,550,103.43).
of demonetization was not seen in Pachmarhi, and the tour-
ism in Pachmarhi grew at a rate of 38.30% in 2017-18 as Premium
compared to 2013-14.
The premium tourists are the ones who stayed in the ho-
Primary Data Analysis tel ranging from INR 5,000-11,999. The average expendi-
ture incurred per entry by premium segment was estimated
A total of 300 tourist units were surveyed in Pachmarhi. to be INR 5,069,995,475. After extrapolating this to the
Out of these, 3 were one day-visitors which were excluded year 2017-18, the expenditure incurred by premium tourist
from the sample because of less representation in the sam- turned out to be INR 161,870,996.4 (USD 2,248,208.30).
ple size. Also, 5 other units were excluded from sample Therefore, after adding the entry fees and safari charges
size because these people came to Pachmarhi for other rea- paid by tourists in the year 2017-18, the total expenditure
sons like to attend the marriage. incurred by tourists in Pachmarhi in the year 2017-18 was
Though the high-income range people were compara- estimated to be INR 889 million (USD 12,347,222).
tively less in numbers, the money spent by these people
creates a huge difference (Fig. 8). 9HULILFDWLRQ
Out of 300 tourist units surveyed, only 3 were foreign- Hotel and Resorts
ers, and the remaining 297 were Indians. So, due to less
representation of foreigners in sample size, the analysis Out of 40 hotels and resorts surveyed in Pachmarhi, only
of Indians and foreigners in Pachmarhi was done collec- four were of the premium category, while the remaining
tively. 36 belonged to the budget category.
Table 3. Annual turnover of hotel/resorts/lodges at Madhai
Average occupancy 1R Average tariff Annual income for 273 days
Segment 1RRIKRWHOV
of rooms LQ,15 LQ,15
Budget 45 5 51 3,250 20,362,387.5
Premium 49.67 4 45 8,100 58,710,015
Luxury 60 3 33 15,833 85,585,500
Total 164,657,902.5
Table 4. Number of employees in different strata of hotels
Segment 7RWDOHPSOR\HHV Locals
Budget 23 20
Premium 66 52
Luxury 78 57
Total 167 129Figure 8. Percentage breakup of tourist units according to their monthly income range (expressed in INR 1000)
Table 5. Annual income of different service providers in Madhai
Direct Service Providers $QQXDO,QFRPH LQ,15
Guides 1,931,760
Drivers and Gypsy owners 13,446,000
Hotels 164,657,902.5
Entry Fees ( MP Govt.) 12,662,101
Total 192,697,763.5
Table 6. Annual turnover of hotel/resorts/lodges at Pachmarhi
Average 1R Annual income for 365
&DWHJRU\ 6WUDWD 1RRIKRWHOV Average tariff
RFFXSDQF\ of rooms GD\V LQ,15
Budget 52.97 61 748 2,010.03 290,698,567.70
Premium 66.75 4 94 6,499.50 148,851,061.50
Total 439,549,629.20Protected areas, tourism economy and employment generation: A case study from India 31
The annual turnover of hotels and resorts in Pachmarhi of Madhai and Pachmarhi) was estimated to be INR
was estimated to be INR 439,549,629.20 (USD 6,104,856) 1,110 million (equivalent to USD 15,416,666). Consider-
(Table 6). Like in Madhai these resorts and hotels also gen- ing the multiplier effect (Filion et al.,1994), the net revenue
erate jobs, the rough estimate of which is given in Table 7. generated from Tourism in STR was estimated to be INR
About one third of the total employees were locals and 2,220 million (USD 30,833,332). The income of people
the remaining were from nearby cities (Table 7). from tourist establishments was observed to be 89.40% and
remaining 10.60% was found to be leakage from the area.
Local Businessmen and Professionals At the same time around INR 25,437,500 (USD
353,298.61) was allocated by state and central government
30 local Businessmen and Professionals were surveyed for the construction and repair of buildings, pipelines,
in Pachmarhi. The average annual turnover for the sam- tanks, etc., in STR. Therefore, from a conservative
ple size was estimated, and it turned to be around INR estimate around 127,187 man-days were generated for
602,748.72. Since the total number of registered shops in local community, considering INR 200 as a daily wage.
Pachmarhi was noticed to be 180. Therefore, the annual
turnover of shops was estimated to be INR 108,494,770.3 Biases
(USD 1,506,871.80).
Therefore, INR 799,907,320.9 was retained by the There were biases in the study, some of which were recog-
service providers in Pachmarhi (Table 8), and the remaining nized while others could not be recognized. One of the big-
INR 89,276,367.1 was the leakage (Formulae sheet). gest bias in this study was seasonal bias as the study was
conducted in a period when less number of tourists visit the
Combined Analysis place. Also, different seasons attract different regional tour-
ists e.g., Pachmarhi is dominated by tourists from Gujarat
The total expenditure incurred by tourists in Satpura Ti- during Diwali and tourists from Bengal during Dussehra
ger Reserve in 2017-18 (combining tourist expenditure festival, which might fluctuate the results because of their
Table 7. Number of employees in different strata of hotels
Category 7RWDOHPSOR\HHV Locals
Budget 450 153
Premium 128 41
Total 578 194
Table 8. Annual income of different service providers in Pachmarhi
Direct Service Providers $QQXDO7XUQRYHU LQ,15
Hotels 439,549,629.2
Drivers and Gypsy owners 96,791,096
Guides 9,887,060
Local Businessmen & Professionals 223,756,273.7
Entry Fees 29,923,262
Total 799,907,320.932 Shweta Sharma, Shamli Sood, Pradeep Chaudhry
increased travelling cost, which could not be covered in lodges located in the vicinity of tourism zones. So, a major
this study. Also, there were some personal biases like if portion of the revenue is grabbed by the hotel owners and
some tourists were busy enjoying among their families, staff employed at top level, most of which were outsiders
then those tourists were not surveyed to cause them least This prevents local people from deriving substantial
disturbance. Therefore, our estimate of INR 1,110 million benefits from tourism activities, often marginalizing them
is a conservative one. due to minimal financial benefits (Spiteri & Nepal, 2008).
However, the tiger tourism was started with the prime
motive of providing livelihood to nearby villagers and
5. Discussion lifting their status so as to gain their support in managing
the Reserve. But this objective has somewhere disappeared
Protected areas are under increasing pressure to provide and the local residents are only getting meagre benefits
economic justification for their existence, particularly in from these tourist establishments. Though there is an
developing countries like India where demand for land, increase in the social and economic status of villagers
population density of humans, livestock and forest based living in the vicinity of STR, as compared to their previous
natural resources is very high. On one hand, nature-based situation there is still more that can be done by doing their
tourism is increasing due to increased earnings of middle capacity building and raising environmental awareness
class society, and eco-tourism offers a mechanism to gener- (Walpole et al., 2011).
ate substantial benefits from protected areas for both gov-
ernments on one hand and local communities on the other,
and is increasingly promoted as a sustainable use of pro- 5. Conclusion
tected areas (Goodwin, 2010). The potential role of tour-
ism in contributing towards the costs of conservation and The contribution of STR to the local economy can be
providing economic opportunities for communities liv- divided in two classes namely, wildlife tourism at (pre-
ing adjacent to natural heritage has long been recognized dominantly at Madhai) and sight-seeing (predominantly
(Goodwin, 2010). It is also true that much attention has at Pachmarhi). The former class contributes only 19.90%
been paid to the research conducted in environmental/bio- to the local economy whereas the latter’s contribution is
diversity conservation effects whereas very less literature around 80.10%. The reason behind less footfall of tour-
is available on social and economic impacts of protected ists in Madhai is because of more orientation of domes-
areas on nearby community (Fortin & Gagnon, 1999). tic travelers towards sight-seeing. At the same time, wild
Protected areas are expected to directly contribute to life tourism is considered to be more expensive, and wild-
national development and poverty reduction (Naughton- life areas are visited by wildlife enthusiasts only. How-
Treves et al., 2005). We are not aware of any study re- ever, there is a significant increase of tourists in Madhai
lated to development of tourism economy and livelihood as compared to previous years, and this number can be
generation by Satpura Tiger Reserve to local communities. further increased by doing capacity building of these tour-
However, a study in five protected areas of nearby Maha- ism zones via indulging tourists in non-financial activities
rashtra state of India is available, where annual agricultural like bird-survey and introducing facilities like home stays.
income of around 815 households in non-tourism villages These initiatives would not only raise the economic value
situated away from the five PAs was estimated during the of the area but shall also help in increasing livelihood for
study period. When the annual tourism income of tour- local communities.
ism villages was compared with the annual agricultural However, in this era of sustainable development, the
income, it was found that with half of the effort, and in focus should not only be in reaping the maximum benefits
lesser time, villagers earn a fairly good amount of income out of these wilderness areas, but also on preserving
from tourism activities, while also earning from agriculture the areas to the best extent possible. This can be done
(Roy et al., 2018). Therefore, according to authors, local by improving waste management plans and following
livelihood or employment opportunities (a kind of annu- the principle of 3R’s (Reduce, Reuse, Recycle) in every
al flow benefit) from these PAs were quite substantial in possible way. All these add-ons will enhance the beauty
magnitude in addition to other intangible flow benefits like of these areas resulting in increasing footfall of tourists in
carbon sequestration, pollination etc. the region.
According to a study done in Ranthambhore Tiger
Reserve in year 2018, more than 50% of revenue generated
from tourism establishments is going to local communities Acknowledgements
(Chundawat et al., 2018). This finding is in contrast to our
study which states that more than 50% of revenue generated We express our sincere thanks and gratitude to Dr.
from tourism in STR is retained by hotels, resorts, and U Prakasham, Chief Wildlife Warden (CWLW), Prin-Protected areas, tourism economy and employment generation: A case study from India 33
cipal Chief Conservator of Forests (Wildlife) & Secre- Jhala Y., Qureshi Q. & Gopal R., 2015, The status of tigers
WDU\037)6
0U5DMQLVK.6LQJK'HSXW\&RQVHUYDWRU in India 2014. National Tiger Conservation Authority,
of Forests, MPTFS for providing an opportunity to conduct New Delhi and Wildlife Institute of India, Dehradun.
WKLV VWXG\ :H ZRXOG DOVR OLNH WR WKDQN 0U 6. 6LQJK .DUDQWK.. 'HIULHV51DWXUHEDVHGWRXULVPLQ
Field Director (FD), Satpura Tiger Reserve and MP Forest Indian protected areas: New challenges for park man-
Department, and staff of Satpura Tiger Reserve for logistic agement. Centre for Wildlife Studies 4(2): 137-149.
support extended to us during the field study. 1DXJKWRQ7UHYHV/+ROODQG0% %UDQGRQ.
The role of protected areas in conserving biodiversity
and sustaining local livelihoods. Annual Review of En-
References vironment and Resources 30: 219-252.
Rodgers W., Hartley D. & Bashir S., 2003, Community
Chape S., Harrison J., Spalding M. & Lysenko I., 2005, Approaches to Conservation: Some Comparisons from
Measuring the extent and effectiveness of protected $IULFD DQG ,QGLD >LQ
@ 9 6DEHUZDO 0 5DQJDUDMDQ
areas as an indicator for meeting global biodiversity (eds.) Battle Over Nature: Science and the Politics
targets. Philosphical transactions of Royal Society B: of Conservation, Permanent Black, Delhi: 324-382.
Biological Sciences 360(1454): 443-455. 5R\ $ 9LFN\ &KDXGKDU\ 3 QG 3URWHFWHG $UHDV
&KXQGDZDW'55DMX98 5DMRUD+7KHYDOXH of Central India and livelihood issues of nearby com-
of Wildlife Tourism around Ranthambhore Tiger Re- munity. Field Forester 5(2): 237-242.
serve in Rajasthan for Wildlife Conservation and Local Satpura Tiger Reserve. (http://www.satpuratigerreserve.
Communities. TOFTigers, New Delhi, India. mp.gov.in/).
Filion F.L., Foley J.P. & Jacquemot A.J., 1994, The eco- 6SLWHUL$ 1HSDO6.(YDOXDWLQJ/RFDO%HQHILWV
nomics of global tourism, [in:] M. Munasinghe, J. Mc- from Conservation in Nepal’s Annapurna Conservation
Neely (eds), Protected Area Economics and Policy: Area. Environmental Management 42(3): 231-401.
Linking Conservation and Sustainable Development. State of Forest Report, 2017, Forest Survey of India (FSI).
World Bank, Washington, D.C., USA: 235-252. Ministry of Environment, Forests and Climate Change,
Fortin M.-J. & Gagnon C., 1999, An assessment of social Dehradun, India.
impacts of national parks on communities in Quebec. :DOSROH0-*RRGZLQ+- :DUG.*3ULFLQJ
Environmental Conservation 26(3): 200-211. Policy for Tourism in Protected Areas: Lessons from
Goodwin H., 2010, Local Community Involvement in .RPRGR1DWLRQDO3DUN&RQVHUYDWLRQ%LRORJ\
Tourism around National Parks: Opportunities and 227.
Constraints. Current issues in Tourism 5(3): 338-360.You can also read