Protective Behaviors and Secondary Harms Resulting From Nonpharmaceutical Interventions During the COVID-19 Epidemic in South Africa: Multisite ...
←
→
Page content transcription
If your browser does not render page correctly, please read the page content below

JMIR PUBLIC HEALTH AND SURVEILLANCE                                                                                                            Harling et al

     Original Paper

     Protective Behaviors and Secondary Harms Resulting From
     Nonpharmaceutical Interventions During the COVID-19 Epidemic
     in South Africa: Multisite, Prospective Longitudinal Study

     Guy Harling1,2,3,4,5,6, ScD; Francesc Xavier Gómez-Olivé3,7, MBMCh, PhD; Joseph Tlouyamma8,9, MSc; Tinofa
     Mutevedzi10, MSc; Chodziwadziwa Whiteson Kabudula3, PhD; Ruth Mahlako8, BSc (Hons); Urisha Singh1, PhD;
     Daniel Ohene-Kwofie3, MSc; Rose Buckland2, MSc; Pedzisai Ndagurwa3, PhD; Dickman Gareta1, MSc; Resign
     Gunda1,6, PhD; Thobeka Mngomezulu1, DipM; Siyabonga Nxumalo1, BSc; Emily B Wong1,11, MD; Kathleen Kahn3,7,
     MBBCh, PhD; Mark J Siedner1,12, MD; Eric Maimela8,13, PhD; Stephen Tollman3,7, MBBCh, PhD; Mark Collinson3,10,
     PhD; Kobus Herbst1,10, MBBCh, MSc
     1
      Africa Health Research Institute, KwaZulu-Natal, South Africa
     2
      Institute for Global Health, University College London, London, United Kingdom
     3
      Medical Research Council/Wits Rural Public Health and Health Transitions Research Unit (Agincourt), School of Public Health, Faculty of Health
     Sciences, University of the Witwatersrand, Johannesburg, South Africa
     4
      Department of Epidemiology, Harvard T.H. Chan School of Public Health, Harvard University, Boston, MA, United States
     5
      Center for Population and Development Studies, Harvard T.H. Chan School of Public Health, Harvard University, Boston, MA, United States
     6
      School of Nursing and Public Health, University of KwaZulu-Natal, Durban, South Africa
     7
      International Network for the Demographic Evaluation of Populations and Their Health Network, Accra, Ghana
     8
     Dikgale-Mamabolo-Mothiba Population Health Research Centre, School of Health Care Sciences, Faculty of Health Sciences, University of Limpopo,
     Mankweng, South Africa
     9
     Department of Computer Science, School of Mathematical and Computer Sciences, Faculty of Science and Agriculture, University of Limpopo,
     Mankweng, South Africa
     10
      Department of Science and Innovation-Medical Research Council South African Population Research Infrastructure Network, Johannesburg, South
     Africa
     11
          Division of Infectious Diseases, University of Alabama, Birmingham, Birmingham, AL, United States
     12
          Harvard Medical School and the Medical Practice Evaluation Center, Massachusetts General Hospital, Boston, MA, United States
     13
          Department of Public Health, School of Health Care Sciences, Faculty of Health Sciences, University of Limpopo, Mankweng, South Africa

     Corresponding Author:
     Guy Harling, ScD
     Africa Health Research Institute
     P.O. Box 198, Mtubatuba 3935
     KwaZulu-Natal
     South Africa
     Phone: 27 0355507500
     Email: guy.harling@ahri.org

     Abstract
     Background: In March 2020, South Africa implemented strict nonpharmaceutical interventions (NPIs) to contain the spread
     of COVID-19. Over the subsequent 5 months, NPI policies were eased in stages according to a national strategy. COVID-19
     spread throughout the country heterogeneously; the disease reached rural areas by July and case numbers peaked from July to
     August. A second COVID-19 wave began in late 2020. Data on the impact of NPI policies on social and economic well-being
     and access to health care are limited.
     Objective: We aimed to determine how rural residents in three South African provinces changed their behaviors during the first
     COVID-19 epidemic wave.
     Methods: The South African Population Research Infrastructure Network nodes in the Mpumalanga (Agincourt), KwaZulu-Natal,
     (Africa Health Research Institute) and Limpopo (Dikgale-Mamabolo-Mothiba) provinces conducted up to 14 rounds of longitudinal

     https://publichealth.jmir.org/2021/5/e26073                                                     JMIR Public Health Surveill 2021 | vol. 7 | iss. 5 | e26073 | p. 1
                                                                                                                          (page number not for citation purposes)
XSL• FO
RenderX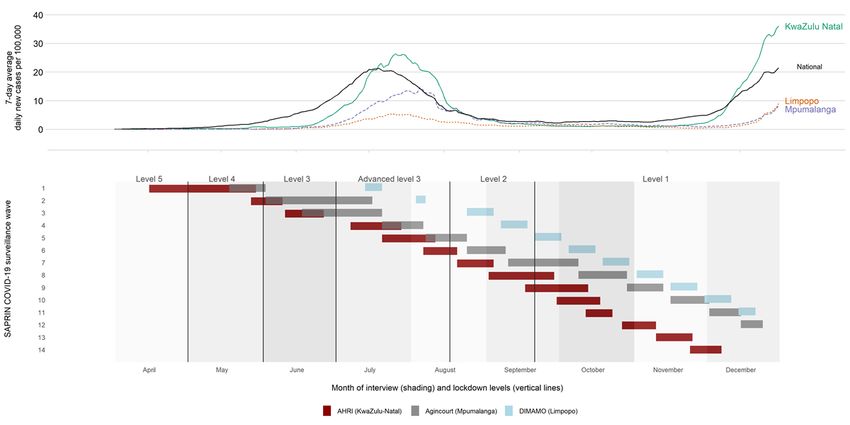
JMIR PUBLIC HEALTH AND SURVEILLANCE                                                                                                   Harling et al

     telephone surveys among randomly sampled households from rural and periurban surveillance populations every 2-3 weeks.
     Interviews included questions on the following topics: COVID-19–related knowledge and behaviors, the health and economic
     impacts of NPIs, and mental health. We analyzed how responses varied based on NPI stringency and household sociodemographics.
     Results: In total, 5120 households completed 23,095 interviews between April and December 2020. Respondents’ self-reported
     satisfaction with their COVID-19–related knowledge and face mask use rapidly rose to 85% and 95%, respectively, by August.
     As selected NPIs were eased, the amount of travel increased, economic losses were reduced, and the prevalence of anxiety and
     depression symptoms fell. When the number of COVID-19 cases spiked at one node in July, the amount of travel dropped rapidly
     and the rate of missed daily medications doubled. Households where more adults received government-funded old-age pensions
     reported concerns about economic matters and medication access less often.
     Conclusions: South Africans complied with stringent, COVID-19–related NPIs despite the threat of substantial social, economic,
     and health repercussions. Government-supported social welfare programs appeared to buffer interruptions in income and health
     care access during local outbreaks. Epidemic control policies must be balanced against the broader well-being of people in
     resource-limited settings and designed with parallel support systems when such policies threaten peoples’ income and access to
     basic services.

     (JMIR Public Health Surveill 2021;7(5):e26073) doi: 10.2196/26073

     KEYWORDS
     behaviour change; COVID-19; economic well-being; health care access; health knowledge; mental health; South Africa;
     surveillance; nonpharmaceutical interventions

                                                                          Although the cumulative number of COVID-19 cases slowly
     Introduction                                                         grew during April 2020, the disease incidence curve rapidly
     Since the emergence of COVID-19 in humans in late 2019, the          rose from May onward, peaking between June and August. By
     epidemic has spread to every country in the world, resulting in      September 1, 2020, South Africa had reported over 625,000
     direct mortality and morbidity [1] and indirect impacts on           confirmed COVID-19 cases and over 14,000 deaths [10]; the
     physical and mental health and economic well-being [2-4].            COVID-19 epidemic in South Africa was among the 10 largest
     Shortly after COVID-19 was declared a Public Health                  epidemics reported worldwide by that date [11]. The true impact
     Emergency of International Concern on January 30, 2020, South        of the epidemic appears to be even greater, with an excess of
     Africa was identified as a highly vulnerable country due to (1)      42,396 deaths reported in South Africa between January and
     its extensive internal and international transportation links [5];   August 2020 compared to those reported in the same period in
     (2) its burden of infectious and noncommunicable health              2018 and 2019 [12].
     conditions [6,7]; and (3) its large, socioeconomically vulnerable    The relaxation of lockdown regulations, which occurred even
     population [8]. The national government rapidly announced            as the epidemic grew, reflected competing health and economic
     strict, nationwide nonpharmaceutical interventions (NPIs; Level      vulnerabilities and priorities as well as sustained popular
     5 lockdown) on March 26, 2020. Under these NPIs, leaving             pressures [13-15]. There was widespread concern that the
     home was only allowed for grocery shopping, obtaining                lockdown was substantially affecting the national economy;
     medicine and medical care, or conducting permitted essential         individual household livelihoods; and access to education, health
     work. Furthermore, tobacco and alcohol sales were banned, and        care, and medication [8,16]. Additionally, some expected the
     from May 1 onward, face mask use was mandatory in public             lockdown to be futile, since much of the population could neither
     spaces. These regulations were accompanied with guidance on          maintain physical distancing nor implement NPIs due to
     enhanced handwashing, sanitizer use, and surface cleaning.           household and community overcrowding and limited access to
     The lockdown was intended to (1) reduce COVID-19                     running water and sanitation [17].
     transmission through strictly restricting physical interactions;     Robust data are essential for evaluating the hypotheses that
     (2) prevent rapid epidemic growth and allow health care              lockdowns cause substantial harm or are futile and for targeting
     providers to prepare for a subsequent rise in the demand for         locations that are the most in need of resources. The impact of
     care; (3) promote widespread educational campaigns to reduce         NPIs has been evaluated in various low- and middle-income
     COVID-19 transmission; and (4) initiate an ambitious,                countries, generating evidence of early reductions in income
     country-wide, community-based COVID-19 screening and                 and food security and the rapid, substantial uptake of protective
     testing program [9]. Between May and September 2020, the             behaviors [18-22].
     lockdown was gradually eased, allowing people to return work
     and school and engage in limited public gatherings. For example,     Although South Africa has effective national health care
     under Level 4 lockdown, restrictions were eased to allow the         surveillance systems, there is limited capacity for monitoring
     restarting of work in high-value sectors, meal deliveries, and       the social and behavioral effects of NPIs on the COVID-19
     nongroup daytime exercise. Under Level 3 lockdown, limited           epidemic at a local level. NPIs, such as those implemented in
     religious gatherings, professional noncontact sports, and            South Africa, might be expected to generate differing risks and
     sit-down meals were allowed.                                         benefits across socioeconomic settings. For example, there was
                                                                          unease in rural areas regarding water access for hand hygiene

     https://publichealth.jmir.org/2021/5/e26073                                            JMIR Public Health Surveill 2021 | vol. 7 | iss. 5 | e26073 | p. 2
                                                                                                                 (page number not for citation purposes)
XSL• FO
RenderX
JMIR PUBLIC HEALTH AND SURVEILLANCE Harling et al
and imilindo (funeral night vigils held in crowded rooms) [23], three Health and Demographic Surveillance System (HDSS)
while people from urban areas worried about dwelling proximity nodes for population and health surveillance: (1) the Medical
and shared ablutions [24]. The number of robust comparisons Research Council (MRC)/Wits Rural Public Health and Health
between urban and rural settings has been limited, but such Transitions Research Unit (Agincourt) in Ehlanzeni district,
comparisons are vital if public sector responses are to be Mpumalanga [34]; (2) the Dikgale-Mamabolo-Mothiba
effectively aligned with prevailing conditions. (DIMAMO) Population Health Research Centre in Capricorn
district, Limpopo [35]; and (3) the Africa Health Research
To date, most evaluations of the impact of COVID-19 in South
Institute (AHRI) in uMkhanyakude district, KwaZulu-Natal
Africa have been limited to web-based or urban settings [25-27].
[36]. Other urban nodes are under development. The nodes,
Studies on the initial weeks of lockdown reported that although
which each contain over 100,000 individuals residing in
people had substantial concerns about the disease and its
approximately 20,000 households, vary in settlement structure
economic impact, they also had a strong willingness to abide
and density. The three districts are rural or periurban areas that
by travel restrictions and other measures [26,27]. To date, the
are located on the east side of South Africa (Figure S1 in
most comprehensive longitudinal study of the impact of the
Multimedia Appendix 1) and have low average income levels
COVID-19 epidemic in South Africa on behavior is the National
relative to the rest of the country. Nodes conduct multiple
Income Dynamics Study (NIDS)-Coronavirus Rapid Mobile
in-person and telephonic surveys per year to update health and
Survey (CRAM). The NIDS is an ongoing panel survey that
sociodemographic data. However, DIMAMO had only partially
began in 2008 and follows a nationally representative sample
captured socioeconomic data for the first time before the
of households and their members [28]. The NIDS-CRAM
COVID-19 epidemic began in South Africa.
recontacted NIDS respondents from the most recent interview
wave in 2017 [29]. In 2020, 3 rounds of telephonic data Study Design and Implementation
collection were completed (first round: May and June; second In March 2020, SAPRIN initiated plans for each HDSS node
round: July and August; third round: November and December), to implement a high-intensity, longitudinal telephonic survey
and data on a wide range of social and economic impacts of the that covered at least 750 randomly selected households in each
epidemic were captured [25,30,31]. Employment dropped province, by using telephone numbers extracted from each
sharply after lockdown was imposed, but by October 2020 the node’s most recent census. This sample was selected to obtain
overall employment rate appeared to have recovered, although estimates of survey- and wave-specific proportions with a
not for women or respondents with low levels of education. The precision of no less than 4 percentage points, under the
provision of increased government support, including top-ups assumption of an 80% response rate based on past SAPRIN
for existing unconditional grants (which ended after October) surveys. Every 2-3 weeks, a central call center at each node
and the new, temporary Social Relief of Distress grant for contacted households and asked a primary respondent to answer
working-aged adults with no other sources of support appeared questions on behalf of the household. Primary respondents had
to aid households, particularly those in rural areas [32]. to be resident adult members of the household (aged ≥18 years).
However, the withdrawal of these grants has caused concern. To combat survey fatigue, from mid-September onward or after
Mental health concerns remained substantial throughout the the seventh survey wave (whichever was earlier), one-third of
year and were positively associated with household child hunger the cohort was rotated out at each subsequent wave, and a new
[33]. random sample that included the same number of households
The NIDS-CRAM has substantial strengths in terms of its was rotated in for 4-6 survey waves. Details for each node are
national reach and wide-ranging topic coverage. However, it shown in Figure S2 in Multimedia Appendix 1.
only provides sporadic snapshots of the epidemic. We therefore The questionnaire included both household-level and
used an existing research infrastructure in three South African individual-specific questions; the latter could be directly
provinces to evaluate how health, social, and economic answered by other household members if they were present.
behaviors continuously changed between April and December Otherwise, the primary respondent served as a proxy. The
2020. We used a high-frequency survey of a panel of households questionnaire included COVID-19 symptom screening;
for which substantial, pre-epidemic data were already available. individuals who met the Department of Health’s COVID-19
Our first hypothesis was that behaviors would change as symptom criteria were referred for further investigation, possible
regulations and the national epidemic changed. Our second testing, and care. Data were captured on laptop computers by
hypothesis was that these changes would vary based on call center interviewers who used electronic data capture
socioeconomic characteristics (those that reflected households’ software, including automated skip patterns and validation
ability to maintain their compliance with NPI and social checks. Telephone calls continued from April to December 2020
distancing policies) and households’ needs and resources. with continuous quality monitoring. The survey implementation
process at one node (AHRI) is described in detail elsewhere
Methods [37]. The study questionnaire is provided in Multimedia
Appendix 1.
Study Site
The South African Population Research Infrastructure Network Outcomes
(SAPRIN)—an initiative that is hosted by the South African Our outcomes for this study were based on answers to questions
Medical Research Council and receives long-term from the related to COVID-19 and NPIs in three key domains: (1)
National Department of Science and Innovation—integrates COVID-19–related knowledge and behavior; (2) the health and
https://publichealth.jmir.org/2021/5/e26073 JMIR Public Health Surveill 2021 | vol. 7 | iss. 5 | e26073 | p. 3
(page number not for citation purposes)
XSL• FO
RenderXJMIR PUBLIC HEALTH AND SURVEILLANCE Harling et al
economic impacts of NPIs; and (3) mental health. For behavior, Ethical Considerations
the primary respondent was asked to rate their perceived All households previously provided consent to be contacted by
knowledge about COVID-19 on a 5-point scale; we classified phone and each primary respondent provided recorded, verbal
respondents as (1) those who self-reported that they did not consent. Households were not directly compensated for study
have enough knowledge or (2) those who reported that they had participation; however, one node annually provided a shopping
enough or more than enough knowledge. Respondents were voucher (value of around US $3) to each participating household
then asked about household behavior changes that they made to thank them for their participation in all SAPRIN-related
in response to the COVID-19 epidemic. They were asked activities. Responses to questions were electronically captured
whether any resident household member had left the house in in secure, on-premise databases with role-based security.
the past 7 days and whether any nonhousehold members had Personally identifiable data were sequestered in separate
visited the house during the preceding day; we classified database tables with restricted access, and all analytic data sets
respondents as either (1) those who reported any number of were pseudonymized prior to analysis. All study procedures
household or nonhousehold members or (2) those who reported were approved by Limpopo, Mpumalanga, and KwaZulu-Natal’s
“none” for each question. Respondents were also asked if provincial Department of Health Research Ethics Committees
household members had, over the past 7 days, avoided crowded (RECs), the University of KwaZulu-Natal’s Biomedical REC,
areas or social events, travelled (using local minibus taxis or the University of the Witwatersrand’s Human REC (Medical),
long-distance travel methods), or used face masks when going and the University of Limpopo’s Turfloop REC.
out.
Patient and Public Involvement
For health and economic impacts, primary respondents were
asked about household members’ ability to (1) access all needed The adaptation of the existing SAPRIN surveillance program
daily medications, (2) access needed health care, and (3) earn was discussed with and approved by each nodes’ existing
money. Finally, for mental health, we asked primary respondents community advisory groups prior to the finalization of the study
to answer the Generalized Anxiety Disorder 2-item (GAD-2) protocol. The results of the studies were routinely shared with
and Patient Health Questionnaire 2-item (PHQ-2) scales. GAD-2 the community through a range of engagement activities that
and PHQ-2 scores of ≥3 were considered positive, as per the were conducted by the teams at each node.
standard, South African–validated cutoffs [38]. The Cronbach Data Availability
α values in this study were .85 for the PHQ-2 and .91 for the
The data collected in the SAPRIN COVID-19 surveillance
GAD-2.
survey, including those reported in this paper, will be made
Statistical Analysis available in pseudonymized form through the SAPRIN data
We linked data from the high-intensity SAPRIN survey to the repository [40].
following routine individual and household sociodemographic
data, which were collected from households in 2019: the number Results
of children, working-aged adults, and pension-aged adults; the
maximum education level attained; node-specific asset index Study Implementation
quintiles; levels of employment; and the receipt of unconditional Between April 15 and December 24, 2020, AHRI (in
social grants. South African noncontributory pensions are KwaZulu-Natal) completed 14 waves of data collection,
available to all citizens, permanent residents, or documented Agincourt (in Mpumalanga) completed 12 waves of data
refugees aged >60 years, although pension applications require collection, and DIMAMO (in Limpopo) completed 11 waves
proof of status. of data collection (Figure 1). These waves covered the entire
period of the first COVID-19 epidemic wave in South Africa,
In this study, we included anyone who was interviewed in 2020. including outbreaks of varying sizes that occurred in the three
First, we described survey response rates at each node and time provinces under observation, and part of the early phase of the
period as well as key, pre–COVID-19 epidemic household second national wave. The average response rate was 71%
characteristics. Second, we described changes in each of the 11 (23,095/31,643), and response rates varied from 56.9%
measures across the three domains (behavior, health and (427/750) to 90.3% (1013/1122) depending on wave and node.
economic impact, and mental health) based on node and month Direct refusal was rare (1242/31,643, 3.8%), while unanswered
of data collection. Third, we used multivariable regression calls were more common (4304/31,643, 13.2%). Phone numbers
models to assess independent predictors of our outcomes of were quite often out of service or claimed to be wrong numbers
interest via complete case analysis. For each outcome, we fitted (3002/31,643, 9.2%; Table S1 in Multimedia Appendix 1).
a Poisson model with household-level random effects and robust Nonresponding households had lower levels of maximum
SEs to calculate prevalence ratios. All models included variables education and fewer employed members, but responding and
for node, interview round number, month of the interview, and nonresponding households did not differ greatly based on
household characteristics. Data analysis was conducted with household wealth or grant receipt (based on 2019 data; Table
Stata version 15.1 (StataCorp LLC) and R version 4.0.2 (The S2 in Multimedia Appendix 1). In total, 23,095 household
R Foundation) [39]. Results were considered statistically interviews were completed with 5120 unique households in
significant at the .05 level. 2020.
https://publichealth.jmir.org/2021/5/e26073 JMIR Public Health Surveill 2021 | vol. 7 | iss. 5 | e26073 | p. 4
(page number not for citation purposes)
XSL• FO
RenderXJMIR PUBLIC HEALTH AND SURVEILLANCE Harling et al
Figure 1. Epidemic curve and interview rounds across SAPRIN nodes in 2020. AHRI: Africa Health Research Institute; DIMAMO:
Dikgale-Mamabolo-Mothiba; SAPRIN: South African Population Research Infrastructure Network.
qualification. Wealthier households were more likely to have
Descriptive Results a valid telephone number; at the AHRI and Agincourt nodes
Descriptive statistics for all respondent households with valid they were also more likley to participate in study surveys.
telephone numbers and members who consented to and Households were large (median of 5 resident and nonresident
completed an interview are shown in Table 1. In one-sixth members, of whom 2 were agedJMIR PUBLIC HEALTH AND SURVEILLANCE Harling et al
Table 1. Descriptive statistics for participating households at South African Population Research Infrastructure Network nodes from April to December
2020.
Characteristics Totala Nodeb
AHRIc Agincourt DIMAMOd P valuee
Number of households 5120 1608 1797 1715 N/Af
Highest education attained, %gJMIR PUBLIC HEALTH AND SURVEILLANCE Harling et al
Figure 2. Knowledge about, behavior relating to, and impact of COVID-19 and related regulations at South African Population Research Infrastructure
Network nodes from April to December 2020. Graphs A, D, E, F, J, and K reflect individual-level responses of the primary household respondents.
Graphs B, C, G, H, and I reflect household-level responses reported by the primary household respondents. Values are proportions of household primary
respondents and 95% CIs. Precise values are provided in Table S3 in Multimedia Appendix 1. AHRI: Africa Health Research Institute; DIMAMO:
Dikgale-Mamabolo-Mothiba; GAD-2: Generalized Anxiety Disorder 2-item; PHQ-2: Patient Health Questionnaire 2-item.
Respondents’ reported inability to access health care remained time at AHRI and DIMAMO and stayed low at Agincourt
low and relatively stable over time. However, households throughout the period studied.
reported that members missed daily medications in the past
week at 52.9% (12,155/22,974) of interviews. Although rates
Multivariable Results
of missed daily medications were stable over time at Agincourt After accounting for study node and month of interview, and
and DIMAMO, they almost doubled at AHRI from 37.4% despite variation in household composition, no household
(315/843) in June to 64.9% (634/979) in July, as the epidemic characteristics were substantively associated with (1)
arrived in the local area. The proportion of households that respondents self-reporting satisfaction with their
reported that members lost earnings due to COVID-19 COVID-19–related knowledge; (2) residents leaving their homes
regulations dropped substantially as the lockdown was reduced in the week before the interview; or (3) residents avoiding travel
from Level 5 to Level 4. This proportion dropped again when or face mask use (Tables 2 and 3). Households with individuals
the lockdown was lowered to Level 3 and remained steadily who had attained more education were more likely to report
low thereafter. Finally, the proportion of individuals who that they had had visitors on the day before the interview and
screened positive for possible anxiety and depression fell over less likely to report that they had avoided crowded spaces. These
associations may reflect that more educated individuals are
likelier to live in more urban locations.
https://publichealth.jmir.org/2021/5/e26073 JMIR Public Health Surveill 2021 | vol. 7 | iss. 5 | e26073 | p. 7
(page number not for citation purposes)
XSL• FO
RenderXJMIR PUBLIC HEALTH AND SURVEILLANCE Harling et al
Table 2. COVID-19–related knowledge and home behaviors in South Africa from April to August 2020a.
Variable Individual has enough knowl- Household had any visitors Any member left home (n=17,164),
edge (n=17,292), prevalence (n=17,282), prevalence ratio prevalence ratio (95% CI)
ratio (95% CI) (95% CI)
Node
AHRIb (KwaZulu-Natal) 1.00 (N/Ac) 1.00 (N/A) 1.00 (N/A)
Agincourt (Mpumalanga) 1.09 (1.07-1.11) 2.07 (1.76-2.43) 2.26 (2.18-2.35)
DIMAMOd (Limpopo) 0.91 (0.88-0.95) 1.42 (1.07-1.88) 2.58 (2.46-2.72)
Month of interview
April 0.93 (0.77-1.13) 1.08 (0.57-2.04) 0.76 (0.57-1.02)
May 1.00 (N/A) 1.00 (N/A) 1.00 (N/A)
June 1.32 (1.25-1.39) 0.72 (0.59-0.88) 1.29 (1.24-1.35)
July 1.45 (1.38-1.52) 0.71 (0.60-0.84) 0.98 (0.94-1.03)
August 1.64 (1.56-1.71) 0.64 (0.53 0.77) 0.91 (0.87-0.96)
September 1.69 (1.62-1.77) 0.69 (0.57-0.83) 1.00 (0.95-1.04)
October 1.71 (1.63-1.79) 0.79 (0.65-0.96) 1.05 (1.00-1.10)
November 1.72 (1.64-1.80) 0.87 (0.72-1.05) 1.03 (0.98-1.08)
December 1.80 (1.71-1.88) 0.48 (0.37-0.62) 0.98 (0.93-1.03)
Household members (per person)
Children 1.00 (1.00-1.01) 0.96 (0.91-1.01) 1.02 (1.02-1.03)
Working-aged adults 1.00 (1.00-1.00) 0.99 (0.96-1.03) 1.02 (1.01-1.02)
Pension-aged adults 0.98 (0.96-1.00) 1.09 (0.95-1.26) 1.01 (0.98-1.04)
Maximum education of household members
Less than complete secondary education 1.00 (N/A) 1.00 (N/A) 1.00 (N/A)
Complete secondary education 1.02 (1.00-1.04) 0.92 (0.78-1.08) 1.00 (0.97-1.03)
Diploma/certificate/degree 1.02 (0.98-1.06) 1.06 (0.80-1.39) 1.01 (0.96-1.07)
Household income sources in 2019
Full-time and part-time employees 1.01 (1.00-1.01) 1.06 (1.01-1.11) 1.01 (1.00-1.02)
Pension grants 0.99 (0.97-1.01) 0.96 (0.83 - 1.11) 0.97 (0.94 - 1.00)
Nonpension grants 1.00 (1.00-1.01) 0.99 (0.94-1.04) 0.99 (0.99-1.00)
Household asset index quintiles 1.00 (0.99-1.01) 0.99 (0.94-1.03) 1.00 (1.00-1.01)
a
Each column (knowledge, the number of visitors, and members leaving home) is a single Poisson regression with household-level random effects and
robust SEs for calculating prevalence ratios and 95% CIs. In total, 17,384 observations have complete covariate data and 5704 observations from 1475
households have missing covariate values; 33 households surveyed by AHRI, 103 surveyed by Agincourt, and 1339 surveyed by DIMAMO are missing
data. The remaining missing observations reflect missing outcome values.
b
AHRI: Africa Health Research Institute.
c
N/A: not applicable.
d
DIMAMO: Dikgale-Mamabolo-Mothiba
https://publichealth.jmir.org/2021/5/e26073 JMIR Public Health Surveill 2021 | vol. 7 | iss. 5 | e26073 | p. 8
(page number not for citation purposes)
XSL• FO
RenderXJMIR PUBLIC HEALTH AND SURVEILLANCE Harling et al
Table 3. Beyond-home behavior regarding COVID-19 at South African Population Research Infrastructure Network nodes from April to August 2020a.
Variable Individual avoided crowds Individual avoided transport Individual used face mask
(n=17,043), prevalence ratio (n=17,043), prevalence ratio (n=17,043), prevalence ratio
(95% CI) (95% CI) (95% CI)
Node
AHRIb (KwaZulu-Natal) 1.00 (N/Ac) 1.00 (N/A) 1.00 (N/A)
Agincourt (Mpumalanga) 0.77 (0.75-0.79) 1.05 (1.01-1.10) 0.98 (0.97-0.99)
DIMAMOd (Limpopo) 1.24 (1.19-1.29) 1.87 (1.76-1.98) 1.00 (0.98-1.01)
Month of interview
April 1.51(1.39-1.63) 1.40 (1.12-1.75) 0.28 (0.20-0.40)
May 1.00 (N/A) 1.00 (N/A) 1.00 (N/A)
June 1.36 (1.29-1.43) 1.54 (1.41-1.68) 1.30 (1.26-1.34)
July 1.15 (1.09-1.22) 1.37 (1.26-1.49) 1.28 (1.24-1.32)
August 1.30 (1.23-1.38) 1.31 (1.20-1.43) 1.32 (1.28-1.36)
September 1.35 (1.28-1.42) 1.48 (1.36-1.60) 1.33 (1.30-1.37)
October 1.18 (1.12-1.25) 1.40 (1.29-1.52) 1.34 (1.31-1.38)
November 1.13 (1.07-1.19) 1.48 (1.36-1.61) 1.34 (1.30-1.38)
December 1.08 (1.01-1.15) 1.30 (1.19-1.43) 1.34 (1.30-1.39)
Household members (per person)
Children 1.00 (1.00-1.01) 1.01 (1.00-1.02) 1.00 (1.00-1.00)
Working-aged adults 1.02 (1.01-1.02) 1.02 (1.01-1.03) 1.00 (1.00-1.00)
Pension-aged adults 1.02 (1.00-1.05) 1.00 (0.96-1.04) 1.00 (0.99-1.01)
Maximum education of household members
Less than complete secondary education 1.00 (N/A) 1.00 (N/A) 1.00 (N/A)
Complete secondary education 1.00 (0.97-1.03) 1.02 (0.98-1.07) 1.00 (0.99-1.01)
Diploma/certificate/degree 0.96 (0.92-1.00) 1.00 (0.94-1.07) 1.00 (0.98-1.01)
Household income sources in 2019
Full-time and part-time employees 0.99 (0.98-1.00) 0.99 (0.98-1.00) 1.00 (1.00-1.00)
Pension grants 1.00 (0.97-1.02) 1.00 (0.97-1.05) 1.00 (0.99-1.01)
Nonpension grants 1.00 (0.99-1.00) 0.99 (0.98-1.00) 1.00 (1.00-1.00)
Household asset index quintiles 1.00 (0.99-1.01) 1.00 (0.99-1.01) 1.00 (1.00-1.00)
a
Each column (knowledge, the number of visitors, and members leaving home) is a single Poisson regression with household-level random effects and
robust SEs for calculating prevalence ratios and 95% CIs. In total, 17,384 observations have complete covariate data and 5704 observations from 1475
households have missing covariate values; 33 households surveyed by AHRI, 103 surveyed by Agincourt, and 1339 surveyed by DIMAMO are missing
data. The remaining missing observations reflect missing outcome values.
b
AHRI: Africa Health Research Institute.
c
N/A: not applicable.
d
DIMAMO: Dikgale-Mamabolo-Mothiba
Households with a higher number of older individuals and earnings. Finally, the prevalence of depression and anxiety
pension recipients were more likely to have a recent unmet symptoms was higher in households with a member that had a
health need (nonsignificantly for older members; P=.55) but postsecondary qualification, and the prevalence of depression
were less likely to have been unable to access medicine (Table symptoms was nonsignificantly (P=.18) greater in households
4). These same two factors predicted a lower prevalence of lost that received pension grants compared to those that did not
earnings, as did having a household member who had completed receive pension grants (either due to households having no
secondary education; having a household member who had eligible members or not having applied for such grants; Table
completed postsecondary education was not predictive of lost 5).
https://publichealth.jmir.org/2021/5/e26073 JMIR Public Health Surveill 2021 | vol. 7 | iss. 5 | e26073 | p. 9
(page number not for citation purposes)
XSL• FO
RenderXJMIR PUBLIC HEALTH AND SURVEILLANCE Harling et al
Table 4. Health care and economic behaviors at South African Population Research Infrastructure Network nodes from April to August 2020a.
Variable Any member missed daily Any member unable to access health Any member lost earnings
medication (n=17,277), preva- care (n=17,272), prevalence ratio (n=17,256), prevalence ratio
lence ratio (95% CI) (95% CI) (95% CI)
Node
AHRIb (KwaZulu-Natal) 1.00 (N/Ac) 1.00 (N/A) 1.00 (N/A)
Agincourt (Mpumalanga) 1.20 (1.14-1.27) 0.34 (0.29-0.40) 0.90 (0.80-1.01)
DIMAMOd (Limpopo) 1.60 (1.48-1.74) 1.66 (1.31-2.09) 0.27 (0.19-0.38)
Month of interview
April 1.08 (0.88-1.33) 0.64 (0.38-1.09) 1.56 (1.29-1.89)
May 1.00 (N/A) 1.00 (N/A) 1.00 (N/A)
June 1.06 (0.99-1.13) 0.51 (0.41-0.64) 0.58 (0.52-0.66)
July 1.22 (1.15-1.28) 0.52 (0.42-0.64) 0.57 (0.52-0.64)
August 1.10 (1.04-1.17) 0.35 (0.28-0.44) 0.57 (0.51-0.64)
September 0.81 (0.76-0.87) 0.33 (0.26-0.42) 0.42 (0.37-0.48)
October 0.93 (0.87-1.00) 0.17 (0.13-0.23) 0.27 (0.23-0.33)
November 0.98 (0.92-1.05) 0.48 (0.39-0.59) 0.27 (0.22-0.32)
December 1.02 (0.94-1.10) 0.48 (0.37-0.63) 0.37 (0.31-0.45)
Household members (per person)
Children 0.99 (0.98-1.01) 1.00 (0.96-1.04) 1.01 (0.97-1.04)
Working-aged adults 0.98 (0.96-0.99) 1.03 (0.99-1.07) 1.07 (1.04-1.10)
Pension-aged adults 0.81 (0.76-0.86) 1.04 (0.91-1.20) 0.82 (0.72-0.92)
Maximum education of household members
Less than complete secondary education 1.00 (N/A) 1.00 (N/A) 1.00 (N/A)
Complete secondary education 1.07 (1.00-1.14) 0.98 (0.82-1.16) 1.15 (1.00-1.32)
Diploma/certificate/degree 1.08 (0.99-1.18) 1.02 (0.82-1.28) 1.03 (0.83 - 1.28)
Household income sources in 2019
Full-time and part-time employees 1.02 (1.00-1.04) 1.01 (0.96-1.05) 1.04 (1.00-1.08)
Pension grants 0.92 (0.86-0.98) 1.21 (1.05-1.40) 0.92 (0.81-1.05)
Nonpension grants 1.01 (0.99-1.02) 0.98 (0.94-1.02) 1.04 (1.00-1.07)
Household asset index quintiles 1.01 (0.99-1.03) 1.00 (0.95-1.05) 0.99 (0.95-1.03)
a
Each column (knowledge, the number of visitors, and members leaving home) is a single Poisson regression with household-level random effects and
robust SEs for calculating prevalence ratios and 95% CIs. In total, 17,384 observations have complete covariate data and 5704 observations from 1475
households have missing covariate values; 33 households surveyed by AHRI, 103 surveyed by Agincourt, and 1339 surveyed by DIMAMO are missing
data. The remaining missing observations reflect missing outcome values.
b
AHRI: Africa Health Research Institute.
c
N/A: not applicable.
d
DIMAMO: Dikgale-Mamabolo-Mothiba
https://publichealth.jmir.org/2021/5/e26073 JMIR Public Health Surveill 2021 | vol. 7 | iss. 5 | e26073 | p. 10
(page number not for citation purposes)
XSL• FO
RenderXJMIR PUBLIC HEALTH AND SURVEILLANCE Harling et al
Table 5. Mental health impacts of COVID-19 and household characteristics at South African Population Research Infrastructure Network nodes from
April to August 2020a.
Variable Individual PHQ-2b screened positive (n=17,257), Individual GAD-2c screened positive (n=17,256),
prevalence ratio (95% CI) prevalence ratio (95% CI)
Node
AHRId (KwaZulu-Natal) 1.00 (N/Ae) 1.00 (N/A)
Agincourt (Mpumalanga) 0.35 (0.30-0.41) 0.46 (0.39-0.54)
f 1.16 (0.93-1.44) 2.83 (2.23-3.60)
DIMAMO (Limpopo)
Month of interview
April 1.34 (0.87-2.05) 2.15 (1.55-2.99)
May 1.00 (N/A) 1.00 (N/A)
June 0.37 (0.27-0.50) 0.72 (0.57-0.91)
July 0.93 (0.76-1.14) 0.61 (0.50-0.75)
August 0.59 (0.47-0.74) 0.41 (0.33-0.51)
September 0.56 (0.44-0.71) 0.25 (0.19-0.33)
October 0.34 (0.26-0.46) 0.06 (0.04-0.10)
November 0.60 (0.47-0.77) 0.32 (0.25-0.43)
December 0.88 (0.67-1.16) 0.63 (0.47-0.84)
Household members (per person)
Children 1.01 (0.97-1.05) 1.03 (0.98-1.07)
Working-aged adults 1.03 (0.99-1.07) 1.01 (0.97-1.05)
Pension-aged adults 0.88 (0.76-1.02) 0.91 (0.78-1.07)
Maximum education of household members
Less than complete secondary 1.00 (N/A) 1.00 (N/A)
Complete secondary 1.07 (0.91-1.27) 0.89 (0.75-1.07)
Diploma/certificate/degree 1.33 (1.08-1.65) 1.16 (0.92-1.46)
Household income sources in 2019
Full/part-time employees 0.97 (0.92-1.02) 0.98 (0.93-1.03)
Pension grants 1.11 (0.95-1.29) 0.99 (0.84-1.16)
Non-pension grants 0.98 (0.94-1.02) 0.99 (0.95-1.03)
Household asset index quintiles 1.01 (0.96-1.06) 1.06 (1.00-1.11)
a
Each column (knowledge, the number of visitors, and members leaving home) is on a single Poisson regression with household-level random effects
and robust SEs for calculating prevalence ratios and 95% CIs. In total, 17,384 observations have complete covariate data and 5704 observations from
1475 households have missing covariate values; 33 households surveyed by AHRI, 103 surveyed by Agincourt, and 1339 households surveyed by
DIMAMO are missing data. The remaining missing observations reflect missing outcome values.
b
PHQ-2: Patient Health Questionnaire 2-item.
c
GAD-2: Generalized Anxiety Disorder 2-item.
d
AHRI: Africa Health Research Institute.
e
N/A: not applicable.
f
DIMAMO: Dikgale-Mamabolo-Mothiba
of COVID-19. As both NPIs and the epidemic spread across
Discussion the country, our longitudinal surveillance program captured the
Principal Findings impact of both processes.
By conducting rapid, repeated telephonic interviews at sites in Our first key finding was that the South African national public
three provinces in South Africa, we observed how households health measures and messages implemented were effective in
in rural and periurban areas responded to and were affected by several ways. Respondents across three provinces showed
national NPIs that were enacted to minimize the epidemic spread consistent improvements over time in satisfaction with their
https://publichealth.jmir.org/2021/5/e26073 JMIR Public Health Surveill 2021 | vol. 7 | iss. 5 | e26073 | p. 11
(page number not for citation purposes)
XSL• FO
RenderXJMIR PUBLIC HEALTH AND SURVEILLANCE Harling et al
understanding of the epidemic. There was early concern that This higher prevalence perhaps reflected concerns of being at
South Africa’s public health messages were insufficiently greater risk of SARS-CoV-2 infection due to respondents’
contextualized to the country’s varying social and economic proximity to the nearby city of Polokwane. However, it was
conditions. Both politicians and scientists conducted televised encouraging that even when the COVID-19 epidemic arrived
national press conferences that were supported by provincial at AHRI in KwaZulu-Natal during July 2020, depression and
and local follow-up events. Although causality cannot be proven anxiety prevalence did not increase, though the uptick in these
between these events and changes in behavior, in line with other rates that occurred late in the year as the second wave arrived
evidence from South Africa and other countries [21,31], our at Agincourt in Mpumalanga may be concerning. Mental health
respondents reported that they rapidly and comprehensively concerns were much more prevalent at some sites than at others,
complied with public health messages, including those about particularly earlier in the year, but it is also notable that
face mask use, and actively avoided crowds and public transport. households with postsecondary-educated members were
Several of these protective behaviors remained prevalent even significantly more likely to report depression (prevalence ratio:
as formal, lockdown-related NPIs were relaxed and even after 1.33; 95% CI 1.08-1.65; P=.008) and nonsignificantly more
the first national epidemic wave had passed. This continued likely to report anxiety (prevalence ratio: 1.16; 95% CI
adherence to policies, which persisted even after they were no 0.92-1.46; P=.21). Comparisons are complex, but our findings
longer formally required, highlights the importance of align with national South African data, which suggest that
considering how infection-related fears and prosocial desires COVID-19–related mental health impacts were more limited
to protect others can drive epidemic dynamics [41-43]; formal in low-income and rural areas [31]. Longitudinal surveillance
lockdowns may be less vital than carefully crafted public health across a range of settings via harmonized measures will help
communication. determine the extent to which mental health is directly affected
by COVID-19–related fears and indirectly affected by secondary
Second, we identified substantial behavior changes as the
social and economic effects.
COVID-19 epidemic arrived in the local study areas. This was
particularly noticeable at the KwaZulu-Natal node, where rapid Fourth, our analysis raises concern about unmet needs for health
epidemic growth in the local district during early July coincided care. Households reported that members had recently missed
with a rapid decline in the proportion of household members daily medication doses at almost half of all interviews
leaving home and concomitant increases in levels of missed (10,819/22,974, 47.1%) and that a member had wanted but was
daily medications and the inability to access needed health care. unable to access health care in the 7 days before the interview
There were also smaller behavior changes that occurred after 6.7% (1538/22,967) of the time. These levels are similar to
mid-December at the Mpumalanga and Limpopo nodes (the those of other South African surveys [25]. Notably, the
KwaZulu-Natal node stopped data collection early in the month) epidemic’s arrival at AHRI had diverging effects; unmet health
as the second epidemic wave spread across the country. care needs did not change much, but missed medication rates
almost doubled. These patterns suggest that household members
These behavioral responses reflected local epidemic dynamics.
may be calculating the trade-offs between COVID-19 and
The first national epidemic started in the Western Cape and
non–COVID-19 risks and are potentially willing to risk physical
spread first to the adjacent Eastern Cape before spreading to
proximity to others to attend clinics [45] but not to collect
the densely populated Gauteng province and urban eThekwini
medicine [46]. However, unmet health care and medication
in KwaZulu-Natal and then finally reaching the rural eastern
needs at the other study sites were stable throughout the
and northern areas of South Africa, which were analyzed in this
observation period. Additional information is needed to
study. The second wave began in the Eastern Cape during
determine (1) whether unmet health care needs are indicative
November before spreading nationwide. The patterns of rapid
of operational, mobility, transport cost, and transport availability
behavior change in the face of a rising epidemic wave seen in
issues or other issues; and (2) the extent to which such needs
this study were congruent with those seen worldwide. However,
were the result of or were exacerbated by the COVID-19
there are limited data on behavior in low- and middle-income
epidemic or related regulations. Data that cover the pre-epidemic
countries either after first waves have receded or during
and postepidemic periods would help identify these effects, as
subsequent waves. The impact of regulations and epidemic
would qualitative investigations of household decision making
trajectories on travel is particularly pertinent in our study
during lockdowns.
settings, as medium- and long-distance circular labor migration
to urban areas is highly prevalent and vital to the economic Finally, we found that households with higher numbers of older
well-being of rural and periurban South African households members and pension recipients reported more unmet health
[44]. Bans on long-distance travel have potentially substantial care needs but fewer instances of missed daily medication or
economic implications for people who are not able to return to lost earnings. South African noncontributory pensions—broad
work, although such travel bans might also partially explain the national government support schemes that are often the largest
limited epidemics that were seen in these rural areas even as household income source in these relatively rural settings with
NPIs were relaxed. very high unemployment rates—have previously been linked
to positive physical and mental health outcomes [47,48]. Our
Third, our mental health findings are reassuring. At all three
study suggests that such government support structures likely
nodes, we observed declines over time in the prevalence of
play an essential role in maintaining household security in crisis
depression and anxiety symptoms (based on validated screening
contexts such as the COVID-19 epidemic by providing a
scales). The prevalence of such symptoms was notably higher
guaranteed income to vulnerable populations. The government’s
at the DIMAMO periurban node in Limpopo earlier in the year.
https://publichealth.jmir.org/2021/5/e26073 JMIR Public Health Surveill 2021 | vol. 7 | iss. 5 | e26073 | p. 12
(page number not for citation purposes)
XSL• FO
RenderXJMIR PUBLIC HEALTH AND SURVEILLANCE Harling et al
temporary supplementation of grant programs through top-up did not have data on identical questions from the pre-epidemic
payments and novel noncontributory unemployment support period; however, we were able to include similar information
early in the epidemic may have also helped [13]. However, it on many topics from earlier surveillance studies.
will be important to observe if the ending of income
This study also has several strengths, including a clearly defined
supplementation (grant top-ups ended in October 2020;
sampling base, high response rates, low attrition rates, frequent
unemployment payments have continued in 2021) reverses these
follow-up, and linkages to pre-epidemic household data.
supplements’ beneficial effects. The lack of substantive
Although we were not able to interview the same people in
associations between household characteristics and social
every survey wave, our longitudinal household cohort design,
distancing measures is also noteworthy. In some instances, such
which allowed for repeated interviews with the same households
as mask use, this likely reflects an overwhelming uptake of
over multiple months, reduced the risk of confounding by
protective behaviors, which made statistically significant
time-invariant household factors that could have arisen if we
associations impossible. In other instances, our results suggest
had used multiple cross-sectional surveys. Many of these
either that behavior was primarily driven by the epidemic
benefits arise from the nature of the existing SAPRIN
cycle—as measured by interview month—or that key drivers
surveillance infrastructure, which reinforces the importance of
of household behavior were not included in our analysis. Further
long-term, population-based surveillance systems that collect
investigations of this and other data sources may help determine
social, demographic, and health data. This study demonstrates
which (if any) characteristics predict changes in protective
that surveillance systems can be rapidly repurposed to respond
behaviors during the COVID-19 epidemic.
to emergency health needs, including (1) rapid pathogen data
This study presents an overview of key insights across time acquisition; (2) the identification of susceptible populations;
from multiple sites across South Africa. However, there are (3) the assessment of behavioral and biomedical interventions;
several additional analyses that could further contextualize our and (4) the development of mitigation strategies [49].
findings. First, data can be longitudinally analyzed at the
SAPRIN nodes have been working with their local communities
household or individual level to evaluate trajectories of behavior
for 20-28 years. Such long-term engagement promotes deep
and impact as the COVID-19 epidemic continues to affect rural
understanding and community buy-in, which in turn enables
and periurban environments. For example, it will be important
rapid implementation and sustained, high-intensity follow-ups
to evaluate the impact of new government policies, such as the
with minimal dropout. The network nature of SAPRIN also
ending of temporary increases in noncontributory grants.
allowed each node to flexibly implement an overarching
Second, these behavior-related data can be linked to COVID-19
protocol. Furthermore, the use of telephonic call centers at each
symptoms and individual and population health outcomes to
node allowed for rapid survey rollout that was based on
evaluate how risk perceptions and reactions are associated with
previously provided informed consent for personal calls and
health outcomes. Third, a more in-depth analysis of how
substantially reduced the risk of SARS-CoV-2 infection among
household members’ historical and current age, gender,
study staff and research participants. Since these call centers
employment status, and migration composition, as well as
employed locally recruited staff, we were able to reach
preexisting comorbidities, affect the impacts of COVID-19 and
population segments that web-based surveys (in a country with
NPIs will help identify those who are most in need of support
rural areas that have limited access to internet) and even
during such crises. The ongoing SAPRIN COVID-19
random-digit dialing approaches (in a country with 11 official
surveillance program will enable the longitudinal measurement
spoken languages and numerous dialects) struggle to capture.
of these factors throughout the epidemic’s course.
Additionally, we could link self-response survey data to other
Strengths and Limitations data sources within the SAPRIN databases. These include the
This study has limitations. As with all observational studies, previously collected sociodemographic data used in this study
the generalizability of our results to those outside our study and biological samples that were collected as part of the
population—in this case, households in rural and periurban COVID-19 surveillance project. SAPRIN data can also be linked
areas of eastern South Africa—is uncertain. This concern was to data on public sector health care use and laboratory test results
tempered by our ability to compare and combine data across through memoranda of understanding with government
multiple sites and compare our results to those of other studies departments. SAPRIN’s ongoing expansion will also allow
on the COVID-19 epidemic’s impact in South Africa and comparisons with well-characterized urban sites to be made in
Sub-Saharan African. Additionally, while household cellphone the future.
ownership was high, there was evidence that lower-wealth Conclusion
households in these areas were somewhat less likely to
South Africans in three rural and periurban areas were largely
participate in the survey. Although nonrandom response may
willing and able to comply with national government regulations
have affected prevalence measures, it should have very limited
and recommendations regarding social interaction and other
scope to affect the trend measures we focused on. Further, our
risk behaviors related to COVID-19, despite limited resources
data were self-reported and thus represented perceived needs
and the substantial economic need to travel. This rapid uptake
and impacts, and changes in reported behavior may have
of preventative behaviors reflects the clarity of government
reflected desirability biases. However, even with such biases,
messages and the population’s willingness to comply with such
our findings provide insight into the perceptions and lived
measures, even in settings where enforcement measures were
experiences of these communities. Comparing our findings to
limited. Even as official NPIs were relaxed, the arrival of the
digital data sources can help alleviate such biases. Finally, we
https://publichealth.jmir.org/2021/5/e26073 JMIR Public Health Surveill 2021 | vol. 7 | iss. 5 | e26073 | p. 13
(page number not for citation purposes)
XSL• FO
RenderXJMIR PUBLIC HEALTH AND SURVEILLANCE Harling et al
epidemic in local areas led to further self-imposed behavioral based on epidemic cycles and show that mitigation measures
restrictions, several of which led to difficulties in accessing will be required to combat anticipated and unanticipated
health care. However, the economic and mental health effects secondary impacts. All of these factors should be considered
of NPIs continued to decline as the measures were eased. Our when setting, adjusting, and relaxing NPIs in low-income
findings highlight the importance of monitoring the possibly settings, especially as urgently established national policies give
deleterious secondary impacts of NPIs in epidemic situations. way to differentiated, decentralized approaches across diverse
Our results reinforce the principle that NPIs should be adjusted subnational environments.
Acknowledgments
We gratefully acknowledge the enormous efforts of all the call center agents at the three study sites who worked intensively
throughout the COVID-19 epidemic and the participants who responded multiple times despite the difficult social and economic
conditions. Core surveillance activities, including the telephonic surveillance of COVID-19 at all three nodes, are wholly or in
part funded by the South African Department of Science and Innovation through the SAPRIN, which is hosted by the South
African Medical Research Council. The MRC/Wits Rural Public Health and Health Transitions Research Unit, which hosts the
Agincourt Health and Socio-Demographic Surveillance System, is also supported by the University of the Witwatersrand and
Medical Research Council of South Africa. DIMAMO Population Health Research Centre receives funding from the National
Institutes of Health and is supported by the Human Heredity and Health in Africa Consortium. The African Health Research
Institute receives funding from the Wellcome Trust (grant number: 201433/Z/16/Z) for the aspects of its health and demographic
surveillance. GH is supported by a fellowship from the Royal Society and the Wellcome Trust (grant number: 210479/Z/18/Z).
EBW is supported by the National Institutes of Health (grant numbers: NIAID K08AI118538 and FIC R21TW011687). This
research was funded in whole, or in part, by the Wellcome Trust (grant numbers: 201433/Z/16/Z and 210479/Z/18/Z). For the
purpose of open access, the author has applied a CC-BY public copyright license to any Author Accepted Manuscript version
arising from this submission.
Conflicts of Interest
None declared.
Multimedia Appendix 1
Supplementary materials.
[DOCX File , 235 KB-Multimedia Appendix 1]
References
1. Dong E, Du H, Gardner L. An interactive web-based dashboard to track COVID-19 in real time. Lancet Infect Dis 2020
May;20(5):533-534 [FREE Full text] [doi: 10.1016/S1473-3099(20)30120-1] [Medline: 32087114]
2. Jackson JK, Weiss MA, Schwarzenberg AB, Nelson RM, Sutter KM, Sutherland MD. Global economic effects of COVID-19.
Congressional Research Service. URL: https://fas.org/sgp/crs/row/R46270.pdf [accessed 2021-04-16]
3. Xiong J, Lipsitz O, Nasri F, Lui LMW, Gill H, Phan L, et al. Impact of COVID-19 pandemic on mental health in the general
population: A systematic review. J Affect Disord 2020 Dec 01;277:55-64 [FREE Full text] [doi: 10.1016/j.jad.2020.08.001]
[Medline: 32799105]
4. Hogan AB, Jewell BL, Sherrard-Smith E, Vesga JF, Watson OJ, Whittaker C, et al. Potential impact of the COVID-19
pandemic on HIV, tuberculosis, and malaria in low-income and middle-income countries: a modelling study. Lancet Glob
Health 2020 Sep;8(9):e1132-e1141 [FREE Full text] [doi: 10.1016/S2214-109X(20)30288-6] [Medline: 32673577]
5. Gilbert M, Pullano G, Pinotti F, Valdano E, Poletto C, Boëlle PY, et al. Preparedness and vulnerability of African countries
against importations of COVID-19: a modelling study. Lancet 2020 Mar 14;395(10227):871-877 [FREE Full text] [doi:
10.1016/S0140-6736(20)30411-6] [Medline: 32087820]
6. Nojilana B, Bradshaw D, Pillay-van Wyk V, Msemburi W, Laubscher R, Somdyala NIM, et al. Emerging trends in
non-communicable disease mortality in South Africa, 1997 - 2010. S Afr Med J 2016 Apr 01;106(5):58. [doi:
10.7196/SAMJ.2016.v106i5.10674] [Medline: 27138667]
7. Oni T, Berkowitz N, Kubjane M, Goliath R, Levitt NS, Wilkinson RJ. Trilateral overlap of tuberculosis, diabetes and HIV-1
in a high-burden African setting: implications for TB control. Eur Respir J 2017 Jul 20;50(1):1700004 [FREE Full text]
[doi: 10.1183/13993003.00004-2017] [Medline: 28729474]
8. Sekyere E, Bohler-Muller N, Hongoro C, Makoae M. The impact of COVID-19 in South Africa. Wilson Center. 2020 Apr.
URL: https://www.wilsoncenter.org/sites/default/files/media/uploads/documents/
The%20Impact%20of%20COVID-19%20in%20South%20Africa_0.pdf [accessed 2021-04-16]
9. Abdool Karim SS. The South African Response to the Pandemic. N Engl J Med 2020 Jun 11;382(24):e95 [FREE Full text]
[doi: 10.1056/NEJMc2014960] [Medline: 32469479]
https://publichealth.jmir.org/2021/5/e26073 JMIR Public Health Surveill 2021 | vol. 7 | iss. 5 | e26073 | p. 14
(page number not for citation purposes)
XSL• FO
RenderXYou can also read