PRR 2017 Performance Review Report An Assessment of Air Traffic Management in Europe during the Calendar Year 2017 - Eurocontrol

Page created by Juanita Burke
 
CONTINUE READING
PRR 2017 Performance Review Report An Assessment of Air Traffic Management in Europe during the Calendar Year 2017 - Eurocontrol
EUROCONTROL

                           PRR 2017
Performance Review Report
An Assessment of Air Traffic Management in Europe
                    during the Calendar Year 2017

                Performance Review Commission

                                            May 2018
PRR 2017 Performance Review Report An Assessment of Air Traffic Management in Europe during the Calendar Year 2017 - Eurocontrol
Background
This report has been produced by the Performance Review Commission (PRC). The PRC was established
by the Permanent Commission of EUROCONTROL in accordance with the ECAC Institutional Strategy 1997.
One objective of this strategy is “to introduce a strong, transparent and independent performance review
and target setting system to facilitate more effective management of the European ATM system, encourage
mutual accountability for system performance…”

All PRC publications are available from the website: http://www.eurocontrol.int/prc/publications

Notice
The PRC has made every effort to ensure that the information and analysis contained in this document
are as accurate and complete as possible. Only information from quoted sources has been used and
information relating to named parties has been checked with the parties concerned. Despite these
precautions, should you find any errors or inconsistencies we would be grateful if you could please bring
them to the PRU’s attention.

The PRU’s e-mail address is pru-support@eurocontrol.int

Copyright notice and Disclaimer

EUROCONTROL

© European Organisation for the Safety of Air Navigation (EUROCONTROL)
This document is published by the Performance Review Commission in the interest of the exchange of
information.

It may be copied in whole or in part providing that the copyright notice and disclaimer are included. The
information contained in this document may not be modified without prior written permission from the
Performance Review Commission.

The views expressed herein do not necessarily reflect the official views or policy of EUROCONTROL, which
makes no warranty, either implied or express, for the information contained in this document, neither
does it assume any legal liability or responsibility for the accuracy, completeness or usefulness of this
information.

Printed by EUROCONTROL, 96, rue de la Fusée, B-1130 Brussels, Belgium. The PRC’s website address is
http://www.eurocontrol.int/prc/publications. The PRU’s e-mail address is pru-support@eurocontrol.int.
PRR 2017 Performance Review Report An Assessment of Air Traffic Management in Europe during the Calendar Year 2017 - Eurocontrol
FOREWORD by the PRC Chairman

                           With the institutional landscape changing over the past years, the PRC’s
                           role has evolved in step, to ensure, inter alia, that its tasks complement
                           those of the Performance Review Body of the Single European Sky (SES)
                           and avoid overlaps. The PRC has also reduced its size to seven members.
                           The PRC’s balance of independent expertise will continue to be needed in
                           view of the multifaceted challenges our industry will face over the coming
                           years. I am pleased therefore to welcome Dr Darren Rhodes (ENV), Dr Jan
                           Malawko (Airports) and Marc Baumgartner (OPS) who have joined the
                           PRC since the beginning of 2018.
                          The introduction of binding economic and capacity performance targets
                          by the SES Performance Scheme in 2012 contributed to a steady
                          improvement in cost-efficiency, while on the capacity side the Air
Navigation Service (ANS) system benefited from lower traffic levels caused by the economic crisis
which began in 2008.
While the continuous improvement in cost-efficiency is to be welcomed, taking the economic view,
i.e. combining provision and delay costs, the PRC notes with concern however that a significant
proportion of these cost-efficiency savings are being absorbed by the sustained increase in ATFM
delay costs. The PRC recalls that it had expressed concerns in previous performance review reports
that delays would also increase unless sufficient attention was focussed on capacity management.
In this current PRR, the PRC provides an analysis of the most constraining regulations in 2017 and
reiterates its message that, in view of the often considerable lead times needed to add capacity,
over-conservative capacity planning not only has an impact locally in terms of costly delays to
airspace users, it also introduces operational uncertainty for the entire network. The Air Navigation
Service Provider’s challenge is to accommodate demand in a safe and an even more cost-efficient
manner. In some cases this may require a higher level of flexibility in capacity planning and
deployment
New technologies such as virtual centres, remote towers, flight-centric operations and sector-less
ANS, as well as a rapidly growing drone market will further add to this challenge but will also give
new opportunities to improve ANS performance in Europe.
As PRC Chairman, I assure you that the PRC will continue to play its part in fostering improvements in
overall ANS performance for the benefit of all aviation stakeholders. It will continue to conduct
performance review for all of the EUROCONTROL Member States and will carry out research and
development into the longer-term evolution of ANS performance review, including benchmarking
with regions outside Europe.
Should you wish to contact the PRC, you can find contact details on the inside-back cover of this
report.

Pleasant reading!

Ralph Riedle
Chairman
Performance Review Commission
PRR 2017 Performance Review Report An Assessment of Air Traffic Management in Europe during the Calendar Year 2017 - Eurocontrol
DOCUMENT IDENTIFICATION SHEET

                               DOCUMENT DESCRIPTION
                                        Document Title

                              Performance Review Commission
            Performance Review Report covering the calendar year 2017 (PRR 2017)

        PROGRAMME REFERENCE INDEX:                   EDITION:            EDITION DATE:

        PRC Performance Review Report             Final report            16-May-2018

This report of the Performance Review Commission analyses the performance of the European
Air Traffic Management System in 2017 under the Key Performance Areas of Safety, Capacity,
Environment and Cost-efficiency.

                                          Keywords
Air Traffic Management                         Performance Measurement
Performance Indicators                         ATM                      ANS
              Performance Review Unit, EUROCONTROL, 96 Rue de la Fusée,
 CONTACT:     B-1130 Brussels, Belgium. Tel: +32 2 729 3956,
              E-Mail: pru-support@eurocontrol.int
              Web: http://www.eurocontrol.int/ansperformance

                               DOCUMENT STATUS AND TYPE

                  STATUS                                         DISTRIBUTION
Draft                                         General Public                            
Proposed Issue                                EUROCONTROL Organisation                  
Released Issue                                Restricted                                

INTERNAL REFERENCE NAME:                       PRR 2017
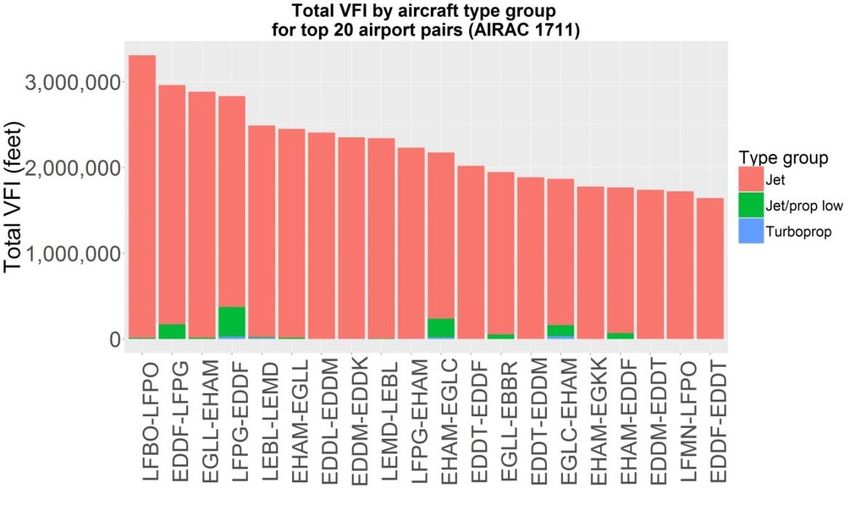
PRR 2017 Performance Review Report An Assessment of Air Traffic Management in Europe during the Calendar Year 2017 - Eurocontrol
EXECUTIVE SUMMARY
EXECU TI VE SUMM ARY

                                                                                                                                                ATM Performance in 2017 - Synopsis
                                                                                               Key Performance Indicator                                                                                                                                     Data & commentary
                                                             14                                                                                                                                                  8%
                                                                                                          IFR Flights in 2017: 10.6 M (+4.3%) 
                                                                                                                                                                                                                                                                        Eurocontrol
                                                                                                                                                                                                                                                   IFR flights                             Variation
                                                             13
                                                                                                                                                                                                                 6%
                                                                                                                                                                                                                                                                           area
                                                                                                                                                                                                                 4%
                                                                                                                                                                                                                                                     2017                 10.6 M          + 4.3% 

                                                                                                                                                                                                                       yearly growth (%)
                                                             12
                                    IFR flights (Millions)

                                                                               Feb. 2008
                                                                                                                                                                                                                 2%
                TRAFFIC

                                                                                forecast
                                                             11                                                                                                                                                  0%
                                                                                                                                                                         STATFOR (Feb. 2018)
                                                                                                                                                                           7-year forecast                       -2%                       In 2017, IFR flights increased on average by +4.3% in
                                                             10
                                                                                                   Feb. 2011                Feb. 2014                                                                            -4%                       the ECAC area which corresponds to the STATFOR high
                                                                                                    forecast                 forecast
                                                                9
                                                                                                                                                                                                                 -6%                       forecast scenario.
                                                                8                                                                                                                                                -8%                       For 2018, the Feb. 2018 STATFOR 7-year forecast
                                                                                            2010

                                                                                                                          2014

                                                                                                                                                                                2021
                                                                              2008
                                                                                     2009

                                                                                                   2011
                                                                                                           2012
                                                                                                                  2013

                                                                                                                                  2015
                                                                                                                                         2016
                                                                                                                                                  2017
                                                                                                                                                         2018
                                                                                                                                                                  2019
                                                                                                                                                                         2020

                                                                                                                                                                                        2022
                                                                                                                                                                                               2023
                                                                                                                                                                                                        2024
                                                                                                                                                                                                                                           expects flights to grow by 3.3% (baseline scenario).
                                                                                                                                                            Source : EUROCONTROL/STATFOR (ECAC)

                                                             Accidents with ATM contribution - fixed wing, weight >2250kg MTOW)                                                                                                              Accidents with direct      Eurocontrol
                                                                                                                                                                                                                                                                                           Variation
                                                                     4                                                                                                                                                                         ANS contribution            area
                                                                                                           3.2%
                                                                                                                                           3.4%
                                                                                 2.7%
                                                                     3                                                                                                                                                                       2017 (preliminary)               1                -1
                                                                                                                                                                                                2.4%
                SAFETY

                                                                     2                        1.5%
                                                                                                                                                                  1.2% 1.1%
                                                                                                                                                                                                              1.4%                         There was one reported accident with direct ATM
                                                                     1                                                                                                                                                                     contribution and none with indirect ATM contribution
                                                                     0                                                                                                                                                                     in 2017 (P).
                                                                                 2008 2009 2010 2011 2012 2013 2014 2015 2016 2017                                                                                                         The share of accidents with ATM contribution (direct
                                                                         Accidents with indirect ATM contribution                            (P)
                                                                         Accidents with direct ATM contribution
                                                                                                                                                                                                                                           or indirect) in total air traffic accidents decreased from
                                                                         % of accidents with direct or indirect ATM contribution in total accidents                                                                                        2.4% to 1.4% in 2017.

                                                                                               Share of flights delayed by en route
                                                                                                                                                                                                                                            En-route ATFM delayed       Eurocontrol
                                                                                                                                                                                                                                                                                           Variation
                                                                                                         ATFM delays (%)                                                                                                                            flights                area
                                                                                                                                                                                                                                                     2017                  5.3 %         +0.6 %pt.
                                                                                                                                                         4.8% 5.3%
                CAPACITY

                                                                                                      3.9%
                                                                                            2.7% 3.2%                                                                                                                                      In 2017, 5.3% of all flights in the EUROCONTROL area
                                                                                                                                                                                                                                           were delayed by en-route ATFM delays (+0.6% pt. vs.
                                                                                                                                                                                                                                           2016). The most constraining ACCs in 2017 were
                                                                                                                                                                                                                                           Karlsruhe UAC, Nicosia, Marseille, Brest, Maastricht
                                                                                            2013 2014 2015 2016 2017                                                                                                                       UAC, Barcelona and Bordeaux.

                                                                              100%                                                                                                                                                         En-route flight efficiency   Eurocontrol
                                                                                                                         Flight Plan                             Actual trajectory                                                                                                         Variation
                                                                                                                                                                                                                                                   (actual)                area
                                                                               99%
                                                                                                                                                                                                                                                     2017                  97.3%         +0.2%pt. 
                                                                                                                                          97.4%

                                                                                                                                                                97.3%
                ENVIRONMENT

                                                                                                                                                                                                      97.3%
                                                             efficiency (%)

                                                                                                                                                                                97.1%
                                                                                                                         97.0%
                                                                                                     96.9%

                                                                               98%
                                                                                                                                                                                                                                           Despite the further notable increase in traffic in 2017,
                                                                               97%                                                                                                                                                         horizontal flight efficiency in filed flight plans increased
                                                                                                                                                                                                      95.6%
                                                                                                                                          95.5%

                                                                                                                                                                95.5%

                                                                                                                                                                                95.4%
                                                                                                                         95.4%
                                                                                                     95.4%

                                                                               96%                                                                                                                                                         from 95.4% in 2016 to 95.6% in 2017 at Pan-European
                                                                                                                                                                                                                                           level.
                                                                               95%
                                                                                                                                                                                                                                           At the same time, the efficiency of actual trajectories
                                                                                                    2012

                                                                                                                         2013

                                                                                                                                          2014

                                                                                                                                                                2015

                                                                                                                                                                                2016

                                                                                                                                                                                                  2017

                                                                                                                                                                                                                                           increased from 97.1% to 97.3% in 2017

                                                                         70            66.9
                                                                                                   63.1                                                                                 125
                                                                                                                                                                                                  En-route
                                                                                                                                                                                                                                           En-route ANS costs per TSU    Eurocontrol
                                                                                                                                 61.3                                                             TSU index                                                                                Variation
                COST-EFFICIENCY

                                                                                                                  59.7                      59.3
                                                                         60                                                                               56.1           54.8
                                                                                                                                                                                       52.9
                                                                                                                                                                                                   (2009)                                            (€2016)                area
                                  En-route real cost
                                   per TSU (€2016)

                                                                                                                                                           116
                                                                         50
                                                                                                                                            109
                                                                                                                                                                         120
                                                                                                                                                                                                                                                      2016                   52.9         -3.5% 
                                                                                                                  108
                                                                         40                                                      107
                                                                                                    103
                                                                                                                                                                                                      En-route ANS
                                                                                                                                                                                                                                           In 2016, en-route ANS costs increased by +0.4% while
                                                                         30
                                                                                                                                  98                            97
                                                                                                                                                                           98
                                                                                                                                                                                        99               cost index
                                                                                                                                                                                                         (2009)
                                                                                                                                                                                                                                           en-route service units increased by +4.1% leading to a
                                                                                                      97            97                          97
                                                                         20                                                                                                                                                                further decrease in en-route unit costs by -3.5%
                                                                                      2009    2010    2011    2012    2013    2014    2015    2016                                                     Source: PRU
                                                                                     Actuals Actuals Actuals Actuals Actuals Actuals Actuals Actuals                                                     analysis                          compared to 2015.

EXECUTIVE SUMMARY                                                                                                                                                                                       i                                                                           PRR 2017
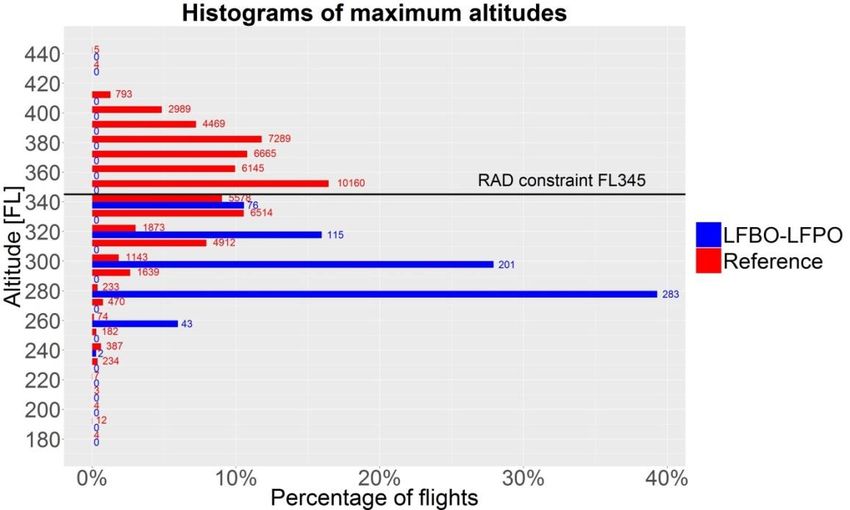
PRR 2017 Performance Review Report An Assessment of Air Traffic Management in Europe during the Calendar Year 2017 - Eurocontrol
EXECUTIVE SUMMARY

This report assesses the performance of Air Navigation Services (ANS) in the EUROCONTROL area for
the calendar year 2017 for all key performance areas, except for cost-efficiency, which analyses
performance in 2016 as this is the latest year for which actual financial data are available.
               In 2017, air traffic in the EUROCONTROL area continued to increase for the fourth
               year taking the number of flights past the previously highest level in 2008. On
               average, the number of controlled flights in 2017 increased by 4.3% compared to
               2016, which corresponds to the high forecast scenario predicted by STATFOR in the
               February 2017 forecast. As in previous years, controlled flight hours, en-route service
units and passenger numbers grew at a higher rate than flights.
As a consequence, peak traffic load continued to rise in 2017 and reached the highest level of traffic
on record on June 30th when 35,251 flights were served in the EUROCONTROL area. The peak day
was 23.8% higher than an average day.
Of the 41 Air Navigation Service Providers (ANSPs) included in the analysis, all but Avinor (Norway)
showed an increase in traffic compared to 2016. In absolute terms, DSNA (France), ENAIRE (Spain),
DFS (Germany) and NATS (UK) showed the highest year-on-year growth in 2017.
For 2018, the latest STATFOR forecast (Feb. 2018) predicts a growth of 3.1% at system level and an
average annual growth rate of 2.3% between 2016 and 2024.
The continued notable traffic growth contributed to a further decrease in overall service quality. The
share of flights arriving within 15 minutes of their scheduled time decreased by 0.9 percent points to
79.6% in 2017. At the same time, the average departure delay increased by 1 minute from 11.2
minutes per departure in 2016 to 12.2 minutes in 2017.

                Safety is the primary objective of ANS and overall safety levels in the EUROCONTROL
                area remain high. There were two reported air traffic accidents with direct ANS
                contribution in 2016 which is the latest year for which validated data are available,
                and only one in 2017 based on preliminary data.
In absolute terms, the number of three key risk occurrence types: separation minima infringements
(SMI), runway incursions (RI), and ATM Specific Occurrences decreased in 2017, while the number of
unauthorised penetrations of airspace (UPA) increased. However, in relative terms the rate of
occurrences in the EUROCONTROL area stayed almost the same as in 2016: there were 13.8 SMIs and
29.2 UPAs per hundred thousand controlled flight hours in the airspace and less than one (0.8) RIs
per ten thousand movements at airports reported in 2017.
The PRC review of the implementation status of the Acceptable Level of Safety Performance (ALoSP)
concept in EUROCONTROL Member States suggested that there is a need for common definitions and
guidance material in order to ensure a harmonised approach in the EUROCONTROL area.
In 2017 the PRC met EASA representatives in order to present and discuss the findings of the PRC’s
ALoSP survey and associated potential future actions. The meeting identified potential actions and
measures to be taken. EASA and the PRC agreed to further explore working concepts and how to
implement further steps.
                   Following the trend over the past three years, total en-route ATFM delays in 2017
                   continued to increase at a higher rate (+7.1% vs. 2016) than flights (+4.3% vs.
                   2016). At the same time, the share of flights delayed by en-route ATFM
                   regulations in the EUROCONTROL area increased from 4.8% to 5.3%.
                     ATC Capacity/Staffing attributed issues remained by far the main portion of en-
route ATFM delays (59.9%), followed by Weather attributed delays (23.2%) and ATC disruptions/
industrial actions (9.9%). The trend analysis shows a continuous increase in ATC Capacity/Staffing and
Weather-attributed delays over the past four years which gives reason for concern. It confirms the
PRC concerns, raised on several occasions, that ATFM delays could increase notably when traffic
grows again if insufficient focus is put on capacity planning and deployment.

EXECUTIVE SUMMARY                                 ii                                        PRR 2017
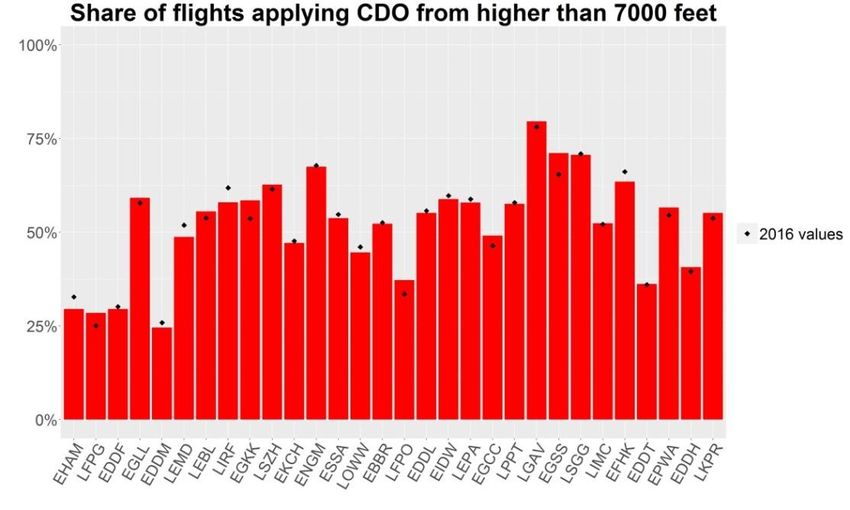
PRR 2017 Performance Review Report An Assessment of Air Traffic Management in Europe during the Calendar Year 2017 - Eurocontrol
EXECUTIVE SUMMARY

The analysis showed that the constraints were mainly concentrated in the European core area where
traffic density is highest. In 2017, 82% of all en-route ATFM delay in the EUROCONTROL area was
generated by only five air navigation service providers: DSNA (33.4%), DFS (23.1%), Maastricht
(13.3%), ENAIRE (7.9%), and DCAC Cyprus (4.3%).
The most constraining ACCs in 2017 were Karlsruhe UAC (18.6%), Maastricht UAC (13.3%), Marseille
(12.8%), Brest (10.1%), Bordeaux (5.0%), Nicosia (4.3%) and Barcelona (4.2%), which together
accounted for almost 70% of all en-route ATFM delay in the EUROCONTROL area.
The most penalising ATFM en-route regulations were analysed further in terms of delay attributed to
elementary sectors and delays attributed to collapsed sectors which - by being collapsed - were
already limiting the available capacity for airspace users. Irrespective of the delay causes
(Capacity/Staffing or Weather), the results showed a surprisingly high share of ATFM delay (in some
cases above 90%) originating from collapsed sectors.
Despite the further notable increase in traffic in 2017, horizontal flight efficiency in filed flight plans
increased from 95.4% in 2016 to 95.6% in 2017 at EUROCONTROL level. At the same time, the
efficiency of actual trajectories increased from 97.1% to 97.3% in 2017.
PRR 2016 underlined the benefits of the implementation of Free Route Airspace (FRA) which offers a
more flexible environment and more choices to airspace users whilst contributing to reduced fuel
consumption and emissions and higher flight efficiency. FRA is now in place in a large part of
EUROCONTROL airspace. It is not yet implemented in the dense European core area where even
small improvements are expected to bring notable benefits. In addition to the implementation of FRA
in a given airspace, ANSPs should also work actively with the Network Manager and the Deployment
Manager to deliver FRA across the entire EUROCONTROL area, including necessary cross-border
implementation.
Complementary to horizontal flight efficiency, the analysis of vertical en-route flight efficiency
showed that the highest level of vertical inefficiencies originated from flights on high-density airport
pairs in the European core area which were unable to enter the two Upper Area Control Centres
Maastricht and Karlsruhe.
The Flexible Use of Airspace concept and closer Civil/Military cooperation and coordination are an
important enabler to improve capacity and flight efficiency performance. Future technologies such as
“Unmanned Aircraft System” (UAS) are also expected to have an impact on airspace management
and would therefore also benefit from the further improvement of identified shortcomings in the
application of the FUA concept highlighted in the PRC survey conducted in 2016.
                   The analysis of the top 30 European airports in terms of traffic showed an average
                   increase in traffic of 2.2% in 2017. Amsterdam (AMS) remained the airport with
                   the most commercial movements in Europe with a reported 4.5% increase in
                   traffic over 2016. Of the top 30 airports, Lisbon (LIS) and Warsaw (WAW) reported
                   the highest growth (> 11% vs. 2016) while Berlin Tegel (-6.3%) and Rome
                   Fiumicino (-5%) showed the most significant reduction in traffic.
The analysis of the hourly arrival throughputs showed the high saturation level at London Heathrow
again but also that Istanbul Atatürk and Istanbul Sabiha Gökçen consistently operate close to the
peak declared arrival capacity during most of the day.
Notwithstanding the further increase in traffic, average airport ATFM delays at the top 30 European
airports decreased from 1.36 to 1.25 minutes per arrival. The increase in weather-attributed airport
arrival ATFM delays in 2017 offset to some extent the decrease in capacity-attributed airport ATFM
delays. Overall, 52.2% of all airport arrival ATFM delay in 2017 was weather-attributed, followed by
capacity/staffing attributed issues with 40%.
Despite a substantial improvement, the two Istanbul airports still accounted for 32% of all capacity
attributed airport arrival ATFM delays in 2017, following the high delays over the previous years. The
new Istanbul airport which is presently being built will gradually replace Istanbul Atatürk airport and

EXECUTIVE SUMMARY                                   iii                                          PRR 2017
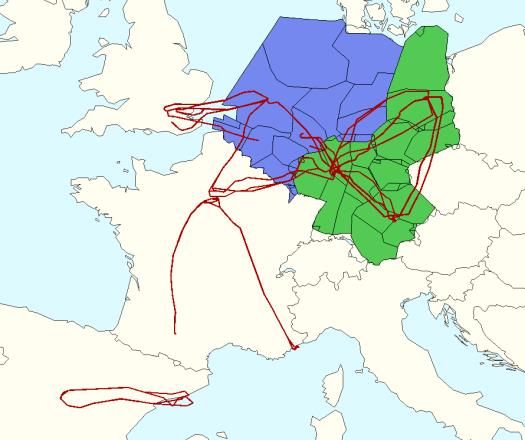
PRR 2017 Performance Review Report An Assessment of Air Traffic Management in Europe during the Calendar Year 2017 - Eurocontrol
EXECUTIVE SUMMARY

is expected to ease the capacity situation in Istanbul once it is operational. Although not among the
top 30 airports, it is noteworthy that some regional Greek airports still have a significant impact on
the network. Seven regional Greek airports accounted for more than 12% of the total airport arrival
delays between June and August 2017.
Additional holding (ASMA) time increased slightly in 2017 to 2.19 minutes per arrival at the top 30
airports and remained above 8 minutes per arrival at London Heathrow airport which accounted for
one quarter of the total ASMA additional time at the top 30 airports in 2017.
Additional taxi-out time, on the other hand, showed a modest reduction driven mainly by the
improvements at Lisbon (LIS), Paris Charles de Gaulle (CDG), Rome (FCO), Madrid (MAD) and
Copenhagen (CPH).
Building on the methodology for vertical flight efficiency in climbs and descents, this year’s report
introduces an analysis measuring the share of flights applying Continuous Descent Operations (CDOs)
from higher than 7,000 feet above which the fuel saving effect is considered to be more relevant
than the noise effect. At 11 of the top 30 airports, less than 50% of the arrivals applied a CDO from
higher than 7,000 feet which suggests scope for further improvement.
                     In 2016, the latest year for which actual financial data are available, the en-route
                     ANS unit costs of the Pan-European system amounted to 52.9 €2016 per service
                     unit (TSU). This is -3.5% lower than in 2015 since in 2016 the number of TSUs rose
                     faster (+4.1%) than en-route ANS costs (+0.4%). En-route unit costs are expected
                     to reduce by -1.5% annually over the 2016-2019 period and reach a value of 50.6
€2016. If these plans materialise, the en-route unit costs in 2019 will be some -24% lower than in 2009,
implying a remarkable cost-efficiency improvement achieved by maintaining the cost-base close to
2009 levels in the context of +2.8% annual increase in TSUs over the period.
In 2016, European terminal ANS unit costs amounted to 183.4 €2016 per terminal service unit (TNSU).
This is -3.6% lower than in 2015 since TNSUs rose much faster (+4.8%) than terminal ANS costs
(+1.0%). Terminal ANS unit costs are expected to decrease by -1.7% annually over the 2016-2019
period and amount to 174.3 €2016 in 2019. This performance improvement reflects the fact that total
terminal ANS costs are planned to decrease by -1.3% p.a. while TNSUs are expected to increase at an
average rate of +1.4% per annum.
Detailed ANSPs benchmarking analysis indicates that in 2016 gate-to-gate ATM/CNS provision costs
slightly rose compared to 2015 (+0.7%) and amounted to some €8.1 Billion at Pan-European system
level. At the same time traffic, expressed in terms of composite flight hours, increased by +2.4% over
this period. As a result, gate-to-gate unit ATM/CNS provision costs in 2016 decreased by -1.7% at
Pan-European level.
In order to also consider the service quality provided by ANSPs, the gate-to-gate economic
performance combines ATM/CNS provision costs and the cost of ATFM delays.
Although unit ATM/CNS provision costs decreased in 2016, the unit economic costs increased by
+1.5% to reach €494 per composite flight-hour reflecting a substantial increase in the unit costs of
ATFM delays (+20.3% vs. 2015). In fact, the trend of decreasing ATFM delays observed in previous
years stopped in 2013, when a new cycle characterised by higher delays started.
Current analysis provided in the operational ANS performance chapter of this report indicates that
the trend of increasing delays continued in 2017 albeit in a lower magnitude since en-route ATFM
delays were +7.1% higher than in 2016. It is therefore important to monitor the impact of this
increase on the Pan-European system economic cost-effectiveness performance in 2017.

EXECUTIVE SUMMARY                                  iv                                          PRR 2017
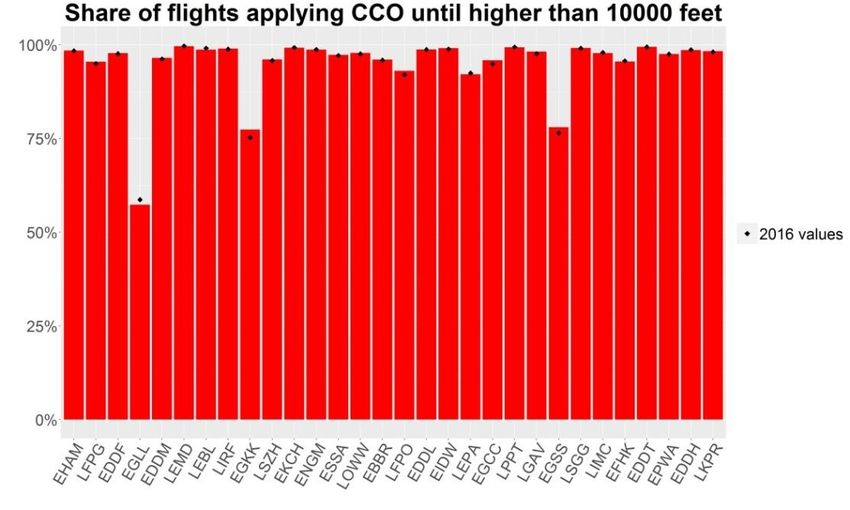
PRR 2017 Performance Review Report An Assessment of Air Traffic Management in Europe during the Calendar Year 2017 - Eurocontrol
EXECUTIVE SUMMARY

PRC Recommendations 2017

                  Recommendation                                              Rationale

a)   The Provisional Council is invited to:             Safety is clearly the primary objective of ANS.
     1) recall that PC/45 (2016) had: “requested        As pointed out by the PRC in PRR 2015, with the
        the PRC to monitor the development of the       safety reporting environment changing over the next
        changing safety reporting environment and       few years, it has to be accepted that there will be a
        to ensure that safety performance review        transition phase.
        data remains a constituent part of PRC
                                                    During this time, in order to maintain and improve
        performance review.”;
                                                    European reporting, it will be highly important that
     2) note that the PRC’s work on Safety is based the actors directly involved in safety data collection
        primarily    on     data    provided     to work together in order to create an optimum
        EUROCONTROL through its Annual solution.
        Summary Template (AST) reporting
                                                    With the PRC monitoring the changes in the safety
        mechanism, which is likely to be
                                                    reporting environment, the PRC underlines its concern
        discontinued by 2020;
                                                    raised in PRR 2015 that during this transition phase,
     3) request the PRC to discuss with the Agency availability, completeness and quality of safety data
        and other relevant parties with a view to and associated safety data analysis will deteriorate
        ensuring continued access to a reliable due to lack of arrangements between all parties
        source of safety data for its work post within the process.
        2020;
     4) submit this recommendation (a.1-a.3) to
         the Permanent Commission for approval.

                  Recommendation                                              Rationale

b) The Provisional Council is invited to note that at   The introduction of binding economic and capacity
   pan-European system level, over the 2011-2016        performance targets by the SES Performance Scheme
   period, ANSP costs remained fairly constant in a     in 2012 contributed to a steady improvement of cost-
   context of traffic growth, resulting in cost-        efficiency while on the capacity side the Air Traffic
   effectiveness performance improvements. On           Management (ATM) system still benefited from the
   the other hand, when considering an economic         depressed traffic levels, following the start of the
   costs perspective (combining ANSPs costs and         economic crisis in 2008.
   ATFM delays), it appears that a significant part
                                                        The total economic costs enable a more complete
   of these cost-effectiveness improvements were
                                                        view taking also the costs of delay to airspace users
   offset by a new cycle of continuously higher
                                                        into account.
   ATFM delays which started in 2014.
     The evolution of this situation will be
     monitored by the PRC in future Performance
     Review Reports;

EXECUTIVE SUMMARY                                   v                                              PRR 2017
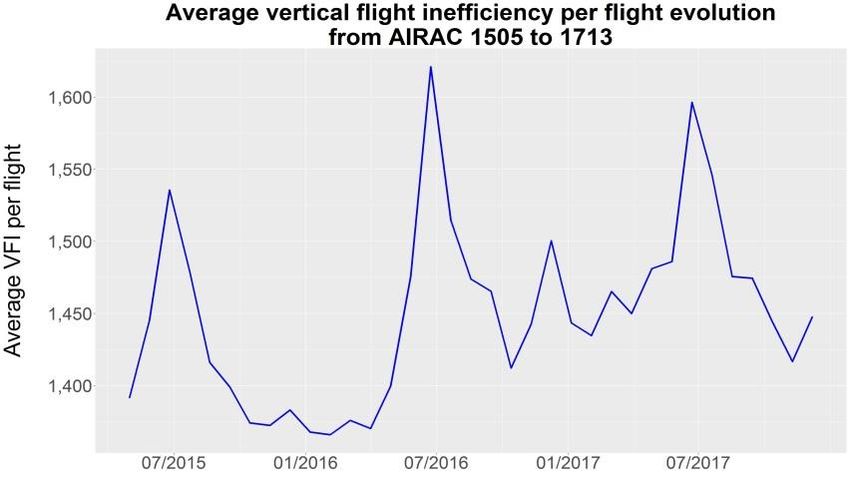
PRR 2017 Performance Review Report An Assessment of Air Traffic Management in Europe during the Calendar Year 2017 - Eurocontrol
EXECUTIVE SUMMARY

                   Recommendation                                          Rationale

c)   The Provisional Council is invited to:            With traffic now increasing again since 2013, the
                                                       PRC concerns, outlined in earlier PRR’s, were
     1) recall that PC/45 (2016) had requested
                                                       confirmed that delays would increase again, unless
        Member States to task their ANSPs to
                                                       sufficient attention was focussed on capacity
        provide sufficient capacity to meet demand
                                                       management.
        and to accurately identify capacity
        constraints that adversely impact service Additionally, the PRC has noted significant
        provision;                                     inconsistencies in the allocation of ATFM delay by
                                                       the ATFCM operational stakeholders.
     2) request the Director General and the
        Member States to strengthen the ATFCM Inconsistency in allocating ATFM delays makes it
        process by developing and adopting strict increasingly difficult to identify the root causes of
        procedures for attributing ATFM delay capacity constraints which in turn prevents
        causes, instead of the current guidelines that appropriate and cost-effective mitigation or
        lead to inconsistencies and opacity in resolution.
        monitoring capacity performance;
                                                       The PRC notes that the ATFCM process does not
     3) submit this recommendation (c.1 and c.2) to contain rules for attributing ATFM delay, but only
        the Permanent Commission for approval.         ‘guidelines’.
                                                       The ATFM delay attribution process should be based
                                                       on the following principles:
                                                       The primary focus for mitigating or resolving
                                                       capacity constraints should be on identifying any
                                                       ANSP-internal constraints that prevent the
                                                       deployment of maximum declared capacity (e.g.
                                                       ATC staffing, equipment or airspace management);
                                                       Attribution of delays to external causes (e.g.
                                                       weather or 3rd party strike) should only be used in
                                                       cases where no ANSP-internal capacity constraints
                                                       prevent the deployment of maximum capacity;
                                                       Attribution of delays to ATC capacity should not be
                                                       used for collapsed sectors or when the regulated
                                                       capacity is less than the maximum declared
                                                       capacity of the sector.

EXECUTIVE SUMMARY                                 vi                                          PRR 2017
TABLE OF CONTENTS

EXECUTIVE SUMMARY .................................................................................................................. I
    PRC RECOMMENDATIONS 2017 ................................................................................................................. V
1      INTRODUCTION AND CONTEXT ............................................................................................. 1
    1.1       ABOUT THIS REPORT .....................................................................................................................1
    1.2       EUROPEAN AIR TRANSPORT KEY INDICES ...........................................................................................3
    1.3       AIR TRANSPORT PUNCTUALITY ........................................................................................................6
    1.4       TOTAL ESTIMATED ANS-RELATED COSTS...........................................................................................7
    1.5       ENVIRONMENTAL SUSTAINABILITY ...................................................................................................8
2      SAFETY............................................................................................................................... 11
    2.1       INTRODUCTION ..........................................................................................................................11
    2.2       ACCIDENTS................................................................................................................................11
    2.3       INCIDENTS ................................................................................................................................13
    2.4       REPORTING AND INVESTIGATION ...................................................................................................15
    2.5       ACCEPTABLE LEVEL OF SAFETY PERFORMANCE (ALOSP) ...................................................................16
    2.6       CONCLUSIONS ...........................................................................................................................17
3      OPERATIONAL EN-ROUTE ANS PERFORMANCE .................................................................... 19
    3.1       INTRODUCTION ..........................................................................................................................19
    3.2       TRAFFIC EVOLUTION ...................................................................................................................20
    3.3       ANS-RELATED OPERATIONAL EN-ROUTE EFFICIENCY .........................................................................22
    3.4       FLEXIBLE USE OF AIRSPACE ...........................................................................................................38
    3.5       CONCLUSIONS ...........................................................................................................................39
4      OPERATIONAL ANS PERFORMANCE AT AIRPORTS ............................................................... 41
    4.1       INTRODUCTION ..........................................................................................................................41
    4.2       TRAFFIC EVOLUTION AT THE TOP 30 EUROPEAN AIRPORTS .................................................................42
    4.3       CAPACITY MANAGEMENT (AIRPORTS).............................................................................................43
    4.4       ANS-RELATED OPERATIONAL EFFICIENCY AT AND AROUND AIRPORTS ...................................................45
    4.5       CONCLUSIONS ...........................................................................................................................52
5      ANS COST-EFFICIENCY (2016) .............................................................................................. 53
    5.1       INTRODUCTION ..........................................................................................................................53
    5.2       EN-ROUTE ANS COST-EFFICIENCY PERFORMANCE ............................................................................54
    5.3       TERMINAL ANS COST-EFFICIENCY PERFORMANCE.............................................................................59
    5.4       ANSPS GATE-TO-GATE ECONOMIC PERFORMANCE ...........................................................................63
    5.5       CONCLUSIONS ...........................................................................................................................68
LIST OF FIGURES
Figure 1-1: EUROCONTROL States (2017) ................................................................................................2
Figure 1-2: European air traffic indices (2008-2017) ...............................................................................3
Figure 1-3: Year on year change versus 2016 ..........................................................................................3
Figure 1-4: Evolution of European IFR flights (2008-2024) ......................................................................4
Figure 1-5: Forecast traffic growth 2018-2024 ........................................................................................4
Figure 1-6: Evolution of daily traffic levels (EUROCONTROL) ..................................................................5
Figure 1-7: Traffic levels by day of the week (2017) ................................................................................5
Figure 1-8: Complexity over time (EUROCONTROL) ................................................................................5
Figure 1-9: Evolution of arrival punctuality (2008-2017) .........................................................................6
Figure 1-10: ANS contribution towards departure total departure delays..............................................6
Figure 1-11: ANS provision costs and ATFM delays between 2008 and 2016 .........................................7
Figure 1-12: Estimated ATM/CNS provision costs and ATFM delay costs (2016 vs. 2008) ......................7
Figure 1-13: Estimated share of CO2 emissions that can be influenced by ANS ......................................8
Figure 1-14: Gate-to-gate efficiency by phase of flight ...........................................................................9
Figure 1-15: Population exposed to noise above 55dB in Europe (in millions) [4] ..................................9
Figure 2-1: Accidents in EUROCONTROL area (2013-17P) .....................................................................12
Figure 2-2: Accidents risk distribution (2013-17P) .................................................................................12
Figure 2-3: Accidents with ATM contribution in the EUROCONTROL area (2008-17P) .........................12
Figure 2-4: Occurrence rates EUROCONTROL area (2017P) ..................................................................13
Figure 2-5: Reported high-risk SMIs (EUROCONTROL) ..........................................................................14
Figure 2-6: Reported high-risk UPAs (EUROCONTROL) ..........................................................................14
Figure 2-7: Reported high-risk RIs (EUROCONTROL) .............................................................................14
Figure 2-8: Reported high-risk ATM Spec. Occurrences (EUROCONTROL) ............................................14
Figure 2-9: Reported occurrences (2008-2017P) ...................................................................................15
Figure 2-10: Severity not classified or not determined (2008-2017P) ...................................................15
Figure 2-11: Completeness of AST reported data in 2017(P) ................................................................16
Figure 3-1: Traffic evolution by ANSP (2017/2016) ...............................................................................20
Figure 3-2: Traffic growth by ACC (2017) ...............................................................................................20
Figure 3-3: Traffic variability by ACC (2017)...........................................................................................21
Figure 3-4: Traffic complexity by ANSP (2017).......................................................................................21
Figure 3-5: Traffic complexity by ACC (2017) .........................................................................................21
Figure 3-6: En-route ATFM delays by reported cause ...........................................................................22
Figure 3-7: Share of en-route ATFM delayed flights by attributed delay category ...............................23
Figure 3-8: Estimated ATC Capacity & Staffing attributed impact on airline operations (2017) ...........23
Figure 3-9: Share of capacity/staffing attributed en-route ATFM delay................................................23
Figure 3-10: Capacity attributed en-route ATFM delay at the most constraining ACCs (2017) ............24
Figure 3-11: Changes in week/weekend delay (2017) ...........................................................................25
Figure 3-12: Impact of weather attributed en-route ATFM delays on airline operations (2017) ..........26
Figure 3-13: Share of weather attributed en-route ATFM delay (2017) ................................................26
Figure 3-14: Weather attributed en-route ATFM delay at the most constraining ACCs (2017) ............27
Figure 3-15: Most constraining ANSPs in 2017 ......................................................................................27
Figure 3-16: Most constraining ACCs in 2017 ........................................................................................28
Figure 3-17: Horizontal en-route flight efficiency (EUROCONTROL area) .............................................31
Figure 3-18: Horizontal en-route flight efficiency by State (actual trajectories – 2017) .......................32
Figure 3-19: Horizontal en-route flight efficiency by State (geographical overview) ............................32
Figure 3-20: Horizontal en-route flight efficiency changes vs 2016 by State ........................................33
Figure 3-21: Status of free route implementation in 2017 (24H) ..........................................................33
Figure 3-22: Local and network effects on flight efficiency by State (2017)..........................................34
Figure 3-23: Horizontal en-route flight efficiency by State (week – weekend changes) .......................35
Figure 3-24: Evolution of average vertical flight inefficiency per flight .................................................35
Figure 3-25: Top 20 airport pairs in terms of total vertical flight inefficiency .......................................36
Figure 3-26: Chart of top 20 airport pairs in terms of total vertical flight inefficiency ..........................36
Figure 3-27: Distributions of maximum altitudes for LFBO-LFPO ..........................................................37
Figure 4-1: Top 30 European airports in terms of traffic in 2017 ..........................................................41
Figure 4-2: ANS-related operational performance at airports (overview) ............................................42
Figure 4-3: Traffic variation at the top 30 European airports (2017/2016) ...........................................42
Figure 4-4: Arrival throughput at the top 30 airports ............................................................................44
Figure 4-5: Evolution of hourly movements at the top 30 airports (2008-2017) ..................................44
Figure 4-6: ANS-related inefficiencies on the arrival flow at the top 30 airports in 2017 .....................46
Figure 4-7: Arrival ATFM delayed arrivals at the top 30 airports (2017) ...............................................46
Figure 4-8: Capacity-related ATFM regulations at Istanbul Sabiha Gökçen Airport (SAW) ...................47
Figure 4-9: Arrival throughput/ATFM delays at regional Greek airports (June-Aug 2017)....................47
Figure 4-10: ATFM slot adherence at airport (2017) .............................................................................48
Figure 4-11: ANS-related inefficiencies on the departure flow at the top 30 airports in 2017 .............49
Figure 4-12: Additional taxi-out time as a function of departure throughput (2017) ...........................49
Figure 4-13: Share of full CDO/CCO operations at the top 30 airports ..................................................50
Figure 4-14: Average time flown level per flight at the top 30 airports ................................................51
Figure 4-15: Share of flights applying CDO from higher than 7000 feet ................................................51
Figure 4-16: Share of flights applying CCO until higher than 10000 feet...............................................51
Figure 5-1: SES and non-SES States ........................................................................................................54
Figure 5-2: Real en-route unit costs per TSU for EUROCONTROL area (€2016) .......................................55
Figure 5-3: 2016 Real en-route ANS costs per TSU by charging zone (€2016) .........................................57
Figure 5-4: Pan-European en-route cost-efficiency outlook 2017-2019 (€2016) .....................................58
Figure 5-5: Geographical scope of terminal ANS cost-efficiency analysis .............................................59
Figure 5-6: Real terminal ANS cost per TNSU at European System level (€2016) ....................................59
Figure 5-7: Breakdown of terminal ANS costs by nature .......................................................................60
Figure 5-8: Breakdown of changes in terminal costs (2015-2016, (€2016)) .............................................60
Figure 5-9: 2016 Real terminal ANS costs per TNSU by charging zone (€2016) .......................................61
Figure 5-10: Real terminal ANS costs per TNSU, total costs (€2016) and TNSUs .....................................62
Figure 5-11: Breakdown of gate-to-gate ATM/CNS provision costs 2016 (€2016)...................................63
Figure 5-12: Economic gate-to-gate cost-effectiveness indicator, 2016 ...............................................64
Figure 5-13: Changes in economic cost-effectiveness, 2011-2016 (€2016) .............................................65
Figure 5-14: Adjusted changes in economic cost-effectiveness, 2011-2016 (€2016) ..............................65
Figure 5-15: Long-term trends in traffic, ATM/CNS provision costs and ATFM delays..........................66
Figure 5-16: ANSPs contribution to ATFM delays increase at Pan-European system level in 2016 ......66
Figure 5-17: Breakdown of changes in cost-effectiveness, 2015-2016 (€2016) .......................................67

                                                    LIST OF TABLES

Table 2-1: Occurrence rates (SMI, RI, UPA) in the EUROCONTROL area (2017) ....................................13
Table 3-1: Operational en-route ANS performance (Overview) ............................................................19
Table 3-2: En-route ATFM delays attributed to ATC staffing (2017)......................................................24
Table 3-3: En-route ATFM delays attributed to weather (2017) ...........................................................27
Table 3-4: Twelve most penalising ATFM regulations attributed to ATC capacity in 2017 ...................29
This page was intentionally left blank
Chapter 1: Introduction

1       Introduction and context
1.1      About this report
Air Navigation Services (ANS) are essential for the safety, efficiency and sustainability of Civil and
Military aviation, and to meet wider economic, social and environmental policy objectives.
The purpose of the independent Performance Review Commission (PRC) is “to ensure the effective
management of the European Air Traffic Management system through a strong, transparent and
independent performance review”, per Article 1 of its Terms of Reference [1]. More information
about the PRC is given on the inside cover page of this report.
This Performance Review Report (PRR 2017) has been produced by the PRC with its supporting unit
the Performance Review Unit (PRU). Its goal is to provide policy makers and ANS stakeholders with
objective information and independent advice concerning the performance of European ANS in 2017,
based on analysis, consultation and information provided by relevant parties. It also gives some
information on other PRC activities in 2017.
As in previous years, stakeholders were consulted on the draft Final Report and were invited to
provide comments for the PRC’s consideration before the report was finalised and the PRC prepared
its recommendations arising out of PRR 2017. The consultation phase was from 16 March – 6 April
2018.
On the basis of PRR 2017 and stakeholders’ comments, the PRC will develop and provide
independent advice on ANS performance and propose recommendations to the EUROCONTROL
States.

1.1.1     Further PRC work
In addition to the PRR which provides an independent holistic view of ANS performance in all
EUROCONTROL Member States across all key performance areas, the PRC work focuses on tasks
complementary to those of the Performance Review Body of the Single European Sky performance
scheme. They include:
-     production of annual ATM Cost-Effectiveness (ACE) Benchmarking reports which present yearly
      factual data and analysis on cost-effectiveness and productivity for Air Navigation Service
      Providers (ANSPs) in Europe;
-     involvement in international benchmarking studies to foster discussions on how to improve the
      air navigation system for the benefit of all users and to support the International Civil Aviation
      Organization (ICAO) in establishing common principles and related guidance material for ANS
      performance benchmarking;
-     provision of in-depth analysis and independent ad-hoc studies on ATM performance, either on
      the PRC’s own initiative or at the request of interested parties;
-     basic R&D into the development of performance measurement;
-     investigation of how performance could be best described/measured in the long-term;
-     development of possible future performance indicators and metrics;
-     identification of future improvements in performance; and
-     ensuring widespread circulation of best practices for ATM performance.
In order to allow easier access and to make information available more quickly, the PRC has
developed online reporting tools. More information on the PRC quarterly online ANS performance
review as well as information on studies, performance methodologies and data for monitoring ANS
performance in the EUROCONTROL area is available online at: http://www.ansperformance.eu/prcq.

PRR 2017- Chapter 1: Introduction                                                                     1
1.1.2    Report scope and structure
Unless otherwise indicated, PRR
2017 relates to the calendar year        EUROCONTROL 2016
                                         Comprehensive Agreement States
2017 and refers to ANS
performance in the airspace
controlled by the 41 Member                                                                             FI

States of EUROCONTROL (see                                                       NO   SE

Figure 1-1), here referred to as                                                                        EE

“EUROCONTROL area”.                                                                                          LV

                                                                                 DK                     LT

In 2016, EUROCONTROL signed                               IE
                                                                GB
                                                                                                 PL
comprehensive agreements with                                              NL
                                                                          BE     DE                                          UA
                                                                           LU              CZ
Israel and Morocco with a view to                                                          AT
                                                                                                   SK                   MD
                                                                                                   HU                                       GE
fully integrating both States into                                   FR         CH
                                                                                           SI HR
                                                                                                                  RO
                                                                                                                                                 AM

its working structures.                                                     MC
                                                                                      IT
                                                                                                 BA RS
                                                                                                   ME
                                                                                                                   BG
                                                                                                      MK                          TR
                                                                                                    AL
                                                    PT    ES
Work is still in progress in some                                                                            GR

areas (data collection and                                                                                                        CY

                                                                                            MT
validation) to fully include Israel                                                                                                    IL
                                                    MA
and      Morocco      in    future
performance reviews. Where
possible, they have been included                        Figure 1-1: EUROCONTROL States (2017)
in the PRR 2017 analyses.
PRR 2017 addresses the Key Performance Areas: Capacity, Cost Effectiveness, Efficiency,
Environmental sustainability and Safety.
It is organised in five chapters:

    Chapter 1- Introduction and context: General context including a high level
    review of air traffic demand and punctuality trends in the EUROCONTROL area.
    Furthermore, the chapter provides a high level comparison of the total ANS-
    related costs in 2008 and 2016 where traffic levels were similar. The chapter
    also addresses the environmental component of ANS performance.

    Chapter 2 – Safety: Review of Safety ANS performance in terms of accidents,
    ATM-related incidents and the level of safety occurrence reporting in the
    EUROCONTROL area.

    Chapter 3 - En-route ANS Performance: Review of operational en-route ANS
    performance (ATFM delays, en-route flight efficiency), including a detailed
    review of the most constraining ACCs in 2017.

    Chapter 4 - ANS Performance @ airports: Review of the operational ANS
    Performance of the top 30 airports in terms of traffic in 2017.

    Chapter 5 - ANS Cost-efficiency: Analysis of ANS cost-efficiency performance in
    2016 (the latest year for which actual financial data were available) and
    performance outlook, where possible.

PRR 2017 - Chapter 1: Introduction                                                                                                                    2
1.2                                European air transport key indices
Figure 1-2 shows the evolution of European air traffic indices1 between 2008 (the year with the
highest recorded traffic levels before the start of the economic crisis) and 2017.
The trend already                                                                                                                                                           Pan-European key air traffic indices
observed over the
past         years                                                                                      140                                                                                                                                                                      change vs. 2016 (%)
continued also in                                                                                       135                                                                                                                                                                     +8.5% Passengers (ACI)
2017.                                                                                                   130                                                                                                                                                                     +6.2% En-route Service Units

Air traffic in the                                                                   Index 100 = 2008   125                                                                                                                                                                           (CRCO area)
                                                                                                        120
Pan-European area                                                                                                                                                                                                                                                               + 1.4% Avg. weight (MTOW)
                                                                                                        115
continued          to                                                                                   110
                                                                                                                                                                                                                                                                                + 5.4% Flight hours (ECAC)
increase for the                                                                                        105                                                                                                                                                                     + 4.3% IFR flights (ECAC)
fourth year in a row                                                                                    100
in     2017      and                                                                                     95
exceeded          the                                                                                    90
previously highest
                                                                                                              2008

                                                                                                                                        2009

                                                                                                                                                   2010

                                                                                                                                                                       2011

                                                                                                                                                                                      2012

                                                                                                                                                                                                                 2013

                                                                                                                                                                                                                                2014

                                                                                                                                                                                                                                                           2015

                                                                                                                                                                                                                                                                  2016

                                                                                                                                                                                                                                                                         2017
                                                                                                                                                                                                                                                                                              Sources: ACI; STATFOR;
level of 2008.                                                                                                                                                                                                                                                                                CRCO

                                       Figure 1-2: European air traffic indices (2008-2017)
In 2017, the number
of flights increased
by 4.3%2 (2.5% in 2016) in the ECAC area3 which corresponds to an additional 1,191 flights per day on
average. The observed traffic growth corresponds to the high forecast scenario of +4.3% predicted by
STATFOR for 2017 in the 7-year forecast [2].
As in previous years, flight hours (+5.4% vs. 2016) and distance (+5.7% vs. 2016) grew at a higher rate
than the number of flights which, together with the further increase of the average take-off weight
(+1.4% vs. 2016), led to a higher en-route service unit4 growth in 2017 (+6.2% vs. 2016).
Figure 1-3 shows the change in terms of flight type, traffic segment, flight distance and flight hours
compared to 2016. As was the case in 2016, the main driver of the observed traffic growth in 2017
was the growth in the intra-European low cost traffic segment (STATFOR definition).

                               change vs. 2016 by flight type                                                                           change vs. 2016 by traffic segment (STATFOR)                                                                                               change vs. 2016
                            800                                                                                                          600
                                    3.0%                                                                                                             5.8%
                                                                                                                                              3.0%                                                                                                                              IFR flights
                            600                     9.5%                                                                                 400
    Average daily flights

                                                                                                                                                                                                                                                                         10.6 M (+4.3% )
                                                                                                                Average daily flights

                            400
                                                                                                                                         200                                      9.2% 6.2% 8.1%                                                                                               Avg. flight duration
                            200
                                                                      6.1%                                                                     0                                                                                                                                                98.4min (+1.1%)
                              0                                                                                                                                                                                                 -0.8%
                                                                                                                                        -200                                                                                                                                Flight hours                      Avg. flight length
                            -200
                                                                                                                                                                                                                                                                          17.4 M (+5.1% )                    1,197 km (+1.7%)
                            -400                                                                                                        -400
                                                                                                                                                                                             Business Aviation
                                                                                                                                                                       Low-Cost

                                                                                                                                                                                   Charter

                                                                                                                                                                                                                        Cargo
                                                                                                                                                     Trad. Scheduled

                                                                                                                                                                                                                                  Other (incl. military)
                                                     From/to Europe

                                                                       Overflights
                                     Pan-European

                                                                                                                                                                                                                                                                                                  Avg. speed
                                                                                                                                                                                                                                                                                               729 Km/h (+0.6%)

                                                                                                                                                                                                                                                                           Flight distance
                                                                                                                                                                                                                                                                         12 684 M (+5.7% )

                     Source: STATFOR
                                                                                                               Figure 1-3: Year on year change versus 2016

1
                               Note that the individual indices can refer to slightly different geographical areas.
2
                               Leap year effect was taken into account.
3
                               The European Civil Aviation Conference (ECAC) is an intergovernmental organization which was established by
                               ICAO and the Council of Europe. ECAC now totals 44 members, including all 28 EU, 31 of the 32 European
                               Aviation Safety Agency member states, and all 41 EUROCONTROL member states.
4
                               Used for charging purposes based on aircraft weight factor and distance factor.

PRR 2017 - Chapter 1: Introduction                                                                                                                                                                                                                                                                                             3
Figure 1-4 shows the evolution of IFR flights in the ECAC area since 2008 together with selected
traffic forecasts5. The latest STATFOR 7-year forecast [3] predicts flights in the ECAC area to grow by
3.3% in 2018 (Low: 2.1%; High 4.6%).
The average annual growth                                                                                        14                                                                                                                               8%
rate (AAGR) between 2018                                                                                                                           IFR Flights in 2017: 10.6 M (+4.3%) 
                                                                                                                                                                                                                                                  6%
                                                                                                                 13
and 2024 is forecast to be at
                                                                                                                                                                                                                                                  4%
2.3% (baseline).

                                                                                                                                                                                                                                                                                                  yearly growth (%)
                                                                                                                 12

                                                                                        IFR flights (Millions)
                                                                                                                        Feb. 2008
                                                                                                                                                                                                                                                  2%
By 2024, the number of                                                                                                   forecast
flights in the ECAC area will                                                                                    11                                                                                                                               0%
                                                                                                                                                                                                              STATFOR (Feb. 2018)
increase by 17% compared                                                                                                                                                                                        7-year forecast                   -2%
                                                                                                                 10
to 2017, reaching a total of                                                                                                                Feb. 2011              Feb. 2014                                                                      -4%
12.4       million    flights,                                                                                   9
                                                                                                                                             forecast               forecast

according to the base                                                                                                                                                                                                                             -6%

forecast scenario.                                                                                               8                                                                                                                                -8%

                                                                                                                                     2010

                                                                                                                                                                  2014

                                                                                                                                                                                                                     2021
                                                                                                                       2008
                                                                                                                              2009

                                                                                                                                            2011
                                                                                                                                                    2012
                                                                                                                                                           2013

                                                                                                                                                                         2015
                                                                                                                                                                                2016
                                                                                                                                                                                         2017
                                                                                                                                                                                                2018
                                                                                                                                                                                                       2019
                                                                                                                                                                                                              2020

                                                                                                                                                                                                                            2022
                                                                                                                                                                                                                                   2023
                                                                                                                                                                                                                                          2024
However      the    expected
growth is not evenly                                                                                                                                                                               Source : EUROCONTROL/STATFOR (ECAC)

distributed across the ECAC                                                                                                   Figure 1-4: Evolution of European IFR flights (2008-2024)
area.
Figure 1-5 shows an outlook of the forecast traffic growth over the next seven years by State
according to the STATFOR baseline scenario [3]. The bars show the estimated number of additional
daily flights in 2024 and the dots indicate the annual average growth rate between 2018 and 2024.

                                             1800                                                                                                                                                                                            7%

                                                                                                                                                                                                                                                   Estimated average annual grrowth (2018-2024)
Estimated additional daily flights in 2024

                                             1600
                                                                                                                                                                                                                                             6%
                                             1400
                                                                                                                5.9%

                                                                                                                                                                                                                                             5%
          (baseline scenario)

                                                                                                            5.3%
                                                                                                           5.2%

                                             1200
                                                                                                         4.9%

                                                                                                      4.5%

                                                                                                      4.5%
                                             1000                                                                                                                                                                                            4%
                                                                                                 3.8%
                                                                                                3.7%
                                                                                               3.6%

                                              800
                                                                                              3.5%

                                                                                              3.5%
                                                                                                                                                                                                                                             3%
                                                                                             3.4%

                                                                                             3.4%

                                                                                             3.4%

                                                                                             3.4%
                                                                                            3.3%

                                                                                            3.3%

                                                                                            3.3%
                                                                                            3.3%

                                              600
                                                                                        2.8%

                                                                                        2.8%
                                                                                       2.6%

                                                                                       2.6%

                                                                                      2.5%

                                                                                                                                                                                                                                             2%
                                                                                     2.4%

                                                                                     2.4%
                                                                                    2.3%

                                                                                    2.3%
                                                                                   2.2%

                                              400
                                                                                  2.0%
                                                                                 1.9%
                                                                                1.8%

                                                                                1.8%

                                                                                1.8%
                                                                               1.6%

                                                                               1.6%
                                                                              1.5%

                                                                                                                                                                                                                                             1%
                                                                             1.4%

                                              200
                                                                   Norway 1.1%

                                               0                                                                                                                                                                                             0%
                                                                    France

                                                                   Croatia

                                                                   Albania
                                                                    Austria

                                                                 Romania

                                                              Switzerland
                                                       Spain (continental)

                                                                    Greece
                                                                  Sweden

                                                                    Cyprus

                                                                  Slovenia

                                                                      Latvia
                                                           Czech Republic
                                                                  Slovakia
                                                                   Georgia
                                                                   FYROM

                                                                   Finland
                                                                  Armenia

                                                                 Moldova
                                                                 Germany

                                                                         UK

                                                                       Italy
                                                    Belgium/Luxembourg

                                                                   Ukraine
                                                     Serbia&Montenegro

                                                                 Lithuania

                                                                    Ireland
                                                                 Denmark

                                                                      Malta
                                                              Netherlands

                                                                  Hungary

                                                                    Poland

                                                                  Bulgaria

                                                                   Estonia
                                                                    Turkey

                                                      Bosnia-Herzegovina

                                                    Spain (Canary Islands)
                                                     Portugal (Lisbon FIR)

                                                       Est. add. daily flights (2024)                                 Avg. annual growth rate (2017-2024)                              ECAC avg. annual growth rate (2017-2024)
                                                                                                                                                                                       Source : EUROCONTROL/STATFOR (Feb. 2018)

                                                                                    Figure 1-5: Forecast traffic growth 2018-2024

In absolute terms, Turkey is predicted to have the highest number of additional daily flights in 2024,
followed by Germany and France. The highest average annual growth rates between 2018 and 2024
are forecast for Cyprus (5.9%), Georgia (5.3%), Ukraine (5.2%) and Turkey (4.9%).
Traffic growth at Air Navigation Service Provider (ANSP) and Area Control Centre (ACC) level is
analysed in more detail in Chapter 3. The traffic growth at airport level is analysed in more detail in
Chapter 4.

5
                                             STATFOR 2008 forecast (before the economic crisis), STATFOR 2011 forecast (before the start of the SES
                                             performance scheme), and the latest available STATFOR Sep. 2017 forecast.

PRR 2017 - Chapter 1: Introduction                                                                                                                                                                                                                                                4
Traffic variability can also affect performance if not addressed with appropriate measures. It can be
characterised as temporal (seasonal, daily, hourly) and spatial (location of traffic in an airspace)
variability.
Figure 1-6 compares the peak day to              36

                                                       Average daily flights ('000)
                                                 34                                                     Difference
the average daily number of flights at                                                                  Peak vs
system level. Peak traffic load                  32                                                     Avg. (%)
continued to rise in 2017 and reached            30
the highest level of traffic on record so        28                                                     Average
far on June 30th 2017 (35 251 flights).          26
                                                                                                        daily IFR
                                                                                                        flights
The peak day in 2017 was 23.8% higher            24

                                                                                                                                                                              24.7%

                                                                                                                                                                                      25.2%

                                                                                                                                                                                                  23.9%

                                                                                                                                                                                                          24.4%

                                                                                                                                                                                                                     23.8%
                                                                                                                   23.8%

                                                                                                                               20.4%

                                                                                                                                         23.8%

                                                                                                                                                       23.6%

                                                                                                                                                               23.8%
than an average day.                             22                                                     Peak day
                                                 20                                                     IFR flights
Figure 1-7 shows the traffic variation by

                                                                                                                  2008
                                                                                                                  2009
                                                                                                                  2010
                                                                                                                  2011
                                                                                                                  2012
                                                                                                                  2013
                                                                                                                  2014
                                                                                                                  2015
                                                                                                                  2016
                                                                                                                  2017
day of the week at EUROCONTROL
level in 2017. At system level, traffic
                                                                                               Source: PRU analysis
levels were lowest on weekends and
the highest levels were observed on            Figure 1-6: Evolution of daily traffic levels (EUROCONTROL)
Fridays and Thursdays.
If traffic is highly variable and there is
                                                                                                                  Traffic levels by day of the week (2017)
                                                 change compared to avg. day (%)

limited flexibility to adjust the capacity                                                                10%                                                                                             7.1%
provision according to actual traffic                                                                                                                                                 5.1%
                                                                                                           5%         2.3%                                     2.5%
demand, the result may be poor                                                                                                            0.1%
service quality or an underutilisation                                                                     0%
of resources. If addressed proactively,                                                                   -5%
traffic variability can be mitigated or                                                                                                                                                                                                 -5.3%
resolved to a certain degree by                                                                           -10%
utilising previous experience. If                                                                                                                                                                                        -11.7%
                                                                                                          -15%
                                                                                                                                             TUESDAY

                                                                                                                                                                                       THURSDAY

                                                                                                                                                                                                                                         SUNDAY
                                                                                                                           MONDAY

                                                                                                                                                                                                                             SATURDAY
                                                                                                                                                                  WEDNESDAY

                                                                                                                                                                                                           FRIDAY
demand is higher on weekends than
on weekdays, then it is possible to
roster staffing levels to suit.
It is acknowledged that the local                                                                            Figure 1-7: Traffic levels by day of the week (2017)
traffic     variability     can      differ
significantly compared to the system                                                                              Traffic complexity over time (EUROCONTROL area)
level. Traffic variability at local level is
addressed in more detail in Chapter 3.                                                                      8.0
                                                                Minutes of interactions per flight hour

                                                                                                                                       Complexity score (month)
                                                                                                            7.5
Although the relationship between                                                                                                      Complexity score (year)
                                                                                                            7.0
“traffic   complexity”     and     ANS
performance in general is not                                                                               6.5
straightforward, complexity is a factor                                                                     6.0
to be taken into account when                                                                               5.5
analysing ANS performance.
                                                                                                            5.0
Figure 1-8 shows the evolution of                                                                           4.5
complexity in the EUROCONTROL area                                                                          4.0
between 2008 and 2017. The monthly                                                                                JAN JAN JAN JAN JAN JAN JAN JAN JAN JAN
trend line (brown) shows a seasonal                                                                               2008 2009 2010 2011 2012 2013 2014 2015 2016 2017
pattern with the highest level of                                                                                                                                                                                   Source: EUROCONTROL/PRU
complexity in summer.                                                                                         Figure 1-8: Complexity over time (EUROCONTROL)

Traffic complexity at system level has been increasing continuously since 2013 which corresponds
with the observed increase of traffic during the same time.
High density (concentration of traffic in space and time) can lead to a better utilisation of resources
but a high structural complexity (intensity of potential interactions between traffic) entails higher
ATCO workload and potentially less traffic. Similarly, if demand is higher during certain periods, for
example July and August, then it is possible to make more operational staff available by reducing

PRR 2017 - Chapter 1: Introduction                                                                                                                                                                                                                5
You can also read