PSYCHOMETRIC PROPERTIES OF THE "QUALITY OF INSTRUCTION" SCALE IN STARTING COHORT 3 - ANNA HAWROT NEPS SURVEY PAPERS - LIFBI
←
→
Page content transcription
If your browser does not render page correctly, please read the page content below
NEPS SURVEY PAPERS

Anna Hawrot
PSYCHOMETRIC
PROPERTIES OF THE
"QUALITY OF
INSTRUCTION" SCALE
IN STARTING COHORT 3

NEPS Survey Paper No. 81
Bamberg, February 2021
Survey Papers of the German National Educational Panel Study (NEPS)
at the Leibniz Institute for Educational Trajectories (LIfBi) at the University of Bamberg

The NEPS Survey Paper series provides articles with a focus on methodological aspects and data
handling issues related to the German National Educational Panel Study (NEPS).

They are of particular relevance for the analysis of NEPS data as they describe data editing and data
collection procedures as well as instruments or tests used in the NEPS survey. Papers that appear in
this series fall into the category of 'grey literature' and may also appear elsewhere.

The NEPS Survey Papers are edited by a review board consisting of the scientific management of LIfBi
and NEPS.

The NEPS Survey Papers are available at www.neps-data.de (see section “Publications“) and at
www.lifbi.de/publications.

Editor-in-Chief: Thomas Bäumer, LIfBi

Review Board: Board of Directors, Heads of LIfBi Departments, and Scientific Management of NEPS
Working Units

Contact: German National Educational Panel Study (NEPS) – Leibniz Institute for Educational
Trajectories – Wilhelmsplatz 3 – 96047 Bamberg − Germany − contact@lifbi.de
Psychometric Properties of the “Quality of Instruction” Scale
                                 in Starting Cohort 3

                                      Anna Hawrot
           Leibniz Institute for Educational Trajectories, Bamberg, Germany

E-mail address of lead author
anna.hawrot@lifbi.de

Bibliographic data:
Hawrot, A. (2021). NEPS Technical Report for Teaching Quality: Psychometric Properties of the
“Quality of Instruction” Scale in Starting Cohort 3 (NEPS Survey Paper No. 81). Leibniz Institute
for      Educational       Trajectories,      National       Educational     Panel        Study.
https://doi.org/10.5157/NEPS:SP81:1.0

NEPS Survey Paper No. 81, 2021
Hawrot Psychometric Properties of the “Quality of Instruction” Scale in Starting Cohort 3 Abstract This paper presents information on the source, theoretical background, and psychometric properties of the “Quality of instruction” scale used in Waves 3 and 5 of Starting Cohort 3. The scale measures student perceptions of teaching quality in their school. We ran an item-level analysis and checked the scale’s reliability, discriminant validity, construct validity, and measurement invariance over the waves. The items had moderate to high discriminatory power. The analyses confirmed the scale’s discriminant validity and its expected three-factor structure, but also revealed moderate to strong correlations between the factors. The internal consistencies of the subscales ranged from marginally acceptable for Classroom Management and Cognitive Activation to satisfactory for Student Support. The scale was metrically invariant across the two waves of the study. Overall, the test showed acceptable to good psychometric properties, depending on the aspect. Keywords psychometric properties, quality of instruction, Three Basic Dimensions Acknowledgments This paper uses data from the National Educational Panel Study (NEPS): Starting Cohort 3 (doi:10.5157/NEPS:SC3:7.0.0). From 2008 to 2013, NEPS data was collected as part of the Framework Program for the Promotion of Empirical Educational Research funded by the German Federal Ministry of Education and Research (BMBF). As of 2014, NEPS is carried out by the Leibniz Institute for Educational Trajectories (LIfBi) at the University of Bamberg in cooperation with a nationwide network. NEPS Survey Paper No. 81, 2021 Page 2
Hawrot

1. Introduction
The National Educational Panel Study (Blossfeld et al., 2011) aims at tracking the development
of various competencies, describing their patterns, and better understanding how they unfold
across the lifespan. To this end, information is gathered about various potential sources of
influence, including the home environment, educational institutions, or the workplace.
However, all these factors need to be measured in a stage-sensitive way, that is, in a way that
is adjusted to the participants’ age as well as to their developmental and educational stage.

Teaching quality is considered one of the key factors affecting student learning and
engagement in school learning environments (e.g., Hattie, 2009; Seidel & Shavelson, 2007).
As a result, in the study, teaching quality was measured from both the teacher and student
perspective.

This paper presents information on the source, theoretical background, and psychometric
properties of the scale used in Waves 3 and 5 of Starting Cohort 3 (SC3) to assess student
perceptions of teaching quality in their school (the “Quality of instruction” scale). Its goal is to
document the scale and provide data users with basic information necessary to make an
informed decision about use of the scale in analyses based on the NEPS data or in their own
research.

2. Description of the Scale
The “Quality of instruction” scale consists of nine items divided into three 3-item subscales for
Cognitive Activation, Student Support, and Classroom Management. Subjects are asked to rate
to what extent each item reflects their in-school experience using a four-point scale. The
response options are labeled as follows: 1 = does not apply at all, 2 = does rather not apply, 3
= does rather apply, 4 = applies completely. The items come from various scales used in the
German edition of PISA 2000 (Kunter et al., 2002) and were adapted and pooled together to
form subscales reflecting three generic dimensions of teaching quality according to the model
of Three Basic Dimensions (Praetorius et al., 2018).

According to this model, Classroom Management is a prerequisite for learning and refers to
an orderly and disruption-free classroom environment with clear rules and expectations.
Student Support captures whether students are provided with assistance with learning that is
adjusted to their individual needs and interests. Cognitive Activation refers to promoting
conceptual understanding in class and to stimulating higher-order thinking (Praetorius et al.,
2018). However, unlike in the model, the scale refers to the perceived teaching quality in the
whole school instead of to the perceived teaching quality of a specific subject or a single
teacher. Table 1 contains the item wording and the corresponding variable names used in the
Scientific Use Files (SUF). The original German-language wording is available on the project’s
website (www.neps-data.de).

NEPS Survey Paper No. 81, 2021                                                                Page 3
Hawrot

Table 1

Items of the “Quality of instruction” Scale

    Variable                     When you consider your classes at school in general, to what extent do
             Subscale
    name                         the following statements apply?

                                 a) In class we often do exercises that show if we’ve really understood
    t22550a CA
                                 something.

    t22350b CM                   b) Everything we do is carefully planned.

                                 c) When we do exercises in class, we often apply what we have learned
    t22550c CA
                                 to other things.

    t22450d SS                   d) Most teachers are good at explaining things.

    t22450e SS                   e) Our teachers talk to us if there is something we don’t like.

    t22450f SS                   f) If I need more help, I get it from my teachers.

    t22350g CM                   g) In class, there are clear rules that we have to follow.

                                 h) The exercises we do in class are similar, yet always different, so I have
    t22550h CA
                                 to pay close attention.

    t22350i      CM              i) In class, there are clear instructions on what we have to do.
Note. CA = Cognitive Activation; CM = Classroom Management; SS = Student Support.

3. Method

3.1 Data and Sample
We used data gathered in the National Educational Panel Study (NEPS, Blossfeld et al., 2011)
from Starting Cohort 3 (SC3). In subsequent waves, selected students attending sampled
schools were surveyed multiple times as target persons. Table 2 contains information about
the waves and grades in which the scale was administered to students as well as the sample
sizes. Please note that the scale was not administered to students attending special needs
schools. Moreover, the samples include students who responded to at least one item of the
scale; thus, the number of students who filled in at least one item in the whole questionnaire
may be different.

The “Quality of instruction” scale was administered twice, in Wave 3 (school year 2012/13)
and in Wave 5 (school year 2014/15), as a part of a larger questionnaire using the standard
testing procedure for a wave. Information on the procedure is available in the data manual
(Skopek et al., 2012) and interviewer manual1.

1   https://www.neps-data.de/Data-Center/Data-and-Documentation/Starting-Cohort-Grade-5/Documentation

NEPS Survey Paper No. 81, 2021                                                                          Page 4
Hawrot
Additionally, we used four items from the “Generalized attitude towards education” scale2 (α
= .723, SC3, Wave 5) and ratings of “being satisfied with school”3 (one item, SC3, Waves 3 and
5) to check the scale’s discriminant validity.
Table 2
The Scale Administration in Starting Cohort 3
Wave 1 2 3 4 5 6 7 8
Grade 7 9
Sample size 6500 5550
3.2 Analytical Procedure
In the first step, we analyzed missing response rates per person and per item. Next, we
inspected item distributions to identify potential problems with response scales, for instance,
range restrictions as well as items’ discriminatory power (item-rest correlations). We also
checked the scale’s discriminant validity by calculating Pearson correlations between its
manifest scores and two measures of student attitudes towards school.
The third step involved analyzing the construct validity of the scale. It was divided into several
sub-steps: first, confirmatory factor analyses (CFA) were performed for each wave separately;
then, measurement invariance of the most optimal measurement model over the waves was
tested. Please note that samples in subsequent waves overlapped and, as a consequence,
longitudinal invariance was tested. We used the specifications developed by Liu et al. (2017)
and tested factor loadings and thresholds separately (Muthén & Muthén, 1998-2017). This
approach has been used in other studies as well (e.g., Guay et al., 2015; McLarnon & Carswell,
2013). However, some researchers argue that loadings and thresholds should be freed in
tandem because they simultaneously influence the item characteristic curve (Muthén &
Muthén, 1998-2017). The models were compared using the DIFFTEST procedure (Muthén &
Muthén, 1998-2017). We did not use ΔAFIs for comparison purposes because they are not
recommended with the WLSMV estimator (Sass et al., 2014), which was used in all of the
analyses. The two last steps consisted of conducting reliability analyses and inspecting the
factor score distributions.
The confirmatory and exploratory factor analyses were performed with Mplus 8.2 (Muthén &
Muthén, 1998-2017) using theta parameterization and the WLSMV estimator. This estimator
is recommended for ordered categorical data, especially when item response distributions are
skewed and the number of response categories is small (e.g., Beauducel & Herzberg, 2006;
Flora & Curran, 2004). The scales of the CFA factors were set by fixing one factor loading to
unity. All of the models accounted for the non-independence of students clustered within
schools by adjusting to the standard errors using a sandwich estimator (CLUSTER option). If
the institution identification number (ID_i) was missing for a student followed individually, the
2
Items t31300e, t31300f, t31300k, and t31300k.
3 Item t514006.
NEPS Survey Paper No. 81, 2021 Page 5Hawrot student was assigned a unique artificial institution ID. This allowed us to retain individually followed students in the sample. The model fit was assessed with three commonly used fit indices: the root mean square error of approximation (RMSEA), the comparative fit index (CFI), and the Tucker–Lewis index (TLI). We assumed that CFI and TLI values not lower than .95 and RMSEA values not higher than .06 indicated a good fit (Hu & Bentler, 1999). 4. Results 4.1 Missing Responses NEPS datasets include several codes for missing data. In this case, two types of missing value occurred: implausible values and unspecific missing values. Both types refer to nonresponse, with implausible values denoting invalid responses and unspecific missing values denoting nonresponse for which the cause is unknown. Table 3 contains information with the numbers and percentages of respondents with a given number of implausible values, unspecific missing values, and total missing values. The majority of missing values was unspecific. The number of implausible values per person was very low. In both waves, under 1% of students provided at least one implausible response and the number of implausible response only occasionally exceeded 1. The number of unspecific missing values per person was higher than the number of implausible values. The percentage of respondents in Wave 3 with at least one unspecific missing value equaled 7.1% and was twice as high as the percentage in Wave 5 (3.53%). The students most often omitted one item. A total of 87.5% and 84% of all unspecific omissions in Waves 3 and 5, respectively, were single-item omissions. The total missing values per person and the number of unspecific missing values per person hardly differed because of the low share of implausible values in the total missing values. Thus, the results for the total missing values are not described. Table 4 contains information about implausible, unspecific missing, and total missing values per item. Both waves featured some implausible values for all items, but their rates were very low and did not exceed 0.25%. Unspecific missing value rates per item were higher, but remained at a satisfactory level. They ranged from 0.2% (t22550a, Wave 5) to 2.63% (t22350b); however, they were visibly higher in Wave 3. In Wave 5, the rate of unspecific missing values was higher than 1% for one item, whereas in Wave 3 it was higher for 6 out of 9 items. Moreover, in Wave 3, items t22450f and t22350b showed visibly increased rates. The total missing values per item and the number of unspecific missing values per item hardly differed because of the low share of implausible values in the total missing values per item. As a consequence, the total missing values are not described. NEPS Survey Paper No. 81, 2021 Page 6
Hawrot

Table 3

Rates of Implausible, Unspecific and Total Missing Values per Person

                                    Wave 3           Wave 5
Number of missing
values per person
                                 Freq.     %     Freq.     %
Implausibe value
         0                   6444        99.14   5500    99.10
         1                   49          0.75    42      0.76
         2                   5           0.08    4       0.07
         3                   0           0       3       0.05
         4                   0           0       0       0
         5                   1           0.02    0       0
         6                   0           0       0       0
         7                   1           0.02    1       0.02
         Total               6500        100     5550    100
Unspecific missing
         0                   6038        92.89   5354    96.47
         1                   337         5.18    157     2.83
         2                   49          0.75    15      0.27
         3                   24          0.37    4       0.07
         4                   18          0.28    8       0.14
         5                   8           0.12    2       0.04
         6                   5           0.08    5       0.09
         7                   10          0.15    2       0.04
         8                   11          0.17    3       0.05
         Total               6500        100     5550    100
Total missing
         0                   5991        92.17   5310    95.68
         1                   373         5.74    190     3.42
         2                   56          0.86    21      0.38
         3                   25          0.38    6       0.11
         4                   18          0.28    10      0.18
         5                   9           0.14    2       0.04
           6                 6           0.09    5       0.09
           7                 11          0.17    3       0.05
           8                 11          0.17    3       0.05
           Total             6500 100            5550 100

NEPS Survey Paper No. 81, 2021                                         Page 7
Hawrot
Table 4
Rates of Implausible, Unspecific, and Total Missing Values per Item
SC3: W3 SC3: W5
Item
Freq. % Freq. %
Implausibe value
t22550a 6 0.09 6 0.11
t22350b 7 0.11 11 0.20
t22550c 4 0.06 6 0.11
t22450d 16 0.25 13 0.23
t22450e 9 0.14 8 0.14
t22450f 5 0.08 7 0.13
t22350g 7 0.11 7 0.13
t22550h 11 0.17 5 0.09
t22350i 6 0.09 3 0.05
Unspecific missing
t22550a 37 0.57 11 0.20
t22350b 171 2.63 24 0.43
t22550c 86 1.32 63 1.14
t22450d 58 0.89 25 0.45
t22450e 95 1.46 37 0.67
t22450f 129 1.98 49 0.88
t22350g 70 1.08 30 0.54
t22550h 98 1.51 43 0.77
t22350i 63 0.97 27 0.49
Total missing
t22550a 43 0.66 17 0.31
t22350b 90 1.38 35 0.63
t22550c 178 2.74 69 1.24
t22450d 74 1.14 38 0.68
t22450e 104 1.60 45 0.81
t22450f 134 2.06 56 1.01
t22350g 77 1.18 37 0.67
t22550h 109 1.68 48 0.86
t22350i 69 1.06 30 0.54
Note. SC3 = Starting Cohort 3; W = Wave.
NEPS Survey Paper No. 81, 2021 Page 8Hawrot In summary, the implausible value rates per item were very low. In conjunction with the very low rates per person, this result suggests that students did not experience major difficulties with using the scale’s response format. The unspecific missing value rates per item and per person were higher, particularly in Wave 3, but remained at a satisfactory level. However, in Wave 3, two items showed visibly increased rates. Note. W = Wave. Figure 1. Item response distributions. NEPS Survey Paper No. 81, 2021 Page 9
Hawrot

4.2 Item Distributions
 Figure 1 presents the item response distributions in both waves. Their analysis showed that
the distributions of several items were visibly skewed; see for example t22350g, t22550h,
t22350i. Moreover, although the respondents used all of the response categories, for six items
– t22550a, t22350b, t22550c, t22450d, t22350g, t22550h, t22350i – the lowest category was
rarely chosen rarely. Up to 3% of responses were recorded for this category.

4.3 Discriminatory Power
To assess the discriminatory power of the items, we calculated item-rest correlations within
each subscale. Their values were satisfactory in both waves, and the pattern of results was
consistent across the waves. The correlations ranged between .38 and .57; the lowest and the
highest values were scored for the items t22350b and t22450e, respectively. In general, the
discriminatory power of the items capturing Cognitive Activation and Classroom Management
was average and high (>= .5) for Student Support. The results are presented in Table 5.

Table 5

Item-Rest Correlations

                                          Wave 3          Wave 5
 Item
                                      n        rir    N        rir
 Cognitive Activation
     t22550a                        6457     .422    5533   .456
     t22550c                        6322     .415    5481   .425
     t22550h                        6391     .410    5502   .437
 Student Support
     t22450d                        6426     .516    5512   .491
     t22450e                        6396     .568    5505   .530
     t22450f                        6366     .559    5494   .509
 Classroom Management
     t22350b                        6410     .383    5515   .384
     t22350g                        6423     .413    5513   .416
     t22350i                        6431     .492    5520   .465
Note. rir = item-rest correlation

4.4 Discriminant Validity
Although developed to measure the quality of instruction in school as perceived by students,
this scale could in fact reflect students’ attitude towards school. Therefore, we calculated
correlations between the scale manifest scores and the manifest scores of two measures of
student opinion about schools: satisfaction with school (one item with 10 response categories)

NEPS Survey Paper No. 81, 2021                                                          Page 10
Hawrot and generalized attitude towards education (four items). Both measures were available in Wave 3 of SC3, but in Wave 5 students only reported their satisfaction with school. All coefficients were low, which provides support for the scale’s discriminant validity. The results are presented in Table 6. Table 6 Correlation Coefficients Between the Manifest Scores of the “Quality of instruction” Scale and the Manifest Scores of Measures of Student Opinion about School by Wave Construct CM SS CA Satisfaction with school (SC3, W3) .176 .227 .187 Satisfaction with school (SC3, W5) .147 .222 .178 Generalized attitude towards education (SC3, W3) .091 (.138) .040 (.055) .117 (.280) Note. CM = Classroom Management, SS = Student Support, CA = Cognitive Activation; SC3 = Starting Cohort 3, W = Wave. Values in parentheses are corrected for attenuation. 4.5 Internal Structure Next, we verified the measure’s internal structure. To increase the chances that the sample consisted of respondents who were committed to filling in the scale and provided valid responses, we excluded students who had more than two missing values (22%) in the scale. In the first step, we ran a confirmatory factor analysis for each wave separately to test whether the expected three-factor structure held. The models did not include any cross-loadings, but factors were allowed to correlate. The models showed a good fit (detailed information is presented in Table 7). The fit of the unidimensional model, with all items loading on a single factor, was significantly worse (W3: 2 (3) = 858.47, p < .001, W5: 2 (3) = 813.07, p < .001). Table 7 Fit of the Tested CFA Models Wave No. F. N Npar 2 df p RMSEA CFI TLI SRMR CFA W3 1 6420 36 1729.02 27 < .001 .099 .902 .869 .045 CFA W5 1 5521 36 1623.82 27 < .001 .103 .915 .887 .045 CFA W3 3 6420 39 513.36 24 < .001 .056 .972 .958 .025 CFA W5 3 5521 39 446.14 24 < .001 .056 .978 .966 .024 Note. No. F. = number of factors; W = Wave; Npar = number of parameters. The magnitude of the factor loadings was satisfactory. The loadings ranged between 0.586 and 0.746. In Waves 3 and 5, a total of five and four loadings, respectively, had a value of 0.70 or higher. The factor correlations were high and followed the same pattern in both waves. NEPS Survey Paper No. 81, 2021 Page 11
Hawrot

Classroom Management and Cognitive Activation correlated most strongly at a level of about
.9, followed by the correlation between Classroom Management and Student Support (about
.75), and Student Support and Cognitive Activation (about .7). Detailed information is
presented in Table 8.

Table 8

Standardized Factor Loadings and Factor Correlations in the Three-Factor CFA Models

                                Wave 3                                      Wave 5
 Item
                       CM             SS          CA              CM             SS          CA

 t22550a                                        0.671                                     0.699

 t22350b           0.708                                       0.712

 t22550c                                        0.584                                     0.628

 t22450d                          0.746                                      0.731

 t22450e                          0.734                                      0.708

 t22450f                          0.734                                      0.707

 t22350g           0.588                                       0.585

 t22550h                                        0.678                                     0.693

 t22350i           0.705                                       0.650

 SS                .740                         .736           .749                       .689

 CA                .926                                        .896
Note. All factor loadings and latent correlations a statistically significant at level
Hawrot Among all of the items, only one threshold had a positive value which suggests that the items covered low trait levels to a greater extent than high trait levels. This was particularly pronounced in the case of Classroom Management, in which the first and second thresholds of the three items had values not exceeding -1, with a sole exception which was the item t22350b in W3. Table 9 Item Thresholds in the Three-Factor CFA Models (Standardized Solution) Classroom Management Student Support Cognitive Activation Item Item Item $Threshold W3 W5 $Threshold W3 W5 $Threshold W3 W5 t22350b$1 -2.02 -2.86 t22450d$1 -1.77 -1.77 t22550a$1 -2.16 -2.03 t22350b$2 -0.72 -1.02 t22450d$2 -0.72 -0.55 t22550a$2 -1.04 -0.97 t22350b$3 1.01 1.61 t22450d$3 0.67 1.12 t22550a$3 0.83 1.15 t22350g$1 -2.26 -1.99 t22450e$1 -1.48 -1.55 t22550c$1 -2.02 -1.92 t22350g$2 -1.45 -1.03 t22450e$2 -0.37 -0.27 t22550c$2 -0.90 -0.69 t22350g$3 -0.07 0.51 t22450e$3 0.85 1.21 t22550c$3 0.70 1.09 t22350i$1 -2.14 -2.00 t22450f$1 -1.49 -1.60 t22550h$1 -2.05 -1.99 t22350i$2 -1.28 -1.00 t22450f$2 -0.46 -0.43 t22550h$2 -1.01 -0.75 t22350i$3 0.28 0.78 t22450f$3 0.78 1.07 t22550h$3 0.61 1.05 4.5.1 Longitudinal measurement invariance We checked the scale’s measurement invariance across the two waves of SC3. Although the Δ2 test indicated that constraining loadings worsened the fit, its value was relatively low. Based on this low value and the fact that the sample was very large, we concluded that there was enough evidence to assume metric invariance. However, scalar invariance did not hold. It was not possible to establish partial scalar invariance because of the large number of non- invariant indicators. For example, two out of three indicators of Classroom Management and Cognitive Activation were non-invariant. Detailed results are presented in Table 10. NEPS Survey Paper No. 81, 2021 Page 13
Hawrot
Table 10
Results of Testing Longitudinal Measurement Invariance over Waves 3 and 5
Model n Npar 2 df p RMSEA CFI TLI SRMR Δ2 (df), p
Configural 6801 96 797.83 111 < .001 .030 .981 .973 .022
2 (6) = 21.52, p =
Metric 6801 90 797.53 117 < .001 .029 .981 .975 .022
.001
2 (15) = 327.70, p <
Scalar 6801 75 1044.00 132 < .001 .032 .974 .970 .023
.001
Note. Configural = configural model; Metric = metric model (loadings constrained to equality across the waves); Scalar = scalar model
(loadings and thresholds constrained to equality across the waves).
4.6 Reliability
In the next step we assessed the reliability of the scale using information on the items’
explained variance, total information curves retrieved from the final CFA model, and
Cronbach’s α coefficients based on raw scores.
Table 11 presents the items’ explained variance in models for both waves. They differed
between the items and waves, ranging from .341 to .556. This indicates that a moderate
amount of the items’ variance was accounted for in the models. The items capturing the
Student Support factor had slightly higher explained variances (.50 or higher). Items t22550c
and t22350g had the lowest values in both waves (below .4)4.
Figure 2 presents the total information curves of the three factors in Waves 3 and 5. Their
shape supports the analysis of the items’ thresholds – the measurement precision of the scales
was lowest at high trait levels, although the pattern of results differed between the factors. A
downward trend was visible for Classroom Management; the measurement precision of
Student Support was relatively uniform across low and high trait levels, whereas the
measurement precision of Cognitive Activation dropped at mean to above-the-mean levels,
rose slightly, and dropped again at very high levels.
Table 12 contains information on the internal consistency of the scale. Cronbach’s αs ranged
between .61 and .73 and were highest for the Student Support subscale. The Classroom
Management and Cognitive Activation subscales showed values of about .6. These values are
low, although such low values are common in short scales.
4
Please note that all calculations were performed using the WLSMV estimator and therefore based on the
polychoric correlation matrix. As a consequence, the explained variances refer to continuous underlying
response variables instead of to categorical observed response variables.
NEPS Survey Paper No. 81, 2021 Page 14Hawrot
Table 11
Items’ Explained Variances in the Three-Factor CFA Models
Item Wave 3 Wave 5
Classroom Management
t22350b .501 .508
t22350i .496 .422
t22350g .346 .343
Student Support
t22450d .556 .534
t22450e .539 .502
t22450f .539 .500
Cognitive Activation
t22550a .450 .489
t22550c .341 .394
t22550h .459 .480
Table 12
Cronbach’s α coefficients for the subscales
Subscale Wave 3 Wave 5
CM .607 .630
SS .729 .697
CA .620 .613
Note. CM = Classroom Management; SS = Student Support; CA = Cognitive Activation.
NEPS Survey Paper No. 81, 2021 Page 15Hawrot
Total Information Total Information Total Information
0,0
0,5
1,0
1,5
2,0
2,5
3,0
3,5
4,0
0,0
0,5
1,0
1,5
2,0
2,5
3,0
3,5
4,0
0,0
0,5
1,0
1,5
2,0
2,5
3,0
3,5
4,0
-3,00 -3,00 -3,00
-2,74 -2,79 -2,81
-2,57 -2,60
-2,53
NEPS Survey Paper No. 81, 2021
-2,36 -2,40
-2,17 -2,14 -2,20
-1,96 -2,00
-1,93
-1,80
-1,63 -1,71 -1,60
-1,37 -1,50 -1,40
-1,29 -1,20
-1,09
-1,07 -1,00
-0,78 -0,86 -0,80
-0,54 -0,64 -0,60
CM, W3
CA, W3
SS, W3
-0,43 -0,40
-0,20 -0,20
-0,21
0,18 0,20
0,21
Figure 2. Total information curves of the CFA factors.
0,39 0,40
0,43 0,60
SS, W5
0,72 0,64
CA, W5
0,80
CM, W5
0,98 0,86 1,00
1,07 1,20
1,27
Note. CM = Classroom Management, SS = Student Support, CA = Cognitive Activation, W = Wave.
1,29 1,40
1,56 1,50 1,60
1,81 1,71 1,80
2,00
2,15 1,93
2,20
2,35 2,14
2,40
2,36 2,60
2,71
2,57 2,81
2,93 2,79 3,00
3,00 3,00
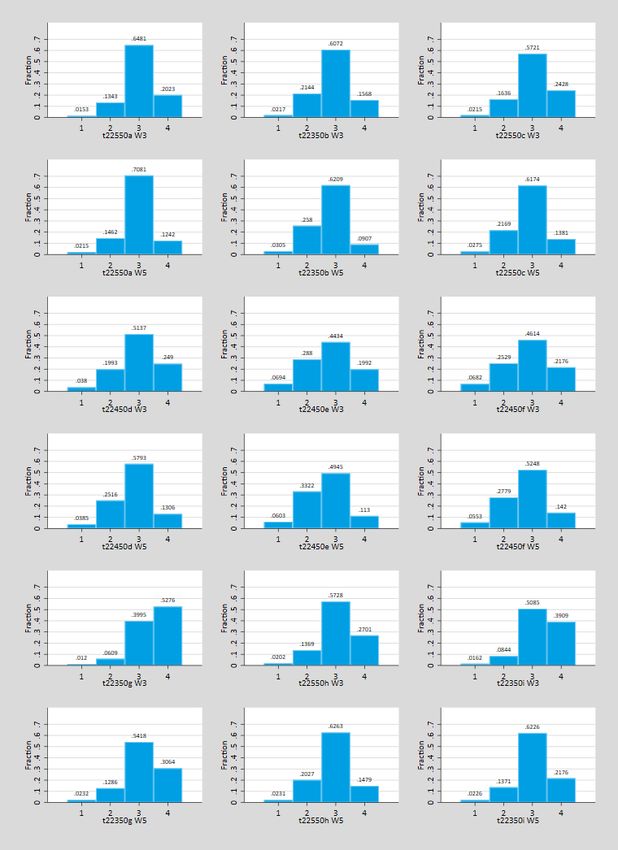
Page 16Hawrot 4.7 Factor Score Distributions Figure 3 presents the distributions of the factor scores derived from the final CFA models. Although some deviation from normality is present, there is no heavy skewing. However, the distributions are light-tiled compared to the normal distribution and show ceiling effects, particularly in Wave 3. This result supports the analysis of the items’ thresholds, which suggests that the items might not fully cover higher trait levels. Descriptive statistics are available in the Appendix (Table 1A). Note. CM = Classroom Management; SO = Student Support; CA = Cognitive Activation. The suffixes added to the abbreviations refer to waves. Figure 3. Distributions of the factor scores derived from the three-factor CFA models. NEPS Survey Paper No. 81, 2021 Page 17
Hawrot

5. Summary
This paper documents the “Quality of instruction” scale used in Starting Cohort 3 to assess
student perceptions of teaching quality in their school. Besides providing information about
the scale’s source and theoretical background, it reports basic information about its
psychometric properties.

The “Quality of instruction” scale was administered in Waves 3 and 5 to 6,500 and 5,550
students, respectively. The rates of missing values per item and per person were acceptable
in both waves, although higher in Wave 3. Less than 1% of students provided at least one
implausible response, and up to 3.5% of students in Wave 3 and 7.1% in Wave 5 omitted one
item. However, the omission rates for items t22350b (2.6%) and t22450f (1.98%) were higher
in Wave 3 compared to the other items. The item response distributions of several items were
skewed, and the percentages of responses were very low for six items (below 3%) for the
lowest response category. The items’ discriminatory power was satisfactory – their item-rest
correlations within subscales varied between .38 and .57. The subscales showed weak
correlations with two measures of student attitude towards school, which supports their
discriminant validity.

The three-factor CFA model, which represented the expected internal structure, fitted the
data well. However, the model was only metrically invariant across the two waves. It was not
possible to establish partial scalar invariance due to the large number of non-invariant items.
The items covered lower and average trait levels to a greater extent than high trait levels.
However, as the subscales were very short (three items each), we deem the result satisfactory.

The subscales’ reliabilities, as measured by Cronbach’s α, were acceptable for the Student
Support subscale (about .7), but only marginally acceptable for the other subscales (about .6).
However, the subscales consisted of three items only, and the coefficient we used is sensitive
to the number of items. The items’ explained variances ranged between .34 and .57, indicating
that the underlying response variables provided a moderate amount of information about the
measured latent variables. The measurement precision of the scales was lowest at very high
trait levels; however, the pattern differed between factors.

NEPS Survey Paper No. 81, 2021                                                          Page 18
Hawrot

References

Beauducel, A., & Herzberg, P. Y. (2006). On the performance of maximum likelihood versus

         means and variance adjusted weighted least squares estimation in CFA. Structural

         Equation Modeling, 13(2), 186–203.

Blossfeld, H.-P., Rossbach, H.-G., & von Maurice, J. (Eds.). (2011). Education as a Lifelong

         Process—The German National Educational Panel Study (NEPS). [Special Issue]

         Zeitschrift fuer Erziehungswissenschaft, 14.

Flora, D. B., & Curran, P. J. (2004). An empirical evaluation of alternative methods of

         estimation for confirmatory factor analysis with ordinal data. Psychological Methods,

         9(4), 466–491. https://doi.org/10.1037/1082-989X.9.4.466

Guay, F., Morin, A. J. S., Litalien, D., Valois, P., & Vallerand, R. J. (2015). Application of

         exploratory structural equation modeling to evaluate the Academic Motivation Scale.

         The Journal of Experimental Education, 83(1), 51–82.

         https://doi.org/10.1080/00220973.2013.876231

Hattie, J. (2009). Visible learning: A synthesis of over 800 meta-analyses relating to

         achievement. Routledge.

Hu, L., & Bentler, P. M. (1999). Cutoff criteria for fit indexes in covariance structure analysis:

         Conventional criteria versus new alternatives. Structural Equation Modeling: A

         Multidisciplinary Journal, 6(1), 1–55. https://doi.org/10.1080/10705519909540118

Kunter, M., Schümer, G., Artelt, C., Baumert, J., Klieme, E., Neubrand, M., Prenzel, M.,

         Scheifele, U., Schneider, W., Stanat, P., Tillmann, K.-J., & Weiß, M. (2002). PISA 2000:

         Dokumentation der Erhebungsinstrumente. Max-Planck-Inst. für Bildungsforschung.

NEPS Survey Paper No. 81, 2021                                                                   Page 19
Hawrot
Liu, Y., Millsap, R. E., West, S. G., Tein, J.-Y., Tanaka, R., & Grimm, K. J. (2017). Testing
measurement invariance in longitudinal data with ordered-categorical measures.
Psychological Methods, 22(3), 486–506. https://doi.org/10.1037/met0000075
McLarnon, M. J. W., & Carswell, J. J. (2013). The personality differentiation by intelligence
hypothesis: A measurement invariance investigation. Personality and Individual
Differences, 54(5), 557–561. https://doi.org/10.1016/j.paid.2012.10.029
Muthén, L. K., & Muthén, B. O. (1998). Mplus user’s guide. Eighth edition. Muthén &
Muthén.
Praetorius, A.-K., Klieme, E., Herbert, B., & Pinger, P. (2018). Generic dimensions of teaching
quality: The German framework of Three Basic Dimensions. ZDM, 50(3), 407–426.
https://doi.org/10.1007/s11858-018-0918-4
Sass, D. A., Schmitt, T. A., & Marsh, H. W. (2014). Evaluating model fit with ordered
categorical data within a measurement invariance framework: A comparison of
estimators. Structural Equation Modeling: A Multidisciplinary Journal, 21(2), 167–
180. https://doi.org/10.1080/10705511.2014.882658
Seidel, T., & Shavelson, R. J. (2007). Teaching effectiveness research in the past decade: The
role of theory and research design in disentangling meta-analysis results. Review of
Educational Research, 77(4), 454–499. https://doi.org/10.3102/0034654307310317
Skopek, J., Pink, S., & Bela, D. (2012). Data manual. Starting Cohort 3—From lower to upper
secondary school. NEPS SC3 1.0.0 (NEPS Research Data Paper). University of
Bamberg.
NEPS Survey Paper No. 81, 2021 Page 20Hawrot
Appendix
Table 1A
Descriptive Statistics for Factor Scores Derived from the Three-Factor CFA Models
Factor Mean p50 SD Var Skew Kurt p25 p75 Min Max
Wave 3
CM
-0.008 -0.085 0.874 0.764 -0.028 0.525 -0.569 0.560 -3.601 2.093
SS
-0.007 0.011 0.976 0.953 -0.053 0.282 -0.654 0.625 -3.502 2.232
CA
-0.007 -0.093 0.787 0.619 -0.010 0.592 -0.505 0.497 -3.248 1.904
Wave 5
CM
-0.007 0.006 0.888 0.789 0.055 1.069 -0.522 0.462 -3.549 2.569
SS
-0.006 -0.042 0.926 0.858 0.045 0.761 -0.564 0.444 -3.338 2.565
CA
-0.007 -0.004 0.847 0.718 0.046 1.078 -0.516 0.439 -3.361 2.432
Note. CM = Classroom Management, SS = Student Support, CA = Cognitive Activation.
NEPS Survey Paper No. 81, 2021 Page 21You can also read