PTV VISUM 2020 NEW FEATURES AT A GLANCE - PTV Group
←
→
Page content transcription
If your browser does not render page correctly, please read the page content below
PTV VISUM 2020 NEW FEATURES AT A GLANCE
Copyright:
        © 2019 PTV AG, Karlsruhe
        PTV Visum® is a trademark of PTV AG
        All brand or product names in this documentation are trademarks or registered trademarks
        of the corresponding companies or organizations. All rights reserved.
        Disclaimer:

        The information contained in this document is subject to change without notice and should
        not be construed as a commitment on the part of the vendor.
        This document may not be used for any other purpose than t he personal use of the
        purchaser.
        No part of this handbook may be reproduced, stored in a retrieval system, or transmitted, in
        any form, or by any means, electronic, mechanical, photocopying, recording, or otherwise,
        edited or translated, except as permitted under the terms of the copyright, without the prior
        written permission of PTV AG.
        Impressum:
        PTV AG
        Traffic Software
        Haid-und-Neu-Straße 15
        D - 76131 Karlsruhe
        Germany
        Phone. +49 721 9651-300
        Fax +49 721 9651-562
        E-Mail: info@vision.ptvgroup.com
        www.ptvgroup.com
        vision-traffic.ptvgroup.com

        © 2019 PTV AG, Karlsruhe

PTV Visum 2020 - New features at a glance © PTV AG                                                 2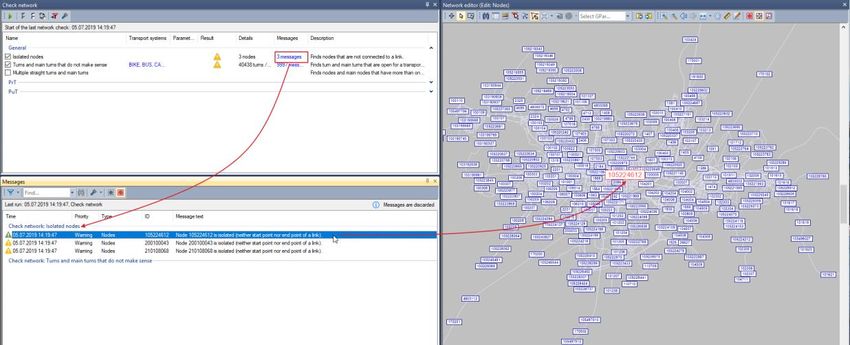
Contents

        1 New applications                                                                           4
            1.1   Line blocking considering battery-electric buses                                   4
            1.2   Support for activity-based models (ABM)                                            5
            1.3   Modeling of autonomous vehicles (AV)                                               7
            1.4   Local calculation and modelling of relocation in tour planning for Ride Pooling
                  Systems                                                                            8
            1.5   Experimental feature: Ride-Sharing Systems in combination with Public Transport
                  - First & Last Mile Concepts                                                 9

        2 Procedures                                                                                11
            2.1   Remarkable speedup of highway assignments through new shortest path search
                                                                                           11
            2.2   Extended stability criteria for PrT assignments                                   11
            2.3   Base load in SBA                                                                  12
            2.4   Dynamic matrix correction for public transport                                    13
            2.5   Distributed computing of the timetable-based assignment                           13
            2.6   Rounding in PT assignment                                                         14
            2.7   Extensions for public transport operating indicators                              14
            2.8   Integration oft he recent HBEFA 4.1 for calculating emmissions and fuel
                  consumption from traffic                                                          15

        3 Scenario management                                                                       16

        4 Graphics and handling                                                                     17
            4.1   User-defined sets of time intervals                                               17
            4.2   Interactive network check                                                         18
            4.3   Editing of line routes                                                            18
            4.4   Easier workflows with search functionality                                        19
            4.5   Diagrams for displaying two dimensions                                            19
            4.6   Display of link bars                                                              20
            4.7   Special functions on selections                                                   21

        5 Add-Ins, interfaces and COM                                                               22
            5.1   Intersection data import                                                          22
            5.2   Support for Python 3                                                              23
            5.3   Virtual Python environment compatible to venv                                     23
            5.4   Changes to the COM interface                                                      24

        6 Technical changes                                                                         25
            6.1   Diagnostics for Support                                                           25
            6.2   End of Life for legacy MS Windows operating systems                               25
            6.3   Selectable user interface languages                                               26

PTV Visum 2020 - New features at a glance © PTV AG                                                   3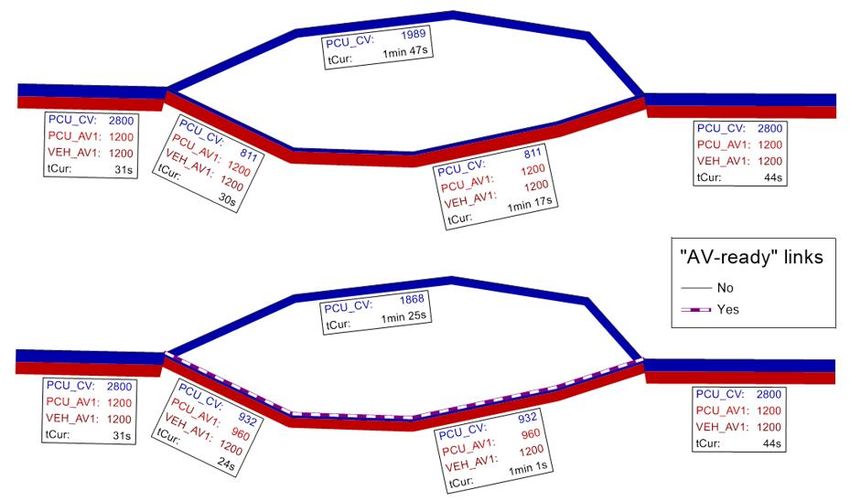
New applications

1       New applications

1.1     Line blocking considering battery-electric buses

        With the intention of making urban transport more compatible for people, it should become
        emission-free. More and more PT operators are therefore converting their vehicle fleets to
        electric propulsion. In addition to changes in infrastructure, new planning tasks must be
        solved. Compared to conventional combustion engines, battery electric drives currently have
        a significantly reduced range and are comparatively time-consuming with respect to
        recharging. The operator faces shorter line blocks with recurring charging activities. This
        results in an increased vehicle or charging infrastructure requirement.
        Visum 2020 offers the definition of such recurring activities as part of the line blocking
        procedure in order to determine the number of vehicles and the operating costs after
        conversion to e-vehicles. Both the temporal function of the charging process and the energy
        consumption definition is editable and stored within the data model. The capacity of the
        vehicle combinations, as well as the configurations of the charging infrastructure, is part of
        the network model. A genetic algorithm that iteratively solves graph flow problems and
        evaluates them by means of a parameterizable cost function generates an opti mal vehicle
        scheduling. The state of charge of the individual vehicles is calculated for each line block
        element and can thus be visualized in the line block editor.

        Visualization of the state of charge on line block elements

        The integration into the network model does not only enable the determination of the required
        number of vehicles. Questions can also be examined as to whether larger batteries, more
        charging infrastructure or higher charging currents are worthwhile in order to reduce the
        number of vehicles. Scenarios in mixed operation of vehicles with combustion engines and
        e-vehicles can evaluate lines for their "electrification- potential". Charging under catenaries
        during travel (in motion charging) can also be mapped and thus evaluated.

PTV Visum 2020 - New features at a glance © PTV AG                                                   4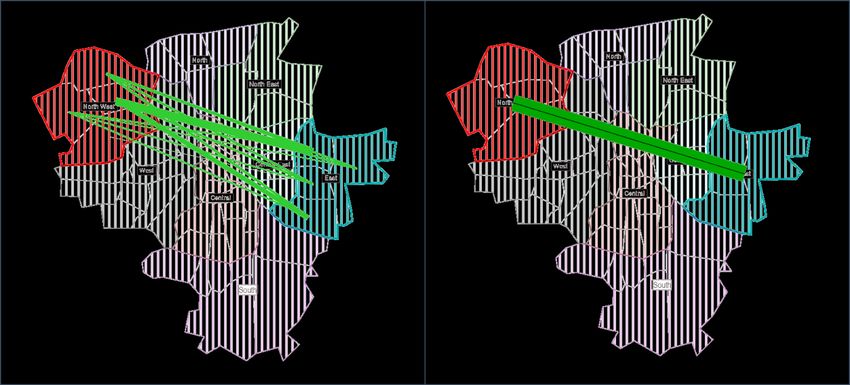
New applications

1.2     Support for activity-based models (ABM)

        Activity-based models (ABM) exist for some time. Especially in the US, ABM of various types
        have been developed and further extended over the last 10 to 15 years. In Europ e and in
        particular in German-speaking countries, agent-based models have been developed
        predominantly in the academic world and are used more widely to investigate questions in
        the fields of new mobility and of air quality.
        In classical macroscopic demand models, the population is aggregated into behavio rally
        homogeneous person groups. For each group activity pairs or activity chains are modelled.
        The calculation of demand is based on negative utilities of traveling. These models are also
        referred to as trip-based demand models, because they result in several of trip matrices
        differentiated by person group, trip purpose and mode.
        In contrast, in ABM the focus lies on individual persons and their mobility. ABM are
        microscopic demand models in which mobility decisions of all persons are individually
        simulated as sequentially discrete choices. The decisions depend on characteristics of the
        individuals. As a result, daily plans as sequence of activity executions are calculated. The
        daily plans contain information about the activities, e.g. start times, durations and locations,
        and also about the trips including the choice of mode.
        Despite a similar general understanding of these models and their existence over the years,
        no common structure has emerged that is used as a generally accepted standard. ABM can
        differ in many ways. This concerns the definitions of the utility functions, considered choices
        and their order, the decision models themselves as well as various model parameters.
        However, the approach is still popular. ABM model the behavior of individuals i n a very
        intuitive way and have the potential to better account for current changes summarized under
        the topic of New Mobility. This is reflected in tenders for projects that either directly require
        microscopic demand modelling or enable the investigations of scenarios that take new forms
        of mobility into account.
        The last two arguments have prompted us to implement a concept for microscopic demand
        modelling in Visum that supports a wide variety of approaches. This is the main advantage.
        Of course, when setting up such models, you naturally also benefit from existing advantages
        of Visum. These include the ability to handle large amounts of data, the direct co nnection
        with the assignment and a variety of display options.
        In the first stage, the concept includes the extension of the data model, COM functionality,
        interfaces for input and output as well as typical forms of graphical display that are necessary
        for the analyses of results in an ABM.
        The following figure shows the basic features of the concept.

PTV Visum 2020 - New features at a glance © PTV AG                                                     5
New applications

        The synthetic population is externally calculated or can be generated in Visum e.g. based on
        survey data. The data of the persons and households are stored in the new data structures
        persons and households. Households, like other activity locations, are geocoded. All objects
        can be described by additional attributes. The calculation of daily plans and the resulting
        tours and trips are based on scripts that must be created as part of the model building
        process. The results are stored as schedules, activity executions, tours and trips. Display in
        the network editors is synchronized as shown in the figure below for a single tour.

        With the available functionality, the ABM can be developed in Visum. Further extensions will
        follow, especially for graphical display. A tutorial will contain detailed instructions of how the

PTV Visum 2020 - New features at a glance © PTV AG                                                      6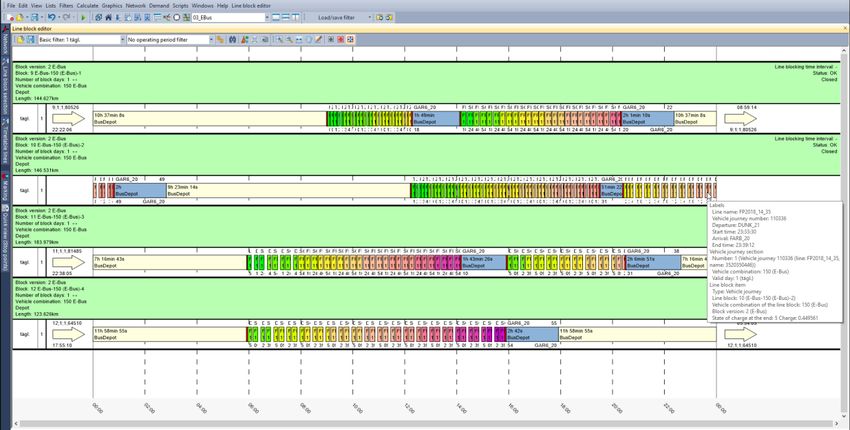
New applications

        ABM concept in Visum can be used. It also contains an example of a script-based
        implementation of an ABM.

1.3     Modeling of autonomous vehicles (AV)

        The requirement of modeling autonomous vehicles (AV) is also increasing in macroscopic
        models. The evaluation of scenarios investigates the influence of AV on capacity, travel time,
        and route choice. The underlying assumptions for modelling AV concern for example driving
        behavior or penetration rates.
        Generally, driving behavior of AV differs from conventional vehicles. On road sections where
        Car2Car or Car2Infrastructure communication is possible, AVs can drive at predefined
        headways or form platoons. This, in turn, has an impact on the volume-capacity ratio and
        consequently travel times.
        In static assignments travel times are determined by volume-delay functions (VDF) that
        define how travel time increases depending on the volume-capacity ratio. The higher the
        volume-capacity ratio, the longer the travel time. The consideration of AV has the effect that
        the input values for calculating travel times change. In contrast to conventional vehicles for
        AV different PCU factors apply. On ‘AV-ready’ infrastructure when AV can drive closer the
        PCU factor falls below a typical default. On sections, where this is not possible, AV drive like
        conventional vehicles. This characteristic of varying PCU factors must be considered in the
        VDF. To enable such flexibility the restrictions for the creation of user -defined VDF have
        been lifted. More specifically, user-defined attributes (UDA) can be used in such functions
        and also attributes of other network objects can be included using re lations. This allows the
        investigation of scenarios with different AV vehicle classes and assumptions.
        The effect on capacity, travel time and route choice is demonstrated in a simple example.
        Only one relation from zone 1 (left) to zone 2 (right) exists. In the following screenshot the
        upper picture shows the result of a static assignment without AV-ready infrastructure, i.e. AV
        behave like conventional cars represented by the transport system CAR. The demand of
        transport system CAR can choice between two routes. AV in contrast are only permitted on
        the lower route. The second picture below shows the result with two AV-ready links where
        for AV a PCU factor of 0.8 applies. This factor is lower than the standard value of 1.0 that is
        valid in other parts of the network. The comparison shows that travel time decreases on both
        routes and that some of the demand of CAR is shifted to the route with AV-ready links.

PTV Visum 2020 - New features at a glance © PTV AG                                                    7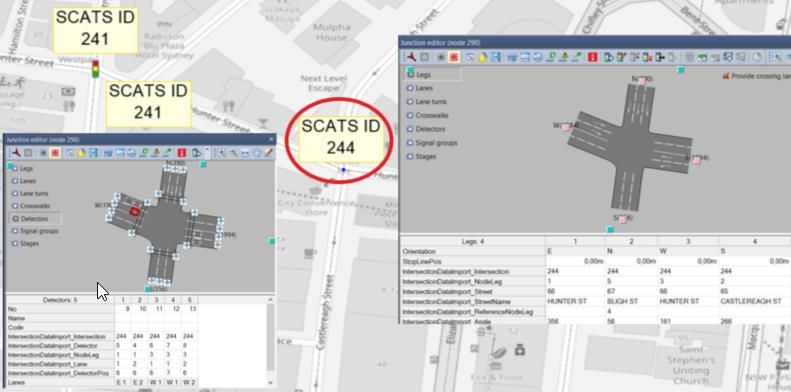
New applications

        In the simulation-based dynamic assignment (SBA), travel times are determined by the
        simulation. Free-flow speed, effective vehicle length and the reaction time determine the car
        following behavior in the simulation. However, the reaction time is largely responsible for the
        time headway to the vehicle in front. For local adjustments, factors can be used for the
        reaction time. This concept has been expanded. In order to model the driving behavior of AV
        on ‘AV-Ready’ road sections, the factor for the reaction time can additionally be defined
        depending on the transport system of the leading vehicle. The reason for this is that AV
        behave differently among each other than an AV following a conventional vehicle. In this
        way, the influence of autonomous vehicles on capacity, travel time and eventually route
        choice can be examined in SBA.

1.4     Local calculation and modelling of relocation in tour planning for
        Ride Pooling Systems

        The procedure for tour planning of Ride Pooling trip requests can now be executed on the
        local computer as an alternative to the cloud-based computation. This can improve
        calculation times for individual scenarios. The local computation is not bound to a PTV MaaS
        Modeller user account, but is provided as a regular perpetual license covered by a new addon
        module.
        The tour planning procedure now also supports a basic vehicle relocation mechanism.
        Network nodes can be flagged as holding areas through attributes. Vehicles will return to the
        closest holding area after a selected idle time. From there they will be dispatched to new
        tours at a later time. Thereby, vehicles can be repositioned near to the relevant origins of
        demand. The holding areas can also serve as initial spawning sites for new vehicles, which
        may improve the realism of the assessment.

PTV Visum 2020 - New features at a glance © PTV AG                                                   8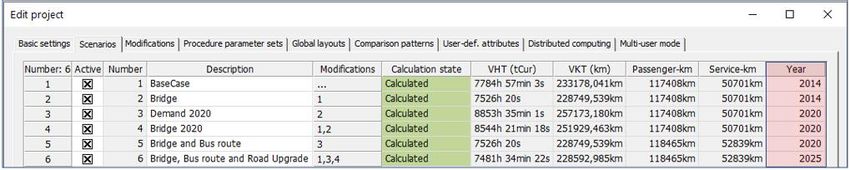
New applications

1.5     Experimental feature: Ride-Sharing Systems in combination with
        Public Transport - First & Last Mile Concepts

        Studies show that Ride Sharing concepts are a sustainable offer for urban trans port only in
        combination with conventional mass public transport. In order to evaluate the feeder function
        of ride-sharing systems (first & last mile concepts), the timetable-based assignment brings
        together the modes of conventional public transport and r ide-sharing systems. Within an
        assignment, the transfer process is depicted, and the temporal and spatial cons istency is
        considered. The results are intermodal connections including the passenger volume.
        While the timetable-based assignment for conventional public transport follows macroscopic
        principles, Ride-Sharing systems can only be modeled sufficiently by microscopic
        simulations. In order to archive stable results for such systems, a large number of
        realizations, i.e. in this case trip requests and their characteristic values must be summarized.
        In addition, key values of Ride-Sharing systems are volume/capacity dependent. In the
        context of an assignment it is not justifiable to carry out multiple microscopic tour plannings
        in each iteration for reasons of run times. Therefore, the average of the realizations is not
        obtained from several simulations, but from spatial and temporal aggregation. For this
        purpose, nodes are combined in larger areas. The aggregates of the characteristic values
        between and within these areas are used for the route search and choice within the
        assignment.

        Aggregation of characteristics for microscopic trip requests

        This method preserves the microscopic character of the Ride-Sharing and provides stable
        parameters for integration into the macroscopic assignment.
        The determined characteristics serve for the evaluation of potential pub lic transport path
        legs, which are carried out on the network of a chosen private transport system. If such a
        path leg is chosen, the next iteration will generate a trip request on this relation for
        microscopic trip planning. This will be the base for new characteristics. The single tour
        planning is thus fed by trip requests that start or end at transfer stops, but unimodal trips
        are still as well possible.
        The results of the single tour planning can be saved file-based. Due to their aggregation,
        no single tour plan is consistent with the resulting assignment connections. An an alysis of
        the tour plan, for example the one from last iteration, can, ho wever, provide useful

PTV Visum 2020 - New features at a glance © PTV AG                                                      9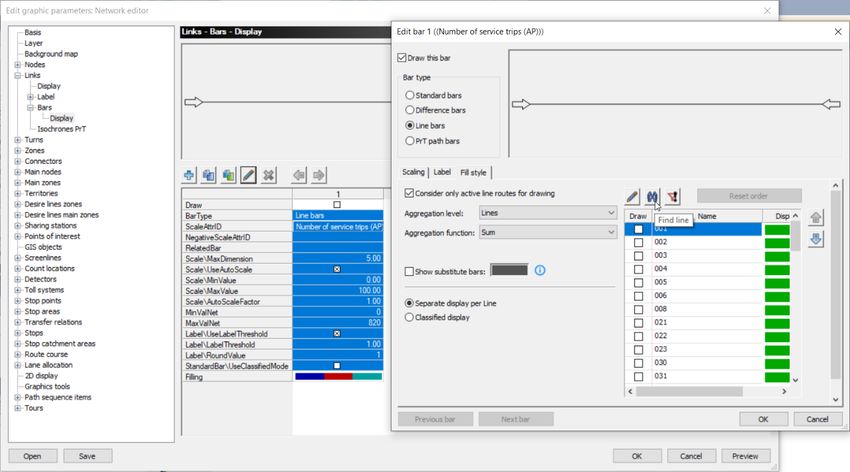
New applications

        information for an operational perspective on the Ride-Sharing system.
        This new extension of the timetable-based Public Transport assignment is currently still
        experimental. While the full functionality is available and ready-to-use, the procedure does
        not always produce convergent seolutions. In contrast to deterministic purely macroscopic
        methods, the simulation-based aspects of this procedure restrain smooth convergence.
        Instead, solutions can differ drastically between successive iterations. Therefore, results of
        the procedure should be assessed critically and possibly be underpinned by multiple
        calculations with varying parameters.We are looking forward to receive your feedback on the
        application of this new functionality.

PTV Visum 2020 - New features at a glance © PTV AG                                                 10
Procedures
2 Procedures
2.1 Remarkable speedup of highway assignments through new
shortest path search
Considerable efforts were again undertaken to speed up highway assignments. This time the
biggest change relates to the shortest path search. Here a new technique called
Customizable Contraction Hierarchy has been applied. The changes affect nearly all private
transport assignments – static and dynamic. The savings in run time depend on a number of
factors. The following table shows factors of speed up for models of different size.
Model Speed-up factor
Validate (Germany) 13.2
Stuttgart 7.2
London 2.8
Dubai 2.4
Philadelphia 2
Karlsruhe 1.9
2.2 Extended stability criteria for PrT assignments
In nearly all private transport assignments, the gap is the most important measure for
convergence. However, it does not allow further analysis in which parts of the network and
to what extent volumes and impedances, respectively, fluctuate in successive iterations.
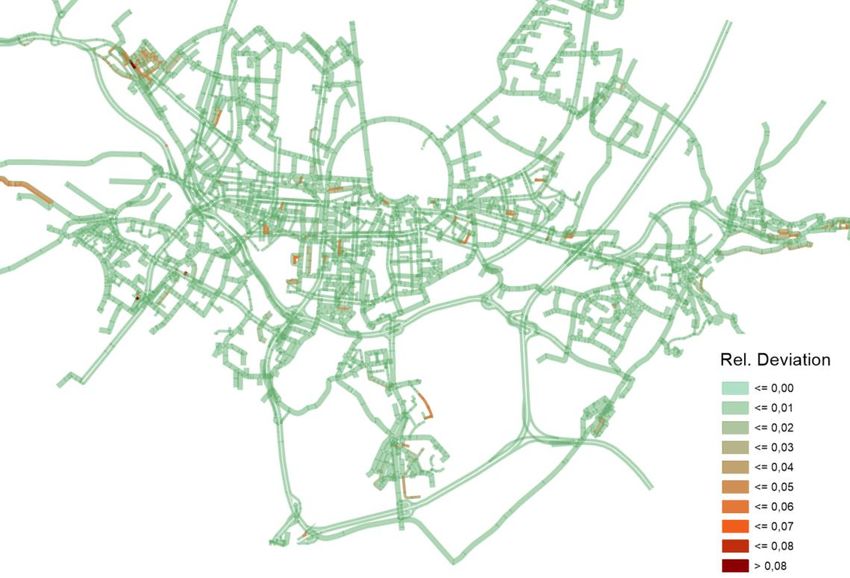
For this reason, extended stability criteria have been introduced. Their use as termination
criteria for convergence is optional. The definition of parameters is based on existing
guidelines, e.g. WebTAG guideline for Highway assignment modelling in the UK. Thresholds
for the relative deviations between volumes and impedances, respectively, of successive
iterations can be defined together with the share of links and turns that must fall below these
limits. The output of relative deviations for individual network objects allows to graphically
display closeness of results between successive iterations. The evaluation of extended
stability criteria can be restricted to active network objects, i.e. ruling out parts of the network
with low importance.
The following figure shows the relative changes in volumes between two successive
iterations for the network of Karlsruhe.
PTV Visum 2020 - New features at a glance © PTV AG 11Procedures
2.3 Base load in SBA
Like in static assignments, a base load can be considered in SBA. In contrast to static
applications, the base load in SBA has a temporal dimension. The main purpose is to
evaluate the effects of road-based public transport on general traffic. Busses usually result
in a reduction of capacity. On the other hand, measures like the introduction of dedicated
bus lanes can be investigated.
For the base load, one can either specify an attribute that is interpreted as the number of
vehicles per hour or one can use an attribute with a sub-attribute of a time interval set or
directly define the number of service trips per time interval from the PT operating indicators.
Since the vehicles of the base load are considered in the simulation, a private transportation
system must be referenced for which meaningful simulation parameters for the effective
vehicle length and the reaction time are set. The base load is defined as part of the SBA
procedure parameters.
PTV Visum 2020 - New features at a glance © PTV AG 12Procedures
2.4 Dynamic matrix correction for public transport
The procedure for dynamic matrix estimation has been extended to public transport. Demand
matrices can be adjusted based on observed data, potentially also considering changes on
the supply side. More specifically, you can correct matrices of demand segments that have
been assigned using the timetable-based assignment. There are two preconditions for
dynamic matrix correction in public transport. Passenger volumes must be stored for demand
time intervals. Secondly, the demand time series must be based on a matrix time series.
In the procedure itself, the known options for the input data are available, i.e. link counts,
boardings, alightings at stop areas, passenger kilometres etc. Observed input data can be
stored as user-defined attributes (BDA) with reference to a user-defined time interval set in
the model. During dynamic matrix estimation, this temporal information is taken into account
when adjusting matrices from the corresponding demand interval.
2.5 Distributed computing of the timetable-based assignment
The timetable-based assignment is a dynamic assignment. It takes the coordination of the
timetable into account and thus ensures precise results of the indicator calculation. The
procedure determines connections for each OD relation and carries out a route choice of the
demand. It’s often used without considering capacity restraints.
Due to these properties, the individual OD relations are not interdependent, and it is possible
to perform their calculations separately. With Visum 2020 it is possible to use the already
existing functionality of the distributed calculation within the timetable-based assignment. For
this purpose, external computation nodes can be selected on which the relations are divided
based on their origin zones. The computers receive the corresponding number of origin
zones proportional to the processors available.
PTV Visum 2020 - New features at a glance © PTV AG 13Procedures
This considerably reduces the overall runtime of a larger timetable-based assignment. The
runtime scales well with the number of selected cores.
2.6 Rounding in PT assignment
The method for rounding of passenger volumes in public transport assignments has been
revised. A so-called “bucket”-rounding is used, which in particular ensures that the total
demand does not change. The parameter for the number of decimal places has been
increased and a new parameter has been introduced that allows rounding to multiple of a
number.
With these changes, rounding can easily be used to reduce the number of routes. Post-
processing of assignment results like flow bundle or skim matrix calculations produces
consistent results based on rounded volumes.
2.7 Extensions for public transport operating indicators
In order to estimate the impacts on PT, operating indicators are determined that describe the
operational and financial expenditure for offering public transport supply on the one hand and
the expected revenue from fare collection on the other.
In Visum 2020, the scope of this impact model has been extended once again. Among other
things, the PT operator is now available as a dimension in the detailed public transport
territory evaluation. New key figures such as the ‘seat hour’ on the route can be evaluated.
Hints for unusually long passenger trip chains are given in order to prevent misinterpretations
and the evaluation of the results via the detailed PT territory list has been improved by the
more flexible setting of the filter conditions.
PTV Visum 2020 - New features at a glance © PTV AG 14Procedures
2.8 Integration oft he recent HBEFA 4.1 for calculating emmissions
and fuel consumption from traffic
The latest version HBEFA 4.1 of the Handbook for emission factors was released by infras
in September 2019. This major update incorporates many new measurements generated by
the “Dieselgate” investigations and alternative propulsion technologies. Besides the update
of many values and factors, the new version also compromises some structural adaptions.
The set of traffic situations and levels of service has been extended, and the definition of
some vehicle classes was refined. Due to these changes, the procedure parameters and
other input values (e.g. the fleet compositions) need to be adjusted prior to recalculate
emissions for an existing model using the HBEFA 4.1 emission factors. The set of available
results has been extended by optional CO2 emissions along the production chain, so called
Well-to-tank (WTT) emissions.
PTV Visum 2020 will support the calculation of emissions using HBEFA 4.1 starting with an
early ServicePack. Until the new methodology is available, the calculation of emissions will
be generally disabled. The legacy HBEFA 3.3 is NOT supported.
PTV Visum 2020 - New features at a glance © PTV AG 15Scenario management
3 Scenario management
For the scenario management, user-defined attributes (UDA) have been introduced for
scenarios, modifications, and procedure parameter sets. The additional attributes allow to
add additional information and are of huge benefit in large projects with numerous scenarios
and modification. The user gains more overview and documentation. UDA enable sorting,
grouping and editing like in lists. For easy access the corresponding functionality is available
in the context menu. All UDA are listed in a specific new Tab, but can be created directly
from the tabs of the corresponding objects too.
In addition, the database format of the scenario management project has been migrated to
SQLite, because the previous format is no longer supported by Microsoft and has limitations
for further development.
PTV Visum 2020 - New features at a glance © PTV AG 16Graphics and handling
4 Graphics and handling
4.1 User-defined sets of time intervals
In Visum 2020 several time interval sets can be defined. Time intervals of one of these sets
represent the analysis time intervals which are still used for outputs in dynamic applications.
The definition of analysis time intervals was subject to restrictions. More precisely, analysis
time intervals could not overlap, and any aggregation must be based on existing analysis
time intervals. For input data, e.g. counts, greater flexibility is required. In addition, any
change to analysis time intervals inevitably results in deleting attribute values with this time
dimension. For input data this is an undesired effect.
For this reason, some changes and extensions have been implemented. Time interval sets
and time intervals are network objects and are no longer available in the general procedure
settings. Access to time interval sets is available via the menu Network: the corresponding
time intervals can be created and edited directly in the list.
The analysis period and the time interval set that represents the analysis time intervals are
defined in the network settings under Calendar and analysis period. Like before result
attributes of procedures exist for analysis time intervals and can be animated in the network
editor based on these intervals.
Aggregation over time intervals can be performed using several time interval sets. For
example, you define one time interval set with intervals of 15min that represent analysis time
intervals. Another set is used for observed count data that are available for 1h interva ls. If
you were to compare the observed 1h count data with the calculation results over 15min
aggregation of results can be achieved using the functionality in the attribute selection dialog.
PTV Visum 2020 - New features at a glance © PTV AG 17Graphics and handling
4.2 Interactive network check
For many transport modelling projects, it is necessary to check the global network quality.
The redesign of the network check workflow improved the usability of the network check
functionality by making it accessible through a tool window instead of a dialog. From the tool
window it is possible to directly observe the effects of actions, like repairing and setting
objects to active, right away in the network editor. The content of the tool window can be
adjusted according to the users need, i.e. hiding irrelevant topics. The start of the last check
and a description are displayed. A mouse click on messages opens the message window.
Using the synchronization between the message window and network editor the critical
network objects can be accesses quickly.
4.3 Editing of line routes
The ability to edit line routes has been enhanced in Visum 2020. Due to the multi-layer data
model, line routes may be created that have elements which are not used by any vehicle
journey. A smart shortening of all (active) line routes to the elements that are served by
vehicle journeys is available. This serves for clarity and minimizes the susceptibility to errors.
In addition, the use case that elements of an existing line route and their time profiles are
reused for another line route has been greatly simplified. Instead of coding them identically,
it is possible to copy parts of the line route and link them to existing line rout es. The line
routes to be linked to only require identical stop points at the end on one or both sides. The
allocation of time profiles can be controlled by the user.
The identification of line routes has been simplified by the fact that the direction of travel of
the line route is now displayed much more clearly. The correct selection of line routes is
improved.
PTV Visum 2020 - New features at a glance © PTV AG 18Graphics and handling
4.4 Easier workflows with search functionality
When modelling public transport supply the number of lines and stops can be quite large. To
speed up work flows in models with many lines and stops, search options are included at
more places.
When creating a line route, the corresponding line can be selected by starting to type the
part of the line number. This is much faster than scrolling through lists and then selecting the
corresponding line. Further the selection for displayed and non-displayed line bars in the
graphic parameters has been improved. Furthermore, relevant stops for fare zones can be
selected more quickly by searching for them.
4.5 Diagrams for displaying two dimensions
Analysis often includes more than one criterion. To focus on the important parts in the
network right away, diagrams can be scaled by one attribute value and colored by a second
attribute value.
For public transport this can for example be useful to display the number of transfers at a
stop and color the pie charts according to the average wait time at the stop.
PTV Visum 2020 - New features at a glance © PTV AG 19Graphics and handling
Concerning private transport, pie charts can be displayed at every node. When scaling them
by the total volume and coloring them by the volume-capacity ratio, critical junctions can be
identified.
4.6 Display of link bars
Link bars are an important visualisation especially for link volumes. At nodes with many
legs it was possible that link bars were overlapping, not displayed correctly or had gaps
between them. By improving the algorithm for drawing link bars the gaps are gone and the
network-wide view on link bars looks a lot smoother.
Before link bars were not automatically connected.
PTV Visum 2020 - New features at a glance © PTV AG 20Graphics and handling
For a smoother picture the link bars are now always connected.
4.7 Special functions on selections
Up to now, special functions in the network editor could only be executed for one object, all active
objects, and all objects. For example, when editing surfaces of multiple adjacent zones by hand
the recalculation of the centroids had to be executed for each zone separately.
This uncomfortable workflow is improved by offering the execution for all special functions also
on manually set selections. Now it is easily possible to selec t e.g. all edited zones and choose
the context menu entry 'Recalculate the centroids'.
PTV Visum 2020 - New features at a glance © PTV AG 21Add-Ins, interfaces and COM
5 Add-Ins, interfaces and COM
5.1 Intersection data import
More and more applications benefit directly from the fact that junctions are coded in detail.
For example, assignments like SBA or assignment with ICA can consider junction
impedances based on geometry and control. The interface to PTV Vissim automatically
generates simulation-ready networks if junctions in Visum have all the required attributes set.
However, the efforts to manually code junctions are a significant part of network building
process. To considerably reduce these efforts, the intersection data import has been
implemented. In its current form, the import reads mainly geometry data.
The import of junction data is a two-step process. First, the original data must be converted
to .csv files. This step is outside Visum and can be undertaken using a script. The second
step is the intersection data import in Visum, where these .csv files are imported as .zip
archive.
The .csv file contain a number of necessary attributes, others are optional and can be
evaluated during the import. All data are taken over as user -defined attributes (UDA). This is
also the case for additional columns which are not needed for matching algorithm. In other
words, it is also possible to read count data of detectors to the target network. The matching
of intersections can be coordinate-based and/or done by allocation of node UDA. As a result
of the import, the junction geometry is changed, i.e. the number of inbound and outbound
lanes is adjusted, lane turns are generated, crosswalks and detectors are created, signal
groups and their allocation to stages are defined. The following figure shows results of an
import of data from SCATS. The screenshots of the junction editor show details of the
mapping of legs and detectors.
PTV Visum 2020 - New features at a glance © PTV AG 22Add-Ins, interfaces and COM
5.2 Support for Python 3
On January 1 st , 2020, the Python Software Foundation will officially discontinue support for
Python 2.7. From then, only the current Python 3.7 version will be maintained. So far, Visum
only allowed to execute scripts and Add-Ins designed for Python 2.7 and provided the
necessary run time and libraries. As the two versions are not fully compatible, existing scrips
may not run in a Python 3.7 environment without changes.
In order to comply with the ongoing evolution of the Python platform, Visum now allows to
also execute scripts and Add-Ins designed for Python 3.7 and provides the corresponding
Python environment. For the time being, the legacy Python 2.7 version will be supported and
installed in parallel. Therefore, the Visum setup now installs both versions of the Python
runtime as well as the Python libraries and the VisumPy package in recent versions for both
variants.
The default Python environment used for starting scripts through the script menu, through
COM or through the command line is now Python 3.7. This can be changed through a setting
in User preferences/Working environment/Script files. The scripting environment for running
an Add-In is configured individually through an XML structure in the corresponding *.vai file.
For the procedure “Run script”, the environment - including some other scripting languages
like VBS - can be selected for each procedure individually. Thereby, even different
environments can be used in a single procedure sequence. In order to avoid breaking
existing models, this defaults to Python 2.7. Thus, most existing procedures using Python
scripts can be run without adapting the script code – although we strongly advice to update
the scripts to Python 3.7 for future maintenance.
5.3 Virtual Python environment compatible to venv
The Python environment provided by Visum includes a set of useful Python libraries, which
can be used by Scripts and Add-Ins. In order to provide a reliable setting, these libraries are
installed in the Visum installation folder and thus outside the system Python installation path.
When those libraries shall be referenced in scripts started outside Visum or during script
PTV Visum 2020 - New features at a glance © PTV AG 23Add-Ins, interfaces and COM
development in an IDE, it is required to adjust the search path for libraries used by Python.
Up to now, this could be achieved by using the SysPath module provided by PTV and
incorporate this in the source code. In order to simplify this, a virtual Python environment
called “PTV Visum 2020” compatible with the standard venv tool is now created during the
installation. In many modern Python IDEs, this can be selected for running the scripts, so
changes to the script code are no longer required.
5.4 Changes to the COM interface
The changes related to time intervals (see section 4.1) also imply some changes to the
related COM-APIs. The COM object IAnalaysisTimes has been removed and replaced
by the new type ITimeIntervalSet, which is accessed through function on Visum.Net.
The obsolete functions for IAnalysisTime (e.g.
Visum.Procedures.Functions.AnalysisTimes.TimeInterval are still provided
for backward compatibility, but will be removed in future versions. Scripts using these
functions should be adapted.
The method AddUserDefinedAttribute (provided for many object types) now expects
string values for the parameter ‘subAttr’ instead of numbers. The parameter can thereby now
refer to any custom time interval set.
PTV Visum 2020 - New features at a glance © PTV AG 24Technical changes
6 Technical changes
6.1 Diagnostics for Support
When PTVs customer support deals with support cases, some background information (e.g.
operating system, …) and files (e.g. log files) are typically required. In order to facilitate this,
we now provide a tool which collects the relevant information and composes it in a support
package which can be provided along with the support request.
In order to launch this tool, type “Diagnostics for PTV Visum 2020’ in the search field of the
Windows start menu. It is not required to start Visum for this. The user interface of the tool is
displayed.
Change to the page “Support package”. You can select the relevant information in the list
“Diagnostics Reports” – usually, the pre-selection should not be altered. The button “Add
Files” allows to include further files which might be helpful for analysing the support case
(e.g. screen shots, input files, …). After pressing the button “Create Support Package”, the
selected information is acquired and stored in the specified file.
On the page “Actions” the support tool provides some further useful functionality.
6.2 End of Life for legacy MS Windows operating systems
The products of the PTV Vision Traffic Suite are supported and tested by PTV only on the
Windows operating systems with active Extended Support by Microsoft. Details on the
support lifecycle are provided by Microsoft in the Windows Lifecycle Fact Sheet.
On January 14th, 2020 the support for the operating systems MS Windows 7, MS Windows
Server 2008 and MS Windows Server 2008 R2 by Microsoft officially terminates. MS
PTV Visum 2020 - New features at a glance © PTV AG 25Technical changes
Windows 8 is only supported after updating to MS Windows 8.1. Older versions of MS
Windows 10 are consecutively dropped from support. Similar rules apply to the related MS
Windows Server operating systems. In accordance with these changes, the products of the
Vision Traffic Suite will no longer officially support legacy operating systems. PTV will
discontinue to test and support the operation of its software on these platforms.
6.3 Selectable user interface languages
The languages offered for the user interface are no longer controlled through the license. All
available languages can be selected, independent of the lice nse. The completeness of the
translations cannot be guaranteed for all languages; thus, some elements might appear in
the fallback language – usually English.
Online help, manuals etc. are still provided in a subset of the supported languages.
PTV Visum 2020 - New features at a glance © PTV AG 26PTV AG Haid-und-Neu-Straße 15 76131 Karlsruhe Germany Phone +49 (0) 721 9651-300 Fax +49 (0) 721 9651-562 E-Mail: info@vision.ptvgroup.com w w w.ptvgroup.com vision-traffic.ptvgroup.com
You can also read