Public Investment in Belgium - Current State and Economic Impact
←
→
Page content transcription
If your browser does not render page correctly, please read the page content below
WORKING PAPER 1-17

Federal
Planning Bureau
Economic analyses and forecasts

                                      Public Investment in Belgium
                                               Current State and Economic Impact

                                                                      January 2017
                                                      Bernadette Biatour, bbi@plan.be
                                                          Chantal Kegels, ck@plan.be
                                                     Jan van der Linden, jvdl@plan.be
                                                           Dirk Verwerft, dv@plan.be

Avenue des Arts 47-49 – Kunstlaan 47-49
1000 Brussels

E-mail: contact@plan.be
http://www.plan.be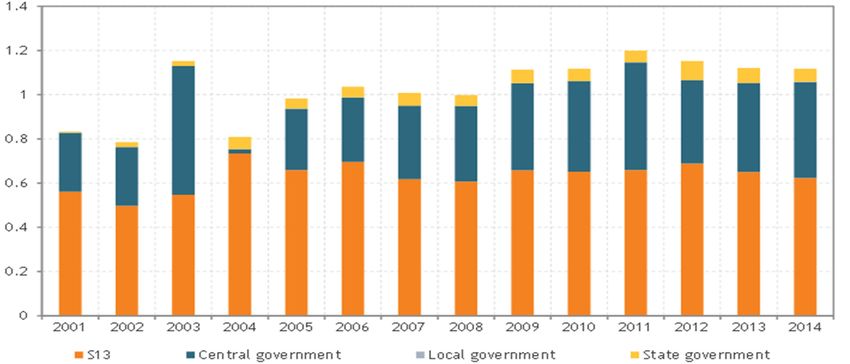
Federal Planning Bureau

The Federal Planning Bureau (FPB) is a public agency that carries out, in support of political decision-
making, forecasts and studies on economic, social-economic and environmental policy issues and ex-
amines their integration into a context of sustainable development. It shares its expertise with the gov-
ernment, parliament, social partners, national and international institutions.

The FPB adopts an approach characterized by independence, transparency and the pursuit of the gen-
eral interest. It uses high-quality data, scientific methods and empirical validation of analyses. The FPB
publishes the results of its studies and, in this way, contributes to the democratic debate.

The Federal Planning Bureau is EMAS-certified and was awarded the Ecodynamic enterprise label
(three stars) for its environmental policy.

url: http://www.plan.be
e-mail: contact@plan.be

Publications

Recurrent publications:
Outlooks

Planning Papers (latest publication):
The Planning Papers aim to diffuse the FPB’s analysis and research activities.
115     Les charges administratives en Belgique pour l’année 2014 /
        De administratieve lasten in België voor het jaar 2014
        Chantal Kegels, Dirk Verwerft - February 2016

Working Papers (latest publication):
12-16   The population at risk of poverty or social exclusion in Belgium - Projection until 2030
        Jean-Maurice Frère - November 2016

With acknowledgement of the source, reproduction of all or part of the publication is authorised, except
for commercial purposes.

Responsible publisher: Philippe Donnay
Legal Deposit: D/2017/7433/3
WORKING PAPER 1-17
Federal Planning Bureau
Avenue des Arts - Kunstlaan 47-49, 1000 Brussels
phone: +32-2-5077311
fax: +32-2-5077373
e-mail: contact@plan.be
http://www.plan.be
Public Investment in Belgium
Current State and Economic Impact
January 2017
Bernadette Biatour, bbi@plan.be, Chantal Kegels, ck@plan.be,
Jan van der Linden, jvdl@plan.be, and Dirk Verwerft, dv@plan.be
Abstract - Belgian government investment, and specifically the part spent on infrastructure, is relatively
low both in historical terms and compared to neighbouring countries. A simulation with the European
Commission’s Quest III model suggests that increasing government investment permanently by 0.5%
of GDP leads to a growth in GDP, private consumption and private investment. The impact of alterna-
tive financing mechanisms is compared. Finally, a budget neutral shift of investment in favour of infra-
structure is found to yield significant benefits in terms of GDP and its main components already in the
medium run.
Abstract - L’investissement des autorités publiques belges, et en particulier la part consacrée à l’infras-
tructure, est relativement faible à la fois historiquement et en comparaison avec les pays voisins. Une
simulation à l’aide du modèle Quest III de la Commission européenne suggère qu’une augmentation
permanente de l’investissement du gouvernement de 0,5% du PIB augmente le PIB, la consommation
privée et l’investissement privé. L’impact de mécanismes alternatifs de financement est comparé. Fina-
lement, une réallocation, budgétairement neutre, de l’investissement en faveur de l’infrastructure con-
duirait, déjà à moyen terme, à des gains substantiels de PIB et de ses principales composantes.
Abstract - De Belgische overheidsinvesteringen, en in het bijzonder het deel ervan dat aan infrastruc-
tuur wordt besteed, relatief laag ligt in historische context en in vergelijking met de buurlanden. Een
simulatie met het QUEST III- model van de Europese Commissie suggereert dat een permanente stijging
van de overheidsinvesteringen met 0,5% van het bbp leidt tot een groei in bbp, particuliere consumptie
en particuliere investeringen. De impact van alternatieve financieringsmechanismen wordt vergeleken.
Ten slotte blijkt dat een budget-neutrale verschuiving van overheidsinvesteringen ten gunste van infra-
structuurwerken belangrijke voordelen oplevert in termen van het bbp en zijn belangrijkste componen-
ten, en dit reeds op middellange termijn.
Jel Classification - E27, E62, H54
Keywords - Public investment, Infrastructure, Public finance, General equilibrium, SimulationWORKING PAPER 1-17
Table of contents
Executive summary ................................................................................................ 1
Synthèse .............................................................................................................. 3
Synthese .............................................................................................................. 5
Introduction ......................................................................................................... 8
1. Definitions..................................................................................................... 10
2. Evolutions and trend ........................................................................................ 14
2.1. General government investment 14
2.2. Infrastructure investment 16
2.2.1. General governement 16
2.2.2. Whole economy 20
3. Channels of transmission ................................................................................... 22
4. The QUEST model............................................................................................ 25
4.1. Model description 26
4.1.1. The supply-side channel: public capital and output 27
4.1.2. Fiscal and monetary policy 28
4.1.3. The demand-side channel: consumption, investment, and current account 30
4.2. Adaptation of the QUEST model: calibration issues 31
4.2.1. Elasticity of output 31
4.2.2. Starting value of public investment and debt-to-GDP ratio 31
4.2.3. Labour supply parameters 31
4.2.4. Other variables 32
5. Simulations .................................................................................................... 33
5.1. Basic simulation of a government investment increase 33
5.2. Alternative simulations 36
5.2.1. Alternative financing methods 36
5.2.2. Different types of investment 39
6. Sensitivity analyses.......................................................................................... 41
Conclusion .......................................................................................................... 44
Annexes ............................................................................................................. 47
Annex A: Government investment functional breakdown and investment by level of government 47
Annex B: Modelling the economic impact of infrastructure investment 49
Annex C: The Investment Plan for Europe 55
References .......................................................................................................... 57WORKING PAPER 1-17
List of tables
Table 1 Economic impact of a 0.5 % of GDP shock to government investments in Belgium ··············34
Table 2 Effects after 1 year of raising government investments by 0.5% of GDP, different financing
schedules ····································································································· 36
Table 3 Effects after 20 years of raising government investments by 0.5% of GDP, different financing
schedules ····································································································· 37
Table 4 Effects after 20 years of raising government infrastructure investments by 0.5% of GDP ······40
Table 5 Effects after 20 years of raising government investments by 0.5% of GDP, sensitivity to the
output elasticity ···························································································· 41
Table 6 Effect after 20 years of raising government investments by 0.5% of GDP, sensitivity to the
substitution elasticity of imports and domestic goods ················································42
Table 7 Effect after 20 years of raising government investments by 0.5% of GDP, sensitivity to the
share of liquidity-constrained households ······························································ 42
Table 8 Effect after 20 years of raising government investments by 0.5% of GDP, sensitivity to the
parameter CSEARCH ························································································ 43
List of graphs
Graph 1 Gross fixed capital formation, total economy··························································14
Graph 2 Government gross fixed capital formation······························································15
Graph 3 Government net capital stock ············································································ 16
Graph 4 Government investment: breakdown by functional classification, 2014 ··························· 17
Graph 5 Government investment in infrastructure ······························································ 17
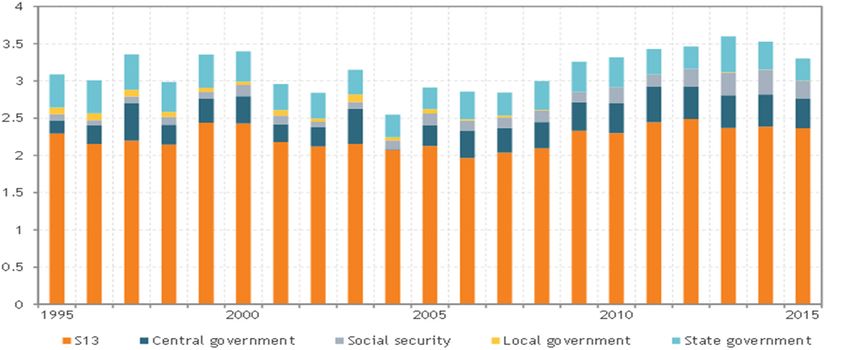
Graph 6 Government investment (total and infrastructure): breakdown by level of government ······· 18
Graph 7 Net capital stock in Other structures and telecommunications equipment: Total economy ···21
Graph 8 Evolution of the debt-to-GDP ratio in the debt financing scenario ·································38WORKING PAPER 1-17
Executive summary
Can additional government investments in Belgium result in higher economic growth? This question
has recently come under the spotlight following recommendations in this direction by international
organisations like the European Commission and the IMF. By contrast, in Belgium, government invest-
ment has decreased from more than 5% of GDP on average during the 1970s to 2.4% of GDP in 2015.
Since the end of the 1980s, gross investment has not always been sufficient to compensate for the depre-
ciation of the installed capital. Since 1995, the government net capital stock has decreased by almost 15
percentage points of GDP, reaching 36.5% of GDP in 2015, a figure that is significantly lower than in the
neighbouring countries. Not only has government investment in Belgium decreased, but its composi-
tion has also changed. The share of infrastructure investment, considered to be the type of government
investment with the highest growth potential, decreased from 35% in 2006 to 26% in 2014. Conse-
quently, Belgian government infrastructure investment reached 0.6% of GDP in 2014 compared to al-
most 1% in the Euro Area.
To shed more light on the question above, the effects of an increase in government investment on the
Belgian economy were simulated using the QUEST III model of the European Commission, adjusted to
the current situation of the country. The main advantage of this model is the availability of a country-
specific version for Belgium, with economic ties to the rest of the Euro Area and the rest of the world.
The FPB has a long tradition of calculating the impact of economic shocks on the Belgian economy. In
previous exercises, the demand-driven model HERMES has been used to stimulate a shock of public
investment (see Bassilière et al., 2013). In comparison to this previous simulation, this exercise allows to
also include the positive impact of government investment on the production function of the private
sector.
The basic simulation involves a permanent budget neutral increase in government investment of 0.5%
of GDP which corresponds to an additional investment of about 2 billion euros per year. This amount
is in line with Belgian proposals to work out the public infrastructure pillar of the Investment Plan for
Europe. It is found that real GDP rises by 0.24% after one year and by 2.77% after twenty years relative
to the baseline. The largest share of this increase reflects higher labour productivity, though employ-
ment itself also slightly rises. Both private consumption and private investment increase by 1.5% rela-
tive to the baseline after twenty years. Initially, the GDP deflator rises slightly as a result of increased
demand, but in the long term the productivity growth lowers domestic producer prices by 1.3%, leading
to a curtailment of inflation. Overall, a stylized head tax (lump-sum tax) of 0.13% of GDP is necessary
to keep government finances stable at the current level. This excludes the possibility of a self-financed
measure (or ‘fiscal free lunch’), because this would lead to a head tax equal to or smaller than zero. At
the same time, the resulting economic growth ensures that only a quarter of the invested amount has to
be covered by new government revenues.
Additional simulations were performed to check how these results would change if the measure was
financed either by a more realistic tax (on labour, on capital or on consumption), by a reduction in gov-
ernment consumption or by a public debt increase. In the long run, financing through debt or through
1WORKING PAPER 1-17 a higher consumption tax turns out to have almost the same positive effect on GDP as under the basic stylized head tax, i.e. 2.69%. The results of the consumption tax scenario, however, are likely to be over- estimated since the model does not fully include the Belgian wage formation mechanism. If the measure is financed by cutting other government expenses, GDP still rises by 2.43% after twenty years relative to the baseline. A tax on labour or capital income detracts the most from the positive effects, at least concerning GDP, limiting its growth to 1.69% and 1.89% respectively. The former thereby mainly ham- pers employment and private consumption, while the latter causes private investments to fall. Private consumption is maximal under a cut in other government expenditures, because this scenario does not lead to additional taxes or government debt (i.e. postponed taxes). If only debt financing is considered, public debt increases and the debt-to-GDP ratio reaches 112% after twenty years, hereby rendering the evolution of public finances unsustainable. Evidently, this comparison has to be interpreted with the necessary caution: on the one hand the different financing mechanisms have been modelled in a stylized way, while on the other hand GDP and private consumption, certainly within an economic model, can only partly capture household welfare. Starting from the observation that infrastructure investments have a larger effect in terms of GDP than other government investments (hospitals and schools, public goods and redistribution), a shift in ex- penditures from the latter to the former has been simulated. After only three years, this scenario results in a 1.2% increase in GDP growth relative to the baseline. Moreover, initially budget neutral, this shift leads to higher government revenues which can be used to lower the tax burden and/or the public debt ratio. Finally, sensitivity analyses were carried out for the most important parameters underlying this study. Not unexpectedly, the effect of the parameter representing the impact of a growth of public capital on output growth, the so-called output elasticity of public capital, is crucial for these conclusions. A more conservative estimate of this elasticity (50% lower) would, in the basic scenario, yield a GDP growth of only 1.48% instead of 2.77% after twenty years, while increasing the parameter’s value by 50% would yield a growth of 4.2%. So, even though the value used in the basic simulation was chosen with care and is located in the middle of the interval of empirical estimates, these results should be interpreted with caution. In conclusion, the simulation suggests that raising government investment in Belgium supports GDP, private consumption, and private investment growth without inflationary effects. This increase is only partially self-financing, however, so that a budgetary compensation is necessary to prevent government debt from growing. Policy priorities should determine which financing mechanism has to be adopted. Finally, a mere shift between government investment types in favour of infrastructure, without addi- tional budgetary means, already has a quite substantial positive impact on GDP and its main compo- nents. 2
WORKING PAPER 1-17

Synthèse

La croissance économique peut-elle être stimulée par des investissements publics supplémentaires ?
Cette question revient sur le devant de la scène suite aux recommandations en la matière des organisa-
tions internationales comme la Commission européenne ou le FMI. En revanche, en Belgique, le taux
d’investissement des autorités publiques a diminué, passant de plus de 5% du PIB en moyenne dans les
années septante à 2,4% du PIB en 2015. Depuis la fin des années quatre-vingt, l’investissement brut n’a
pas toujours été suffisant pour compenser la dépréciation du capital installé. Le stock net de capital
public a donc diminué de près de 15 points de pourcentage du PIB depuis 1995, s’élevant à 36,5% du
PIB en 2015, un chiffre largement inférieur à celui observé dans les pays voisins. En Belgique, l’investis-
sement public n’a pas seulement diminué, sa composition s’est également modifiée. La part des inves-
tissements en infrastructure, considérés comme les investissements dotés du potentiel de croissance le
plus élevé, est passée de 35% en 2006 à 26% en 2014. En conséquence, l’investissement belge en infras-
tructure s’élevait à 0,6% du PIB en 2014 contre près de 1% dans la zone euro.

Pour tenter de répondre à cette question, les effets sur l’économie belge d’une augmentation des inves-
tissements des autorités publiques ont été simulés à l’aide du modèle QUEST III de la Commission
européenne, mis à jour pour tenir compte de la situation actuelle de notre pays. Le principal avantage
de ce modèle est la disponibilité d’une version spécifique à la Belgique incluant des liens économiques
avec le reste de la zone euro et le reste du monde.

Le BFP a une longue tradition de calcul de l’impact de chocs sur l’économie belge. Dans un exercice
précédent, le modèle déterminé par la demande HERMES a été utilisé pour simuler l’impact d’un choc
d’investissement public (Bassilière et al., 2013). En comparaison avec cette simulation, cet exercice per-
met de prendre aussi en considération l’impact positif de l’investissement public sur la fonction de pro-
duction du secteur privé.

La simulation de base correspond à une augmentation permanente, budgétairement neutre, des inves-
tissements des autorités publiques de 0,5% du PIB, ce qui correspond à un investissement supplémen-
taire de 2 milliards d’euros par an. Ce montant est conforme aux propositions belges pour la réalisation
du pilier des infrastructures publiques du Plan d’Investissement pour l’Europe. Dans le cadre de cette
première simulation, le PIB en volume augmente de 0,24% après un an et de 2,77% après 20 ans par
rapport au scénario de référence (en l’absence de choc). Cette croissance du PIB s’explique principale-
ment par une croissance de la productivité du travail, bien que l’emploi augmente aussi légèrement. La
consommation privée et l’investissement privé augmentent, après 20 ans, de 1,5% par rapport au scé-
nario de référence. Le déflateur du PIB s’accroît d’abord légèrement suite à l’augmentation de la de-
mande, puis à long terme, la croissance de la productivité fait diminuer les prix de la production do-
mestique de 1,3%, ce qui entraîne une baisse de l’inflation. Dans l’ensemble, une taxe forfaitaire par
personne stylisée (lump-sum tax) de 0,13% du PIB est nécessaire pour stabiliser les finances publiques
au niveau actuel. Cela exclut la possibilité d’une mesure autofinancée (appelée “free lunch” fiscal) qui
se traduirait par une taxe forfaitaire individuelle égale ou inférieure à 0. En même temps, vu la crois-
sance économique générée, seul un quart du montant investi doit être couvert par de nouvelles recettes
publiques.

                                                                                                          3
WORKING PAPER 1-17 Des simulations supplémentaires ont été effectuées pour vérifier dans quelle mesure les résultats chan- gent lorsque la mesure est financée soit par un impôt plus réaliste (sur le travail, le capital ou la con- sommation), soit par une réduction de la consommation publique, soit par une augmentation de la dette publique. À long terme, le financement par dette ou par augmentation de l’impôt sur la consommation s’avère avoir presque le même impact positif sur le PIB que la taxe stylisée de la simulation de base, soit 2,69%. Les résultats du scénario de l’impôt sur la consommation sont cependant susceptibles d’être su- restimés vu que le modèle n’inclut pas entièrement le mécanisme belge de formation des salaires. Lors- que la mesure est financée par une réduction des autres dépenses publiques, le PIB augmente toujours, après 20 ans, de 2,43% par rapport au scénario de référence. Un impôt sur les revenus du travail ou du capital réduit le plus les effets positifs, au moins en ce qui concerne le PIB, limitant ainsi sa croissance à respectivement 1,69% et 1,89%. Le premier nuit principalement à l’emploi et à la consommation privée, tandis que le second conduit à une chute des investissements privés. La consommation privée est maxi- male lors d’une réduction des autres dépenses publiques parce que ce scénario ne mène pas à un ac- croissement des impôts ou de la dette publique (c’est-à-dire à des impôts différés). Si seul est pris en compte le financement par endettement, la dette publique augmente et le ratio de dette sur PIB atteint 112% après 20 ans, rendant l’évolution des finances publiques insoutenable. Cette comparaison doit, bien sûr, être interprétée avec la prudence nécessaire : d’une part, les différents mécanismes de finance- ment ont été modélisés de façon stylisée et d’autre part, le PIB et la consommation privée, certainement au sein d’un modèle économique, ne rendent que partiellement compte du bien-être des ménages. Partant de l’observation que les investissements en infrastructure ont un effet plus important sur le PIB que les autres investissements publics (hôpitaux et écoles, biens publics et redistribution), un change- ment dans les dépenses en faveur des infrastructures a été simulé. Déjà après 3 ans, ce scénario aboutit à une croissance du PIB de 1,2% par rapport au scénario de référence. De plus, budgétairement neutre au départ, ce changement génère des recettes additionnelles qui peuvent être utilisées pour réduire la charge fiscale et/ou le ratio de la dette publique. Enfin, des analyses de sensibilité ont été menées pour les paramètres les plus importants de l’étude. Comme attendu, l’effet du paramètre représentant l’impact de la croissance du capital public sur la croissance de la production, communément appelé élasticité de la production par rapport au capital public, est crucial pour ces conclusions. Une estimation plus modérée (inférieure de 50%) donnerait, dans la simulation de base, une croissance du PIB après 20 ans d’à peine 1,48% contre 2,77%, tandis qu’une augmentation de la valeur du paramètre de 50% pousse la croissance à 4,2%. En conséquence, bien que la valeur utilisée dans la simulation de base ait été choisie avec prudence et se situe au milieu de l’intervalle des estimations empiriques, la prudence est de mise quant à l’interprétation de ces résul- tats. En conclusion, la simulation suggère qu’augmenter l’investissement des autorités publiques en Bel- gique soutient la croissance du PIB, de la consommation privée et de l’investissement privé sans effet inflationniste. Cette augmentation ne s’autofinance cependant que partiellement et une compensation budgétaire est donc nécessaire pour empêcher un accroissement de la dette publique. Les priorités d’ordre politique devraient déterminer quel mécanisme de financement doit être adopté. Enfin, une simple réallocation des investissements publics en faveur des infrastructures, sans moyens budgétaires additionnels, a déjà un effet positif assez substantiel sur le PIB et ses principales composantes. 4
WORKING PAPER 1-17

Synthese

Kunnen bijkomende overheidsinvesteringen in België de economische groei aanzwengelen? Die vraag
kwam recent in de schijnwerpers te staan door aanbevelingen in die zin van internationale organisaties
zoals de Europese Commissie en het IMF. Daartegenover staat de vaststelling dat de overheidsinveste-
ringen in België zijn gedaald van jaarlijks gemiddeld 5% van het bbp in de jaren zeventig tot 2,4% van
het bbp in 2015. Sinds het einde van de jaren tachtig zijn de bruto-investeringen niet altijd toereikend
geweest om de afschrijving van het reeds bestaande publieke kapitaal op te vangen. Zo is het netto
kapitaal in overheidshanden sinds 1995 gedaald met bijna 15 procentpunt tot 36,5% van het bbp in 2015,
een niveau dat aanzienlijk lager ligt dan dat van de ons omringende landen. De overheidsinvesteringen
zijn niet alleen gedaald, maar de samenstelling ervan is ook veranderd. Het aandeel van de infrastruc-
tuurinvesteringen, die worden beschouwd als het type overheidsinvesteringen met de grootste poten-
tiële weerslag op de economische groei, daalde van 35% in 2006 tot 26% in 2014. Als gevolg daarvan
bedroegen de Belgische overheidsinvesteringen in infrastructuur 0,6% van het bbp in 2014, tegenover
bijna 1% in de eurozone.

Om meer duidelijkheid over dit vraagstuk te krijgen, werden de gevolgen van een stijging van de over-
heidsinvesteringen op de Belgische economie in kaart gebracht met behulp van het QUEST III-model
van de Europese Commissie, dat werd geüpdatet om rekening te houden met de huidige toestand van
het land. Het belangrijkste voordeel van dat model is dat er een versie van bestaat die specifiek is toe-
gespitst op België, met inbegrip van de economische banden met de rest van de eurozone en de rest van
de wereld.

Het FPB kent een lange traditie in het berekenen van de impact van economische schokken op de Bel-
gische economie. In vroegere toepassingen werd het door de vraag gedreven model HERMES gebruikt
om een publieke investeringsschok te simuleren (zie Bassilière et al., 2013). In vergelijking met deze
eerdere simulatie, laat de huidige oefening toe om ook de positieve impact van overheidsinvesteringen
op de productiefunctie van de private sector in rekening te brengen.

De basissimulatie van de studie bestaat uit een permanente, budget-neutrale verhoging van de over-
heidsinvesteringen met 0,5% van het bbp, wat neerkomt op een bijkomende investering van ongeveer
2 miljard euro per jaar. Dat bedrag is gebaseerd op de Belgische voorstellen om invulling te geven aan
de pijler publieke infrastructuur van het Europese Investeringsplan. Volgens de resultaten van de si-
mulatie stijgt het bbp met 0,24% na één jaar en met 2,77% na twintig jaar, in vergelijking met de start-
waarde. Die stijging is grotendeels toe te schrijven aan een hogere arbeidsproductiviteit, en in mindere
mate aan een hogere tewerkstelling. Zowel de particuliere consumptie als de particuliere investeringen
stijgen met 1,5% van het bbp ten opzichte van de startwaarde na twintig jaar. De bbp-deflator neemt
aanvankelijk licht toe door de toenemende vraag, maar op langere termijn zorgt de productiviteitsgroei
voor een daling van het prijspeil van de binnenlandse productie met 1,3%, waardoor de maatregel een
remmend effect heeft op de inflatie. Om de overheidsfinanciën stabiel te houden op het huidige niveau,
is een gestileerde hoofdelijke (lumpsum) belasting) nodig van 0,13% van het bbp. Daaruit blijkt dat de
maatregel zichzelf niet zou financieren (een zgn. fiscale ‘free lunch’), want dan zou de hoofdelijke be-
lasting kleiner of gelijk aan nul zijn. Toch zorgt de economische groei die uit die maatregel voortvloeit

                                                                                                        5
WORKING PAPER 1-17 ervoor dat voor slechts een kwart van het geïnvesteerde bedrag effectief overheidsmiddelen moeten worden gezocht. Bijkomende simulaties werden uitgevoerd om na te gaan hoe die resultaten veranderen als de maatregel gefinancierd wordt door een meer realistische vorm van belasting (nl. op inkomen uit arbeid of kapitaal of op consumptie), door een besparing op de overheidsconsumptie of door de overheidsschuld te laten oplopen. Op lange termijn blijken schuldfinanciering en financiering via een hogere belasting op con- sumptie bijna dezelfde positieve effecten op het bbp te hebben als onder de gestileerde hoofdelijke be- lasting in de basissimulatie, nl. 2,69%. De resultaten met betrekking tot de consumptiebelasting vormen daarbij waarschijnlijk een overschatting omdat het specifieke loonvormingsmechanisme in België niet volledig in het model vervat zit. In het scenario waarbij de financiering gebeurt via een besparing op andere overheidsuitgaven, stijgt het bbp, met 2,43% na twintig jaar ten opzichte van de startwaarde. Belastingen op het inkomen uit arbeid en kapitaal beperken de positieve effecten – althans op het bbp – het meest. In dat scenario stijgt het bbp respectievelijk slechts met 1,69% en 1,89%. Het eerste belasting- type zet daarbij een rem op de extra tewerkstelling en particuliere consumptie, terwijl het tweede type de particuliere investeringen doet teruglopen. De particuliere consumptie is dan weer maximaal in het scenario waarbij op de overheidsconsumptie wordt bespaard, omdat dat geen bijkomende belastingen of overheidsschuld (beschouwd als uitgestelde belastingen) met zich meebrengt. Wanneer de financie- ring enkel via schuld gebeurt, loopt de overheidsschuld op en bedraagt de schuldgraad 112% na twintig jaar, waardoor de overheidsfinanciën dus onhoudbaar worden. Deze vergelijking moet uiteraard met de nodige voorzichtigheid worden geïnterpreteerd: enerzijds zijn de verschillende types van financie- ring op een gestileerde manier vormgegeven, terwijl anderzijds het bbp en de particuliere consumptie – zeker binnen een economisch model – maar tot op zekere hoogte de welvaart van de bevolking weer- geven. Uitgaande van de vaststelling dat infrastructuurinvesteringen een groter effect op het bbp hebben dan andere overheidsinvesteringen, werd een shift binnen de investeringsuitgaven gesimuleerd waardoor relatief meer in infrastructuur wordt geïnvesteerd en minder in andere domeinen (ziekenhuizen en scholen, publieke goederen en herverdeling). Dat scenario leidt al na drie jaar tot een bbp-groei van 1,2% ten opzichte van de startwaarde. Waar de verschuiving aanvankelijk budgetneutraal is, leidt ze bovendien tot hogere inkomsten voor de overheid, waardoor de belastingdruk en/of de schuldgraad kan worden verlaagd. Ten slotte werden gevoeligheidsanalyses uitgevoerd voor de parameters die heel belangrijk zijn voor deze oefening. Niet onverwacht is vooral het effect van de parameter die de impact weergeeft van hoger publiek kapitaal op de outputgroei, de zgn. outputelasticiteit van publiek kapitaal, cruciaal voor de bevindingen die worden gepresenteerd. Een conservatievere schatting ervan (50% lager) zou het bbp in het basisscenario slechts met 1,48% in plaats van 2,77% doen toenemen na twintig jaar, terwijl een ver- hoging van de waarde van de parameter met 50% leidt tot een groei van 4,2%. Hoewel de waarde die werd gebruikt voor de basissimulatie met zorg werd gekozen en zich in het midden van het bereik van de empirische schattingen bevindt, moeten die resultaten met voorzichtigheid worden geïnterpreteerd. Bij wijze van conclusie suggereert de simulatie dat een stijging van de overheidsinvesteringen in België leidt tot een toename van het bbp, de particuliere consumptie en de particuliere investeringen, zonder 6
WORKING PAPER 1-17

extra prijsstijgingen te veroorzaken. De maatregel financiert zichzelf echter slechts gedeeltelijk, zodat
deels ook bijkomende overheidsmiddelen moeten worden gezocht om een stijging van de overheids-
schuld te vermijden. Via welke weg de financiering dient te gebeuren, hangt af van de beleidsprioritei-
ten. Ten slotte zou een loutere verschuiving tussen verschillende types overheidsinvesteringen in de
richting van meer infrastructuur, zonder bijkomende budgettaire middelen, reeds een aanzienlijke po-
sitieve impact hebben op het bbp en zijn belangrijkste componenten.

                                                                                                        7
WORKING PAPER 1-17
Introduction
In response to the long-lasting effects of the Great Recession on the potential growth of the Member
States, the European Union considers the recovery in investment as a priority. The European Commis-
sion has operationalised this priority into the Investment Plan for Europe (IPE) aiming at fostering gov-
ernment and business investment in Member States. At the same time, pressures on the Member States
have increased in the context of the European Semester with more Country Specific Recommendations
(CSRs) related to investment. Belgium does not form an exception to this rule and the third recommen-
dation addressed to Belgium by the Council of the European Union in July 2016 included: ‘(…). Address
shortfalls in investment in transport infrastructure and energy generation capacity.’ The increase in
government investment is however conditioned by the sustainability of public finances which imposes
a sound path to the public deficit and debt-to-GDP ratios.
The Federal Planning Bureau has a long experience of simulating the impact of policy measure on the
Belgian economy based on a demand-driven macro-econometric model, HERMES. In Bassilière et al.
(2013), the impact of a permanent increase in public investment over an eight-year period was pre-
sented. However, in this simulation, the potential positive supply-side effect of public investment was
not investigated1. To take on board the impact of public investment on the production function of the
private sector, another family of models should be mobilised.
This working paper examines the economic effects on the Belgian economy of a structural realistic in-
crease in government investment, using the European Commission’s QUEST III model, slightly modi-
fied to better correspond to the current situation. It is found that beyond the short term positive impact
on GDP through the demand channel, the increase in government investment also boosts the long-term
growth through the positive impact on productivity and, to a lesser extent, on labour utilisation. The
increase in government investment also crowds in private sector investment. The boost of potential
output prevents overheating and inflation decreases after a limited, temporary swell. The fiscal impact
in terms of public deficit rate is less than one-on-one, reflecting the positive effects of government in-
vestment increase on demand in the short run and on productivity in the long run. However, a tax is
required to keep the debt-to-GDP ratio from rising. The increase in government investment is thus not
fully self-financed (i.e. there is no fiscal free lunch).
The paper is organised as follows. After a first section devoted to the clarification of the different con-
cepts usually used in the literature, the second section allows to underline the strong decrease in the
Belgian government investment rate since the beginning of the seventies and the changes in the com-
position of this investment at the expense of infrastructure investment. In the third section, a brief sur-
vey of the relevant transmission channels identified by the literature is done. In the fourth section, a
description of the QUEST model’s most important relationships is provided and calibration issues are
discussed. The main results of a structural increase in the government investment by 0.5% of GDP are
commented in the fifth section. Alternative simulations are also presented which explores the results of
different financing modes and of a shift between different types of government investment. The sixth
1 Annex B in this paper gives a small overview of the HERMES model. It makes the point that the model is a medium-term
model, giving prevalence to demand aspects.
8WORKING PAPER 1-17
section presents the sensitivity analysis of the results in function of different values for important pa-
rameters of the model, such as the output elasticity of public capital, the elasticity of substitution of
imports and domestic production or the proportion of liquidity constrained households. Finally, the last
section concludes and discusses the analysis’ limitations as well as directions for further research.
The authors thank the teams Public finances and Sectoral and environmental accounts and analyses for
their valuable help.
9WORKING PAPER 1-17
1. Definitions
In most empirical papers on public investment, different terms are used as synonyms although they
cover very different realities. These terms are government investment, public investment or infrastruc-
ture investment. To avoid such a confusion, it is useful to choose a statistically well-defined concept.
General government gross fixed capital formation is the central concept of this working paper. This
concept corresponds to investment of all public administrations included in the institutional sector
‘General government’, S13, as defined by Eurostat under the conceptual framework of the European
System of National and Regional Accounts (ESA 2010) and of the Manual on Government Deficit and
Debt – Implementation of ESA2010.2
According to ESA2010 (§ 3.124), ‘gross fixed capital formation consists of resident producers’ acquisi-
tions, less disposals, of fixed assets during a given period plus certain additions to the value of non-
produced assets realised by the productive activity of producer or institutional units. Fixed assets are
produced assets used in production for more than one year’. The gross term means that investment is
measured before the deduction of consumption of fixed capital (depreciation). The gross fixed capital
formation does not include usual maintenance costs of installed capital but only major improvements
to a fixed asset. Maintenance expenditures are recorded as current expenditures (government consump-
tion) and are thus not included in government investment (European Commission, 2016b).
The General government sector has four subsectors: Central government, State government, Local gov-
ernment and Social security funds.
Statistics on General government investment are directly available in national accounts for each Mem-
ber State. They are ventilated according to the UNSD classification of functions of government (COFOG),
replicated in ESA2010. This classification distinguishes 10 main functions: General public services, De-
fence, Public order and safety, Economic affairs, Environment protection, Housing and community
amenities, Health, Recreation, culture and religion, Education and Social protection. The importance of
government investment in each of these functions depends on the subsector of government considered.
Contrary to what is often thought, all entities controlled by government are not statistically classified in
S13 generally because these entities are considered as ‘market producer’ by the ESA rules. The national
railway company (NMBS/SNCB) or gas and water grid companies such as FLUXYS or VIVAQUA are
2 The general government sector consists of institutional units which are non-market producers whose output is intended for
individual and collective consumption, and are financed by compulsory payments made by units belonging to other sectors,
and institutional units principally engaged in the redistribution of national income and wealth (ESA 2010 § 2.111). The insti-
tutional units included to general government sector (S.13) according to ESA 2010 (§ 2.112) are the following: a) general gov-
ernment units which exist through a legal process to have judicial authority over other units in the economic territory, and
administer and finance a group of activities, principally providing non-market goods and services, intended for the benefit
of the community; b) a corporation or quasi-corporation which is a government unit, if its output is mainly non-market and
a government unit controls it; c) non-profit institutions recognised as independent legal entities which are non-market pro-
ducers and which are controlled by general government; and d) autonomous pension funds, where there is a legal obligation
to contribute, and where general government manages the funds with respect to the settlement and approval of contributions
and benefits.
10WORKING PAPER 1-17
examples of companies owned by government but classified outside the S13 sector. The National Ac-
counts Institute (NAI) publishes the list of these entities on its website.3 The delimitation of the general
government sector perimeter is of main importance in the context of the fiscal surveillance procedure
of the European Union. The general government perimeter has been recently enlarged notably by in-
cluding highly indebted social housing companies and by incorporating entities or operations bearing
future liabilities (e.g. investment aid granted to hospitals and PPP’s projects, see Box 1). This broadening
led to an increase in both the deficit and public debt, impacting at the same time the sustainability of
public finances. Public sector investment in broad terms could then be defined as investment of general
government augmented by investment of all these entities controlled by government. There is no di-
rectly available statistic on this concept.
Box 1 Public Private Partnerships (PPPs): an alternative way to stimulate government
investment in infrastructure?
The launch of the Investment Plan for Europe (IPE) has renewed the interest for the public private partner-
ship in large infrastructure projects. The IPE objective is indeed not only fostering government investment
but also mobilizing private capital and expertise. The recording of PPPs on or off the government sector
perimeter (S13) has attracted increased attention in this context, particularly in countries where public debt
is already at a high level. The lack of clarity on the rules followed by Eurostat has hampered the development
of such projects. A Belgian example of this problem is given by the debate surrounding the tram infrastruc-
ture PPP for the city of Liège. Eventually, in September 2016, Eurostat and the European PPP Expertise
Centre published an exhaustive guide to the statistical treatment of PPPs that allows to anticipate more
easily the accounting classification (in or out S13) of a given PPP project. However, this needed clarification
of rules is not a sufficient condition to launch a wave of infrastructure PPPs in countries such as Belgium
which are continuously under the threat of the excessive deficit procedure of which criteria have not been
changed.
Contrary to a common misunderstanding, all government investments are not infrastructure invest-
ments and all infrastructure investments are not only realised by the government sector. Part of gov-
ernment investment, for instance, consists of buildings for its administration which are not considered
as an infrastructure investment, while the electrical infrastructure investment in Belgium is mainly de-
veloped by private sector enterprises.
As there is no generally-accepted definition of infrastructure, we start with the definition of infrastruc-
ture as physical or intangible assets (see Box 2) constitutive of utilities and facilities that provide essen-
tial services and help drive economic growth. Two categories of infrastructure are identified:
– Utilities: covering infrastructure in energy, communications, water and waste management;
– Transport infrastructure covering assets such as airports, roads, seaports or rails.
Based on this definition and following Bom and Ligthart (2014), it is then possible to identify the share
of government investment devoted to infrastructure using the COFOG classification.4 However, to put
these figures into perspective, it is useful to know the infrastructure investment of the whole economy,
investment implemented both by the public and the private sector. Indeed, there are large differences
in public-private sharing of infrastructure investment between countries.
3 http://inr-icn.fgov.be/fr/content/comptes-nationaux-et-regionaux
4 Adaptation of Bom and Ligthart (2014) definition of infrastructure to the new ESA leads to consider as infrastructure the
following COFOG codes: 04.3, 04.4, 04.5, 04.6, 04.8, 05.1, 05.2 and 06.03 (see Annex A, Table A.1)
11WORKING PAPER 1-17
Box 2 Tangible and intangible assets
Among the categories of assets included in national accounts as investment, R&D, Computer software and
databases and Other intellectual property products are the only intangible assets taken into consideration.
However, intangible assets could also incorporate other assets such as advertising, design, market research,
organisational capital and training as underlined by Corrado, Hulten and Sichel (2005, 2009).
The SPINTAN (Smart Public Intangible) project funded by the seventh framework program of the European
Union aims at building a public intangible database for 22 EU countries and the United-States over 1995-
2012. When taken into account, these intangible assets not yet included in national accounts increase gov-
ernment investment with respect to the current estimate but this increase varies from a country to another.
The graph B1 illustrates the increase in general government investment in Belgium and in the three main
neighbouring countries over 1995-2012 when additional intangible assets identified by the SPINTAN project
are taken into consideration.
Graph B1 Increase of General government investment due to additional intangible assets in % of General
government Investment (national accounts concept)
25
20
15
10
5
0
1995 1996 1997 1998 1999 2000 2001 2002 2003 2004 2005 2006 2007 2008 2009 2010 2011 2012
BE DE FR NL
Source: SPINTAN database.
The increase in government investment is the smallest in Belgium (only 2.8% in 2012) and the largest in
Germany with an increase of 22% in 2012. The organisational capital accounted for the largest share of
additional intangible assets in the Netherlands (69% in 2012), in Belgium (57%) and in France (52%) while in
Germany, it was the training (68% in 2012).
52%
Measuring infrastructure investment for the whole economy requires a different approach than the one
adopted for measuring government infrastructure investment. Indeed, the classification of expenditures
by function (COFOG) is only available for the government. In national accounts, gross fixed capital
formation of the whole economy is ventilated by industries and by assets. The main categories of assets
are Dwellings, Non-residential buildings & other structures, Transport equipment, Computer & hard-
ware, Telecoms, Other machinery and equipment & weapon systems, Cultivated biological resources,
Research and development, Computer software and databases and Other intellectual property products.
Based on these categories, we can define infrastructure investment in a prudent way as investment in
Other structures, corresponding principally to transport infrastructure and Telecoms.5 Infrastructure in
5 The asset ‘Other structures’ includes roads and railways; construction works for roads and railways (bridges and tunnels
included), constructions and construction works for utility projects for fluids, for electricity and telecommunications, for wa-
ter projects, for other civil engineering projects n.e.c., demolition and site preparation works and other specialized construc-
tion works.
12WORKING PAPER 1-17
energy and in water and waste management cannot be identified as such by lack of detailed data cross-
ing industries and assets. This definition of infrastructure can underestimate transport infrastructure
investments by not including public or private investments realized in other relevant assets such as non-
residential buildings (railway stations…) or overestimate the infrastructure investment by including
telecoms that are not linked to infrastructure. Even if this definition by assets has limitations, it seems
more precise than an approach by industry, as proposed for example by the European Commission
(2016a). Indeed, public investment, notably in roads, are classified either in Transportation and storage
(HH) or in Public administration (OO) across Member States. Moreover, a non-negligible part of invest-
ment of these two industries are not infrastructure investment.
13You can also read