Q&A A Ticket to Ride Central Bank Digital Currency House Price Booms, Then and Now Research Update Data in Focus - Federal Reserve ...
←
→
Page content transcription
If your browser does not render page correctly, please read the page content below

F EDERAL R ESERVE B ANK   OF   P HILADELPHIA

                                Second Quarter 2020
                                Volume 5, Issue 2

                                A Ticket to Ride

                                Central Bank
                                Digital Currency

                                House Price Booms,
                                Then and Now

                                Research Update

                                Q&A
                                Data in Focus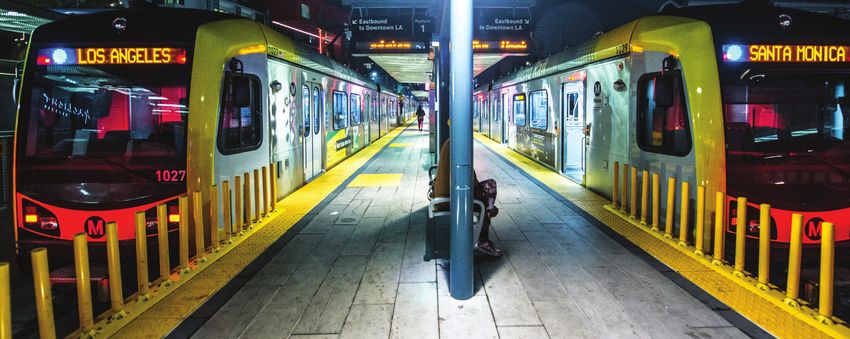
Contents
Second Quarter 2020 Volume 5, Issue 2
                                              1    A Ticket to Ride: Estimating the Benefits of Rail Transit
                                                   From 1990 to 2000, Los Angeles spent $8.7 billion to build 46 train stations and four
                                                   rail lines. Chris Severen calculates their commuting and noncommuting benefits.

                                              10   Central Bank Digital Currency: Is It a Good Idea?
                                                   A central bank digital currency may be the next big thing in personal banking. Daniel
                                                   Sanches evaluates the costs and benefits of this new technology for individuals,
                                                   banks, and the entire economy.

A publication of the Research
Department of the Federal
Reserve Bank of Philadelphia
                                              16   House Price Booms, Then and Now
                                                   In the early 2000s, house prices boomed—and then crashed—in some places more
Economic Insights features                         than others. Burcu Eyigungor evaluates two competing explanations and explores
nontechnical articles on monetary                  the likelihood of a repeat.
policy, banking, and national,
regional, and international
economics, all written for a wide
audience.                                     22   Research Update
                                                   Abstracts of the latest working papers produced by the Philadelphia Fed.
The views expressed by the authors are not
necessarily those of the Federal Reserve.

The Federal Reserve Bank of Philadelphia
helps formulate and implement monetary
policy, supervises banks and bank and         28   Q&A…                                         29         Data in Focus
savings and loan holding companies, and            with Chris Severen.                                     GDPplus.
provides financial services to depository
institutions and the federal government. It
is one of 12 regional Reserve Banks that,
together with the U.S. Federal Reserve
Board of Governors, make up the Federal
Reserve System. The Philadelphia Fed
serves eastern and central Pennsylvania,
southern New Jersey, and Delaware.                 About the Cover
                                                   Tariff

                                                   A tariff is a tax placed on imports. This issue's cover depicts the economic costs and
                                                   benefits of tariffs. The horizontal axis represents the amount of a good consumed by
                                                   an economy; the vertical axis represents its price. The bottom horizontal line
                                                   represents the price and supply of that good if there is no tariff. As you can see, with-
                                                   out a tariff, there's plenty of supply at a rather low price. A tariff, however, should
                                                   raise the price and decrease the supply. Each of the upper two horizontal lines
                                                   represents a different tariff level. In other words, a tariff lifts the horizontal line—and
                                                   thus the price—to its new location, but it also reduces consumption of that good.
Patrick T. Harker                                  This graphic helps economists measure the new tariff's consumer loss, producer
President and
Chief Executive Officer                            gain, and government revenue gain—each of which is depicted by different, and at
                                                   times overlapping, polygons.
Michael Dotsey
Executive Vice President and
Director of Research

Adam Steinberg                                     Connect with Us
Managing Editor, Research Publications
                                                        We welcome your comments at:             Twitter:
Brendan Barry                                           PHIL.EI.Comments@phil.frb.org            @PhilFedResearch
Data Visualization Manager
                                                        E-mail notifications:                    Facebook:
Natalie Spingler
                                                        www.philadelphiafed.org/notifications    www.facebook.com/philadelphiafed/
Data Visualization Intern
                                                        Previous articles:                       LinkedIn:
ISSN 0007–7011                                          www.philadelphiafed.org/research-and-    https://www.linkedin.com/company/philadelphiafed/
                                                        data/publications/economic-insights
Photo: anouchka/iStock

                                                                                                                             Chris Severen is a senior economist at the
                                                                                                                             Federal Reserve Bank of Philadelphia. The views
                                                                                                                             expressed in this article are not necessarily
                                                                                                                             those of the Federal Reserve.

                         A Ticket to Ride
                         Estimating the Benefits of Rail Transit
                         Starting in 1990, Los Angeles County built a new and expensive
                         rail transit system. Now we can calculate the costs and benefits.

                         BY C H R I S S E V E R E N

                         T
                                 ransportation infrastructure shapes the spatial                                  in the U.S., where many cities are polycentric (they
                                 fabric through which we thread our daily travel.                                 have many employment centers rather than a single
                                 How do we get to work or to school? Where                                        urban core) and typically not very dense.1 These
                         do we go shopping? How long does it take to meet up           LA METRO RAIL IN 2000
                                                                                                                  factors limit how easy it is for rail transit to connect
                         with friends? Is it worth driving or taking rideshare?        Lines       Stations       home to work and other destinations. It is difficult
                         Public transit systems—including buses, streetcars,
                         rail lines, and ferries—play a key role in determining
                                                                                       4           46             to cost-effectively serve a disperse population that
                                                                                                                  travels to disperse locations with public transit.
                                                                                       Average Weekday
                         our daily travel patterns. Rail transit (subways, light                                  Further, rail transit infrastructure tends to be very
                         rail, and regional rail) has traditionally been import-       174,554
                                                                                       Ridership
                                                                                                                  costly in the U.S.
                         ant in older northeastern cities like New York and                                          In this article, I discuss why mobility is important
                         Philadelphia. Since the 1970s, though, many other                                        and provide an overview of the different ways
                         cities in the U.S. have sought to increase the mobility       860,579
                                                                                       Passenger miles
                                                                                                                  economists measure the benefits of transit infrastruc-
                         available to their residents by building rail transit                                    ture. I then describe my hybrid approach, in which I
                         infrastructure, too.                                          Source: 2000 National      combine three of these methods to study the value of
                             Building rail is costly and requires large initial        Transit Database.          rail transit in Los Angeles.2 I conclude by conducting
                         public investment. Do the benefits of rail infrastruc-                                   a cost-benefit analysis of the first wave of Los Angeles
                         ture outweigh their high costs in younger, more                                          Metro Rail and interpreting the results of this analysis.
                         automobile-oriented cities? This is an open question

                                                      A Ticket to Ride: Estimating the Benefits of Rail Transit
                                                                                                        2020 Q2
                                                                                                                            Federal Reserve Bank of Philadelphia
                                                                                                                                          Research Department             1
Why Does Mobility Matter?                                              Transit is valuable also because it enables mobility
Mobility allows people to access places. The more                  without automobiles. Some people, because of age,
mobile they are, the more options they have: They can              disability, or preference, are unable to drive auto-
get to more jobs or schools and choose between                     mobiles.9 Automobiles can be very costly; households
more places to shop and find services. Being able to               with automobiles on average spend 4.3 times as much
access many different workplaces, consume varied                   on transportation as households that do not use
goods, and meet with lots of different people is one               automobiles.10 There are other consequences of auto-
of the big advantages of living in a city. (Before the             mobile use: They are land- and energy-intensive. The
modern era of automobile and rail infrastructure—that              average energy cost for automobiles is about 3,180
                                                                                                                                      Transportation Spending
is, when everyone walked or traveled by horse—most                 British thermal units (BTUs) per passenger mile, while             for Automobile-Owning
firms were small and people worked and consumed                    urban subways and light rail use only 24 percent of                Households
more locally.3) Even our network of friends depends                that energy per passenger mile.11 Moreover, cities with            ×4.3
                                                                                                                                      compared to nonowning
on the transportation network.4                                    subways tend to be denser, so the average trip distance
                                                                                                                                      households
    Greater mobility allows cities to be larger, enabling          is shorter.12 Because cities that rely on the automobile
                                                                                                                                      Energy Cost of
the comparative advantage of cities in productivity,5              tend to contain more low-density development,                      Automobiles
and one of the most important components of urban
mobility is commuting: how workers get to their
                                                                   they have a higher carbon footprint.13 Finally, auto-
                                                                   mobile use can lead to severe congestion in cities,
                                                                                                                                      3,180
                                                                                                                                      BTUs per passenger mile
jobs. Cities let workers connect with a variety of jobs,           causing substantial delays and decreasing mobility in              Energy Cost of Urban
and firms with a variety of workers. Diverse, pro-                 some settings (Figure 1).                                          Subways and Light Rail
ductive labor markets make cities the engines of                                                                                      763
economic growth.6                                                                                                                     BTUs per passenger mile
    Commuting behavior depends on available                        How to Quantify the Benefits of Transit                            Density Decreases from
transportation infrastructure. Indeed, much trans-                  Economists use several methods to evaluate the ben-               Downtown
                                                                                                                                      ‘000 people/mi² vs. miles
portation infrastructure is designed with peak                      efits of transportation infrastructures, and rail transit         from city hall, 2010
commuting capacity in mind. (Commuting is, after                    in particular. Each method has both advantages and                Philadelphia vs
all, an everyday activity essential to the function of              disadvantages.                                                    Los Angeles
urban economies.) People and firms benefit when                                                                                       Population
                                                                                                                                      35
this transportation infrastructure makes commuting
easier. As an extreme example, in their 2015 paper                 Hedonics
Ferdinando Monte and his coauthors calculated that                 The hedonic approach compares real estate prices
prohibiting commuting across county lines would                    near and far from rail. The intuition is that if (identical)
                                                                                                                                       0
decrease aggregate welfare by 7.2 percent, and the                 people value transit, they are willing to pay more to                   1       Miles      55
effect in central cities (like Manhattan) would be even            live near sites of transit access (like subway stations).
                                                                                                                                      Source: U.S. Census.
greater. Better transportation infrastructure can                  This increases the demand for residences near transit
directly increase employment growth. In their 2012                 stations, which then increases the price of nearby
paper, Duranton and Turner showed that cities with                 housing. This is particularly true if the supply of hous-
more highways in 1983 gained substantially more                    ing is relatively fixed, and if transit connects people
employment by 2003 than cities with fewer highways.7               to where they want to go.
And transportation infrastructure can address (or                     In practice, there are several challenges to simply
exacerbate) certain inequalities. For example, long                comparing home prices next to and far from transit.
and challenging commutes may affect women more                     Houses or neighborhoods near transit are often sub-
than men: Women tend to work less in cities with                   stantially different from those further away; they may
very high congestion and long commutes (like New                   be older (or newer), denser, or surrounded by a dif-
York City) than in cities where commuting is relatively            ferent set of urban amenities (such as restaurants and
easy (like Minneapolis).8                                          schools). Real estate prices also reflect expectations

FIGURE 1

Commuting Modes Compared
Autos' flexible departure times come at the price of congestion.
Commuting by Subway or Light Rail                                               Commuting by Automobile
                                                                                                                               Commuters have a wider range
                                                                                                                               of times in which to travel
Scheduled                                        Scheduled arrival times
departure times:                                 to fixed locations              Commuting by auto
Commuters can                                                                                                                                  Congestion:
                                                                                 means one can                                                 Rush hour traffic
travel only at                                                                   depart at anytime
specific intervals                                   Consistent travel times                                                                   may extend total
                                                                                 from anywhere                                                 travel times
from fixed places

                                    Time                                                                           Time

2             Federal Reserve Bank of Philadelphia
              Research Department
                                                                   A Ticket to Ride: Estimating the Benefits of Rail Transit
                                                                   2020 Q2
about future change. This muddies the interpretation of price               Rail transit does this in a different way than roads, concentrating
gradients near transit. If prices increase in expectation of a transit      the benefits of access near transit stations.
station opening (that is, before it opens), it could simply be that            People’s choices about where to live and work reveal that
people expect increases in (nontransit) amenities nearby. So the            access is valuable. Aggregating the commuting behavior of people
belief that transit will generate value can make it appear that             who live in a neighborhood or work in a particular area yields
transit is valued.                                                          an interesting (though perhaps obvious) conclusion: On average,
   It can also be hard to separate the different effects of transit         closer locations have more commuting between them. Econ-
from real estate prices. There may be a mobility benefit that               omists call this phenomenon gravity, and they have started
people value, but some real estate price appreciation might                 building spatially explicit models that incorporate this behavior
instead be due to related transit-oriented development, as new              in powerful ways. By combining the notion of gravity with
and potentially valuable amenities (such as restaurants and                 modal choice and transportation data, researchers can estimate
stores) move into an area. Or there could be offsetting negative            the value of increased ease of travel due to transportation
effects of transit due to the possibility of noise, pollution, or           infrastructure.17
crime.14 At-grade transportation infrastructure can even serve as              This approach enables researchers to build relatively complex
a barrier separating neighborhoods from other nearby locations.15           economic models that capture many significant features of urban
Careful research design can overcome some of these challenges.16            economies. Moreover, these models typically capture how
   A final challenge with the hedonic approach is that it can               people move in response to changes in local neighborhoods or
be difficult to study demand linkages across space. If people               commutes. The fact that people move links the demand for
demand more housing near transit and prices rise, these higher              housing across space, and can cause local housing prices to
prices might cause some people to move to other slightly more               reflect changes in other neighborhoods. If this occurs, the hedonic
distant areas, increasing housing demand and prices in those                approach will not correctly value these local characteristics, but
neighborhoods. The hedonic approach typically compares places               these more complex models will.
with and without transit, and so it misclassifies places without               However, this literature has typically assumed that trans-
transit as unaffected even if they are indirectly affected by transit.      portation infrastructure only shifts travel outcomes, ignoring
                                                                            other effects it may have. As discussed above, transportation
                                                                            infrastructure can potentially change the quality of residential
Modal Choice                                                                amenities in a neighborhood or come packaged with zoning
Another method compares the relative proportions of people who              policies that increase (or decrease) housing supply. Another
use different commuting modes to get between similar locations.             challenge facing this literature is that it usually requires a big
(Automobile, bus, rail, and walking are all different modes.)               shock to a city to estimate the models. For example, in their
By comparing the characteristics (like travel time, average delays,         2015 paper Gabriel Ahlfeldt and his coauthors used the division
and cost) of the trips that take place on each mode, researchers            and reunification of Berlin to estimate their model. It can be
can calculate how much commuters value these characteristics.               challenging to study less extreme settings.
For some trips (or along some routes), transit is faster, while for
others cars are faster. Comparing these characteristics and
the number of people who choose each mode tells us how much                 A Combined Approach
people value fast travel, or how much benefit they receive                  Given the different strengths of each of these approaches, there is
from different trip characteristics. For example, many people               value in combining them. In my 2019 working paper, I bring
value listening to the radio while driving, or reading the paper            together components of these three methods to calculate the
(or checking Instagram) while riding the train or subway more               total benefits of rail transit. I use spatial data on commuting
than they value the speed of either option.                                 behavior to directly estimate the commuting effect of transit.
    An advantage of this approach is that it can be implemented             I then combine this with hedonic-type estimates of the residential
with a survey, so you can simply ask people about the charac-               and workplace effects. Finally, I put this all into a model to
teristics of the choices they face and perhaps even the reasons             account for other spillovers across space (Figure 2). The total
for the choices they make. One challenge with this approach is              effect can be decomposed as follows:
that researchers must typically assume that they have described                 Total Effect = (Commuting Effect + Residential Neighborhood
all the factors that underlie people’s decisions on how to com-             Effect + Work Neighborhood Effect) − General Equilibrium
mute. In practice, this can be hard. Many transit modes have                Adjustments
highly variable travel times or require waiting for long periods.               I study rail transit in the greater Los Angeles area (Los Angeles
Both are factors that people particularly dislike, yet both are             and adjacent counties), which has some features that make it
often ignored.                                                              particularly valuable as a research subject.

City Structure                                                             Transit in Los Angeles
A key tradeoff that drives city structure (and where households             The case of Los Angeles offers a number of useful features to
and firms choose to locate) is access versus price. Transportation          evaluate transit. First, greater Los Angeles had no subway or
infrastructure allows people better access to inexpensive land.             light-rail transit at the beginning of 1990, and it built a relatively

                             A Ticket to Ride: Estimating the Benefits of Rail Transit
                                                                             2020 Q2
                                                                                                   Federal Reserve Bank of Philadelphia
                                                                                                                 Research Department            3
FIGURE 2                                                        large system within 10 years.18 By 2000,           changes at locations A and B that might be
Decomposing the Total Effect                                    Los Angeles Metro Rail consisted of 46             caused by the transit station (as well as
There are intermediate steps between                            stations on four lines.19 This means that          any other changes that affect only A or B—
the opening of a transit station and an                         it is possible to compare the detailed             or C or D, for that matter).22 This isolates
increase in ridership.                                          geography of commuting in Los Angeles              the commuting effect, because the com-
                                                                before and after rail transit was available.       muting flow between connected locations
New Transit Station Opens in the Neighborhood
                                                                The relatively large system size matters,          is the only margin being shifted.
                                                                too. For statistical reasons, it is harder to          Still, one might worry that these places
                                                                detect incremental changes if a city adds          were connected specifically because plan-
                                                                a few stations (or one line) every decade.         ners believed they were most in need of
                                                                Furthermore, there are network effects             transit connections. If that were so (and if
                                 New transit station opens
                                                                to transit—the more stations there are             the planners were right), then changes
                                                                (or places that are connected), the more           between newly linked neighborhoods
                ← Downtown

                                                                useful the system is and the bigger the            might have happened anyway. I limit the
                                                                benefit.20                                         control group of neighborhoods (that
                                                                    There’s another reason to study Los            is, the tracts that did not receive transit
                                                                Angeles Metro Rail. It’s relevant for the          linkages) in a couple of different ways
                                                                many automobile-oriented cities consid-            to ensure that this is not the case. Both
People Begin to Move In
                                                                ering new subway or light-rail systems.            approaches rely on the historical anteced-
                                                                Los Angeles has historically been a poster         ents of Los Angeles Metro Rail to select
                                                                child for the automobile. It faces many            control neighborhoods that are similar
                                                                of the transportation issues common                to the neighborhoods that received transit
                                                                to cities that came of age during the auto-        linkages. One approach identifies plausible
                                                                mobile era.                                        locations for receiving rail by examining
                                                                                                                   streetcar and interurban rail lines present
                                                                                                                   in the 1920s.23 Subway and light-rail lines
                                                                Commuting and                                      often follow these rights of way, and they
                                                                Noncommuting Effects                               tend to align to allow lines to connect.
 −   Population              +
                                                                To measure the commuting effects of Los            The other comparison uses a historical
                                                                Angeles Metro Rail, I use Census Trans-            subway plan from 1925. This plan is more
                                                                portation Planning Project data on the             extensive than the subway that was built
New Restaurant Opens in the Neighborhood                        number of people who commute from                  and so shows many likely routes. Impor-
                                                                each residential neighborhood to each              tantly, these routes would have connected
                                                                workplace. I define a neighborhood as              historic employment centers and so are
                                                                a census tract, a unit of measurement used         less likely to reflect current factors influ-
                                                                by the Census Bureau.21 I use data for two         encing travel demand.
                                         New restaurant opens   years, 1990 and 2000, so that I can look               I find strong evidence of a substantial
                                                                at changes in how many people commute              impact of Los Angeles Metro Rail on
                                                                between two tracts. This helps limit the           commuting behavior. Pairs of neighbor-
                                                                confounding effects of other long-run              hoods connected by rail (that is, tracts
                                                                differences between neighborhoods (or              that both contain stations) experienced
                                                                pairs of neighborhoods). I compare the             a 15 percent increase in commuting
                                                                changes in commuting flows between pairs           between them. Pairs of neighborhoods
Home Prices Start to Increase                                   of tracts where both received transit              immediately adjacent to (but not con-
                                                                stations and pairs of tracts where at least        taining) stations saw a 10 percent increase
                                                                one did not.                                       in commuting. More distant places did
                                                                   Figure 3 describes the comparisons              not see a change (Figure 4). The effect
                                                                I make. Transit stations are built in both         is strongest for pairs of tracts connected
                                                                location A and location B. This means that         by the same subway or light-rail line.
                                                                both of the (directed) pairs AB and BA             (People do not like changing trains, espe-
                                                                receive transit. Locations C and D do not          cially when driving is the alternative.)
                                                                receive transit. In total, 10 different pairs      Being close to a station is more impor-
                                                                do not receive transit: AC, AD, BC, BD,            tant for the workplace location; people
                                                                CA, CB, CD, DA, DB, and DC. I compare              seem more willing to walk a moderate
 −     Prices                +                                  the average changes in the two pairs that          distance from home to a station than to
                                                                receive transit with the 10 pairs that do          walk the same distance from a station
                                                                not. Better yet, I can also purge the              to work. Results are consistent across

4               Federal Reserve Bank of Philadelphia
                Research Department
                                                                            A Ticket to Ride: Estimating the Benefits of Rail Transit
                                                                            2020 Q2
FIGURE 3
Comparing Effects of Transit Stations
By measuring the commuting flow between connected locations, this model isolates the commuting effect.
Compare the changes in these transit-linked commuting pairs…
Sites A and B A→B, B→A
both receive new
transit stations,
but neither Site C
Site C nor Site D
receives one.
A B
AB Transit Line to these commuting pairs without transit links.
A→C, C→A A→D, D→A B→C, C→B
C C
Site B
Site A
A A B
D
B→D, D→B C→D, D→C
Site D
C
Note: Locations A and B receive transit stations; C and D do not. B
D D
different comparisons, adding strength to their interpretation as
a causal effect.
Although my main analysis focuses on the period between
1990 and 2000 (because the data in this period are of the highest
quality), commuting may have continued to adjust after the
year 2000 in response to the transit linkages built before 2000
that I study. I test for this, and find that commuting between
these locations continued to grow relative to other unconnected FIGURE 4
neighborhoods by 6 to 11 percent over the next 15 years. This The Impact of Los Angeles Metro Rail
delayed effect could be due to slow habituation: It takes people
and the built environment a while to adjust to the new transit
From 1990 to 2000,
option. Alternatively, it could be due to the further growth of tracts linked by a rail line People care more about
the Los Angeles Metro Rail network after 2000.24 People value saw a 15% increase in working close to a station
commuting. Adjacent than living close to one.
transit more (and use it more) if it connects them to more places. tracts saw a 10%
There is also evidence of a small reduction in automobile increase. More distant
tracts saw no change.
congestion in areas served by rail transit. I compare changes in +10%
travel times between pairs of neighborhoods that both lie near
a transit station or line with those that do not. Pairs of neighbor- From 2000 to People prefer to not
+15% 2015, those change lines, especially if
hoods both within 2 kilometers of a transit line saw a 3 percent
links grew the alternative is driving.
reduction in travel time in the long run (though this finding is not by 6–10%.
the most robust).25 Census tract
Although I find evidence of commuting effects, I find little evi-
Source: Author’s calculations from Census Transportation Planning Project (CTPP)
dence of noncommuting effects. Residential locations did not, data.
on average, become nicer or worse off because of transit, and
workplaces did not become significantly more productive
because of transit. These results rely on comparisons between
a neighborhood that received a transit station and a neighborhood
A Ticket to Ride: Estimating the Benefits of Rail Transit
2020 Q2
Federal Reserve Bank of Philadelphia
Research Department 5that did not (rather than comparing a pair of neighborhoods I lightly modify the flexible model of consumer location choice
that received a transit linkage to a pair that did not), and so used by Ahlfeldt and his coauthors and apply it to the Los Angeles
depend more on identifying the correct control group for the setting (using the various estimates discussed above). The primary
comparisons. Nonetheless, there is little evidence of an effect, agents in the model are households, who must decide both
even when just comparing the neighborhoods most likely to where to live and where to work. When deciding where to live,
receive transit (as picked out by historic streetcar locations and they consider residential housing prices and how desirable the
the 1925 subway plan).26 neighborhood is. When deciding where to work, they look at
There is also little evidence of a barrier effect. Many trans- what the wages are and how desirable the workplace is. Finally,
portation projects separate neighborhoods that lie along either they also care about how hard it is to travel between a pair of
side of their routes, driving down the connections to nearby residential and workplace locations.
locations.27 However, the first Los Angeles Metro Rail lines were When transit enters and changes how nice a commute is, or
typically built along existing rail lines, underground, or in high- when the characteristics of a neighborhood change, people move.
way medians, and so they had little effect. The model makes predictions about the average behavior of
people (that is, it tells us where the new population lives but
not necessarily who moves where), and so accounts for spillovers
How Valuable Are These Commuting Effects? in location choice.30 Housing prices and wages then adjust in
To quantify the monetary value of these effects, I measure how response to these changes in where people want to live and work.
responsive people are to, first, the wages they receive in where
they choose to work and, second, the home prices they pay
in where they choose to live. The intuition works like this: If Cost-Benefit Comparison and Speculation
a 10 percent increase in wages induces 18 percent more people Now all the pieces are in place. The commuting effects are
to work in a location (holding other workplace characteristics measured, there do not appear to be other workplace or resi-
constant), then an 18 percent increase in commuting to a location dential effects, we have a way to translate these effects into
is equivalent to a 10 percent increase in wages.28 In fact, this 18 a money-equivalent amount, and we can account for general
percent value is what comes out of the analysis. equilibrium effects.
The hard part is ensuring that other changes in the workplace Combining these pieces, I estimate a benefit of between $109
or residential neighborhoods do not confound this measurement. million and $146 million annually by the year 2000. (The range
For example, if residential housing prices decline because local accounts for whether or not I include the benefits of reduced
school quality declines, the local residential population may congestion.) If I include the additional growth in commuting
decrease. Or if employment at the ports goes down because of from 2002 to 2015 between locations connected before 2000, the
less shipping due to trade conflicts, the remaining workers could total rises to an upper bound of $216 million annually by 2015.31
keep receiving the same wage. If I could not account for these These are purely commuting benefits; they do not account for
other factors, I might conclude that people like higher housing other travel benefits (such as easing travel for noncommuting
prices and do not care about how much money they make. trips) or environmental benefits. While these other benefits
Instead of directly trying to account for all the potential might be substantial, rail transit is often promoted and judged
factors that could influence these relationships, I try to find some- based on its effect on commuting.32
thing that affects local wages but does not depend on other local The total cost of the Los Angeles Metro Rail system built by
factors. I first calculate changes in how productive an industry is, 2000 was $8.7 billion.33 This can be converted to an annual cost
using wages and employment at the national level. I then equivalent of between $218 million and $635 million per year.34
calculate how much these changes impact each workplace neigh- Annual operating subsidies were about $162 million. (These are
borhood based on how much employment in that neighborhood operating expenses less fare revenue for heavy and light rail.)
was in each industry in 1990.29 Overcoming this challenge is By summing these numbers, I find that the total annual equiva-
a key part of my 2019 working paper, and it (or a similar parame- lent cost of Los Angeles Metro Rail as of 2000 was between $380
ter) is key to translating observed changes to a dollar equivalent million and $797 million per year.
in any modal choice or city structure approach. The high-end estimates for benefits are therefore about $216
million annually, while the lower end of the costs are at least
$380 million annually (Figure 5). This means that there is
General Equilibrium Effects a sizable discrepancy between the cost of the system and the
The final component of the analysis is to provide a way to ac- benefits it delivers even after 25 years.
count for spillovers across space. Changes in one neighborhood Why is this the case, and how generalizable is this conclusion?
can affect home prices in other neighborhoods throughout There are two items to consider: How could the benefits have
the city because those changes can prompt all households to been higher, and how could the costs have been lower.
reevaluate where they want to live, potentially leading some Some of the features that make Los Angeles useful to study
households to move between neighborhoods. This type of general mean that a suboptimal system was built. Instead of connecting
equilibrium effect is important to consider whenever there are the densest residential and workplace populations, the sub-
large changes to a local economy. way and light-rail system initially connected many areas between
6 Federal Reserve Bank of Philadelphia
Research Department
A Ticket to Ride: Estimating the Benefits of Rail Transit
2020 Q2FIGURE 5 which there was not a lot of commuting. Restrictive
Costs and Benefits of Los Angeles Metro Rail land-use regulations have likely inhibited further
Despite growth in commuting, there's a sizable development along these rail lines. At the same time,
discrepancy between costs and benefits. many features of Los Angeles (a polycentric, auto-
Range, millions of dollars mobile-oriented city without many high-density areas)
Benefits are common to other cities building rail transit.
Rail transit construction is generally expensive, and
some factors make Los Angeles particularly expen-
0 50 100 150 200 250 sive to build in: Earthquake risk, coastal flooding,
Additional benefit
including same line and challenging geography all increase costs. What's
2002–2015 growth more, it appears that rail infrastructure typically
in commuting
Costs costs more in the U.S. than in other places.35 The
Without annual operating subsidies understanding of why costs are high is still limited.
Unfortunately, transit planners are often forced to
cut costs by building transit in places where people
With annual operating subsidies do not really want to travel, creating a downward
spiral in usefulness.
By ridership numbers alone, Los Angeles Metro Rail
0 200 400 600 800
is actually performing better than the rail transit
Benefits vs. Costs systems of many other similar cities. In building
a relatively large network that begins to cover a geo-
graphically large cosmopolis, Los Angeles Metro
0 200 400 600 800 Rail could serve as the basis of a large transit system
Gap between costs and integral to mobility in Los Angeles 100 years from now.
benefits
New York City in 2004 was much larger and denser
Source: Author's calculations based on CTPP; cost numbers from than it was in 1904, when its first subway line was com-
Los Angeles Metro’s Adopted Budgets and the U.S. Department of pleted. However, planners and politicians rarely get
Transportation's National Transit Database. the latitude or budget to plan on such timescales.
Notes
1 See Anas, Arnott, and Small (1998). 7 On average, and across cities worldwide, subways appear
to have an insignificant impact on overall population
2 See Severen (2019) for details of this hybrid method. growth, though they lead to more concentrated cities than
does comparable highway construction. See Gonzalez-
3 See Heblich, Redding, and Sturm (2018) and You (2017). Navarro and Turner (2018).
4 See Bailey et al. (2019). 8 See Black, Kolesnikova, and Taylor (2014).
5 Economists call the general phenomenon of increased 9 Of course, automobiles are also valuable for increasing the
productivity in or near large collections of people or firms mobility of some people with disabilities.
agglomeration. See Chatman and Noland (2014).
10 See Department of Transportation (2018).
6 See Duranton and Puga (2004) and Rosenthal and
Strange (2004). 11 See Davis, Williams, and Boundy (2016).
A Ticket to Ride: Estimating the Benefits of Rail Transit
2020 Q2
Federal Reserve Bank of Philadelphia
Research Department 712 See Duranton and Turner (2018). (typically about one-third) of their income on housing. So if a 10 percent
reduction in housing prices in a neighborhood (holding other characteristics
13 See Mangum (2017). of the neighborhood constant) induces 18% × (⅓) = 6% more people to
live in a neighborhood, then a 6 percent increase in commuting from that
14 See Bowes and Ihlanfeldt (2001). location is equivalent to a 10 percent reduction in housing prices.
15 See Brinkman and Lin (2019). 29 Economists call these variables shift-share or Bartik instrumental
variables. Because of the particular setting and data in my 2019 working
16 See, for example, Billings (2011) and Chen and Whalley (2012). paper, many critiques of this approach are not relevant here.
17 See, for example, Allen and Arkolakis (2019) and Tsivanidis (2018). 30 Economists often consider other externalities, sometimes called
spillovers, in these models. A typical externality is agglomeration.
18 Spatially detailed data on commuting behavior is available only for Though I discuss this in my working paper, I do not discuss it here.
1990 and 2000, and since 2002.
31 The increased commuting between 2002 and 2015 could be attributed
19 It was operated as three lines at the time; one line had two branches. to either the slow adjustment of people to Los Angeles Metro Rail or the
These are now operated as two lines. growth of the network and increased service area after 2002. The
$216 million annual benefit attributes all the growth to slow adjustment
20 There were also unique factors that arose during the planning and (and can therefore use the same cost basis as the $109–$146 million
construction of Los Angeles Metro Rail that help clearly differentiate the annual benefit estimate).
direct effects of Los Angeles Metro Rail from other factors that could
influence neighborhood change. These factors argue for interpreting the 32 For example, Nicolas Gendron-Carrier and his coauthors found that
estimates described below as causal (rather than simply correlative). subways decrease air pollution. Applying their estimates and methods to
See Severen (2019) for a description of an exploding clothing store and Los Angeles suggests that Los Angeles Metro Rail may have up to an
more discussion. additional $180 million in annual benefits (roughly equal to the commuting
benefit). Accounting for this brings total benefits within the lower end
21 Census tracts have on average 4,000 residents, though size can vary of the cost range. However, it is not obvious that these benefits represent
quite a bit. There are about 2,400 census tracts in the area under a long-run gain, as decreased congestion from rail transit could eventually
study, implying approximately 2,4002=5.76 million pairs of residential- induce more driving (and thus more pollution).
workplace connections.
33 All dollar amounts have been inflation-adjusted to their 2015 equiv-
22 This is accomplished by using neighborhood-by-year fixed effects. alents. Figures are author’s calculations based on LACMTA fiscal year
budget filing reports.
23 Red Cars (the Pacific Electric Railroad’s Los Angeles streetcar system)
were a notable component of commuting in Los Angeles prior to WWII. 34 The range captures the wide variety of assumptions used to value the
The last Red Car ran in 1961. benefits of infrastructure projects.
24 Neighborhoods that first became connected between 2002 and 2015 35 There exists little detailed work comparing costs internationally, but
experienced a 9 to 13 percent increase. Alon Levy has created perhaps the most exhaustive dataset at his blog,
Pedestrian Observations. Brooks and Liscow (2019) showed that the
25 This is between one-third and one-quarter the size of the short-run costs of other transportation infrastructure in the U.S. (specifically, high-
effect Anderson found in his 2014 paper. He used the Los Angeles Metro ways) started to increase substantially in the late 1970s.
Rail labor strike of 2003 to provide very high-quality evidence that the
presence of rail service reduced congestion (as measured by vehicle
speed) along Los Angeles freeways by up to 12 percent. The difference References
in findings is most likely due to the time frame: I study changes in Ahlfeldt, Gabriel M., Stephen J. Redding, Daniel M. Sturm, and Nikolaus
congestion after years have passed, while Anderson focused on travel Wolf. “The Economics of Density: Evidence from the Berlin Wall,”
during an event that lasted about five weeks. Econometrica, 83:6 (2015), pp. 2127–2189, https://doi.org/10.3982/
ECTA10876.
26 Because of data limitations, I only studied noncommuting outcomes
between 1990 and 2000 (rather than extending the analysis to 2015, as Allen, Treb, and Costas Arkolakis. “The Welfare Effects of Transportation
I do for commuting). Infrastructure Improvements,” NBER Working Paper w25487 (2019),
https://doi.org/10.3386/w25487.
27 See Brinkman and Lin (2019).
Anas, Alex, Richard Arnott, and Kenneth A. Small. “Urban Spatial Structure,”
28 A similar approach works with housing prices, with one small Journal of Economic Literature, 36:3 (1998), pp. 1426–1464.
adjustment: We must account for the fact that people spend only part
8 Federal Reserve Bank of Philadelphia
Research Department
A Ticket to Ride: Estimating the Benefits of Rail Transit
2020 Q2Anderson, Michael L. “Subways, Strikes, and Slowdowns: The Impacts of Gendron-Carrier, Nicolas, Marco Gonzalez-Navarro, Stefano Polloni, and
Public Transit on Traffic Congestion,” American Economic Review, 104:9 Matthew A. Turner. “Subways and Urban Air Pollution,” NBER Working
(2014), pp. 2763–2796, https://doi.org/10.1257/aer.104.9.2763. Paper w24183 (2018).
Bailey, Michael, Patrick Farrell, Theresa Kuchler, and Johannes Stroebel. Gonzalez-Navarro, Marco, and Matthew A. Turner. “Subways and Urban
“Social Connectedness in Urban Areas,” NBER Working Paper w26029 Growth: Evidence from Earth,” Journal of Urban Economics, 108 (2018):
(2019). pp. 85–106.
Billings, Stephen B. “Estimating the Value of a New Transit Option,” Heblich, Stephan, Stephen J. Redding, and Daniel M. Sturm. “The Making
Regional Science and Urban Economics, 41:6 (2011), pp. 525–536. of the Modern Metropolis: Evidence from London,” NBER Working Paper
w25047 (2018), https://doi.org/10.3386/w25047.
Black, Dan A., Natalia Kolesnikova, and Lowell J. Taylor. “Why Do so Few
Women Work in New York (and so Many in Minneapolis)? Labor Supply Levy, Alon. Pedestrian Observations: Construction Costs, (2011). https://
of Married Women Across U.S. Cities,” Journal of Urban Economics, 79 pedestrianobservations.com/construction-costs/.
(2014), pp. 59–71.
Mangum, Kyle. “The Role of Housing in Carbon Emissions,” Andrew
Bowes, David R., and Keith R. Ihlanfeldt. “Identifying the Impacts of Rail Young School of Policy Studies Research Paper Series 17-05 (2017),
Transit Stations on Residential Property Values,” Journal of Urban https://dx.doi.org/10.2139/ssrn.2957749.
Economics, 50:1 (2001), pp. 1–25.
Monte, Ferdinando, Stephen J. Redding, and Esteban Rossi-Hansberg.
Brinkman, Jeffrey C., and Jeffrey Lin. “Freeway Revolts! Highways, “Commuting, Migration, and Local Employment Elasticities,” NBER
Downtown Amenities, and Urban Growth,” Federal Reserve Bank of Working Paper w21706 (2015).
Philadelphia Working paper 19-29 (2019).
Rosenthal, Stuart S., and William C. Strange. “Evidence on the Nature
Brooks, Leah, and Zachary D. Liscow. “Infrastructure Costs,” unpublished and Sources of Agglomeration Economies.” In J. Vernon Henderson and
manuscript (2019), https://dx.doi.org/10.2139/ssrn.3428675. Jacques-François Thisse, eds., Handbook of Regional and Urban Economics,
vol. 4, San Diego: Elsevier, 2004, pp. 2119–2171.
Chatman, Daniel G., and Robert B. Noland. “Transit Service, Physical
Agglomeration and Productivity in U.S. Metropolitan Areas,” Urban Studies, Severen, Christopher. “Commuting, Labor, and Housing Market Effects of
51:5 (2014), pp. 917–937, https://doi.org/10.1177%2F0042098013494426. Mass Transportation: Welfare and Identification,” Federal Reserve Bank
of Philadelphia Working Paper 18-14/R (2019).
Chen, Yihsu, and Alexander Whalley. “Green Infrastructure: The Effects of
Urban Rail Transit on Air Quality,” American Economic Journal: Economic Tsivanidis, Nick. “The Aggregate and Distributional Effects of Urban
Policy, 4:1 (2012), pp. 58–97, https://doi.org/10.1257/pol.4.1.58. Transit Infrastructure: Evidence from Bogotá’s TransMilenio,” unpublished
manuscript (2018).
Davis, Stacy C., Susan E. Williams, and Robert G. Boundy. Transportation
Energy Data Book: Edition 35, Knoxville, TN: Oak Ridge National You, Wei. “The Economics of Speed: The Electrification of the Streetcar
Laboratory, 2016. System and the Decline of Mom-and-Pop Stores in Boston, 1885–1905,”
unpublished manuscript (2017).
Department of Transportation, Bureau of Transportation Statistics. “TET
2018—Chapter 6—Household Spending on Transportation.” In Transpor-
tation Economic Trends, 2018, https://www.bts.gov/browse-statistical-
products-and-data/transportation-economic-trends/tet-2018-chapter-
6-household.
Duranton, Gilles, and Diego Puga. “Micro-foundations of Urban
Agglomeration Economies.” In J. Vernon Henderson and Jacques-François
Thisse, eds., Handbook of Regional and Urban Economics, vol. 4, San Diego:
Elsevier, 2004, pp. 2063–2117.
Duranton, Gilles, and Matthew A. Turner. “Urban Growth and Transpor-
tation,” Review of Economic Studies, 79:4 (2012), pp. 1407–1440, https://
doi.org/10.1093/restud/rds010.
Duranton, Gilles, and Matthew A. Turner. “Urban Form and Driving:
Evidence from U.S. Cities,” Journal of Urban Economics, 108 (2018), pp.
170–191.
A Ticket to Ride: Estimating the Benefits of Rail Transit
2020 Q2
Federal Reserve Bank of Philadelphia
Research Department 9Photo: FG Trade/iStock
Daniel Sanches is an economic advisor and
economist at the Federal Reserve Bank
of Philadelphia. The views expressed in this
article are not necessarily those of the
Federal Reserve.
Central Bank
Digital Currency
Is It a Good Idea?
A CBDC might make banking easier for you and me.
It might also change how banks operate.
BY DA N I E L SA N C H E S
T
hanks to recent technological advances, central banks can only to select financial institutions, which can hold the reserves
issue a new type of money that travels through a network in accounts with the central bank.
of computers around the globe and is exchanged with Many central banks already issue reserves electronically. If
the click of a mouse or by using a mobile device. This central a financial institution has an account with a central bank, it can
bank digital currency (CBDC) could change how people make sell assets (usually government bonds) to the central bank and
payments and how financial firms operate. A CBDC is an efficient receive a credit in its central bank account for the value of that
payment instrument for both domestic and international trans- transaction. Financial institutions and the central bank rarely
actions, but it might prompt households and firms to shift funds use physical currency to settle these large-denomination financial
away from bank deposits, increasing banks’ funding cost and transactions. Instead, they use computers. Thus, reserves are
decreasing investment in the economy. This article examines typically a virtual currency issued by the central bank and used
a CBDC’s potential benefits and trade-offs for society. for payments within a network of financial institutions. When a
financial institution needs to make a payment to another financial
institution, it usually transfers the amount electronically from its
Types of Money reserves with the central bank to the other institution’s reserves.
In modern economies, a central bank such as the Federal Reserve Physical currency and reserves are both outside money—that is,
issues two types of money: physical currency and reserves. money created outside the private sector. Outside money can be
Physical currency is the paper notes, such as the dollar bills, that issued by a central bank, or it can take the form of an asset that
most people use in their daily transactions. Reserves are a unit has an intrinsic value, such as gold or silver. When the central
of account denominated in the country’s own currency but issued bank buys government bonds from a financial institution, it pays
10 Federal Reserve Bank of Philadelphia
Research Department
Central Bank Digital Currency: Is It a Good Idea?
2020 Q2for them by increasing the reserve bal- interest just like a money market mutual CBDC as an Efficient Medium
ances of that institution, which implies fund account. In most advanced econo- of Exchange
that the supply of outside money in the mies, financial institutions that are eligible Consumers typically earn little or no
economy increases. to hold an account with the central bank interest on deposit accounts at commercial
Inside money, such as bank deposits and already receive interest payments on their banks and may pay considerable fees for
checkable mutual fund accounts, is cre- balances. In other words, some financial withdrawing cash from automated teller
ated by financial firms within the private institutions have access to interest-bearing machines. Merchants pay substantial
sector. Unlike outside money, inside outside money. A CBDC would allow the interchange fees for taking payments via
money is necessarily a claim on some central bank to pay interest to individuals debit and credit cards. These fees reflect
private issuer. For instance, your checking and nonfinancial firms, too. both operational costs and profit margins
account with a commercial bank is an Initially, the central bank would issue for card-issuing financial firms.
asset for you but a liability for the bank. If a CBDC and stand ready to exchange it A central bank could offer a CBDC at no
you decide to withdraw the balance in your one-for-one with physical currency, which cost to households and firms, which could
bank account, the bank must pay out would be necessary to ensure that people then earn interest on the balances they
currency. If the bank makes good on its and firms feel comfortable with the new hold at the central bank. Although the
promise to you, you no longer hold a claim payment instrument. Gradually, the central central bank would bear the nonnegligible
on the bank. bank would retire physical currency from costs of maintaining the digital transaction
If you want to make a payment to some- circulation until it is phased out. records, it might find it worthwhile to
one who holds an account at a different subsidize CBDC accounts, as they could
bank, you instruct your bank to transfer serve as a valuable public good.1
the balance in your account to that person’s
account. This can be done by check, wire FIGURE 1
transfer, or some other means. At the end
of the business day, your bank is required With a Printed Currency: Outside vs. Inside Money
to transfer reserves to the payee’s bank OUTSIDE
for the value of that transaction. Alterna- MONEY
People’s use of
tively, you can withdraw cash to make the printed money
payment yourself. So, in a typical daily in daily life
$
transaction, the bank either pays currency
directly to its depositor or transfers Offline
reserves to another financial institution. Online
INSIDE
MONEY
In other words, the bank must reduce Central bank
its outside money holdings if a depositor A B
makes a payment to someone outside the Banks sell v$ v$
bank. Ricardo Lagos provides a useful bonds to the Banks use a digital and large-
central bank
summary of the types of money available to purchase
denomination version of the
printed currency A for interbank
to households and firms (Figure 1). currency. Bond
trades and B to settle inside
A CBDC is a new form of outside money % money payments, like cashed
checks, between different bank
designed to eventually replace physical accounts.
Banking network
currency. Because it is an electronic token,
any individual or firm holding CBDC can
make payments to all individuals and But with a Digital Currency…
firms within the CBDC computer network. The central bank will slowly phase
out printed currency as it C Individuals can also hold
An important innovation associated with a introduces the new central bank interest-earning, cbdc
CBDC is that if the network is sufficiently digital currency (cbdc). accounts with the central
bank. As more people
large, people can transfer balances with-
lin e
adopt the cbdc, D they can
On lin
out a commercial bank. For instance, you $
Off
use it to settle payments
e
D from big-ticket purchases
could use your CBDC balance to pay for a to small-ticket expenses
meal at your favorite restaurant or to order directly without using
C banks as intermediaries.
a new refrigerator from an online retailer.
Your transaction is immediately settled Central bank
via a transfer of electronic outside money
to the seller. Banks still sell bonds to the central bank
Additionally, individuals or firms with Bond to purchase currency, but now it’s digital.
an account at the central bank can receive % That same currency is now used for
high-denomination, interbank trading.
interest payments proportional to their
balances, so a CBDC account can earn
Central Bank Digital Currency: Is It a Good Idea?
2020 Q2
Federal Reserve Bank of Philadelphia
Research Department 11If a CBDC paid an interest rate in line with other risk-free assets, created CBDC. The private bank’s deposits—and its reserves with
it could serve as an efficient payment instrument for all sorts the central bank—decline by $2,000. On the liability side of the
of transactions.2 A big reason why people hold bank deposits and central bank’s balance sheet, reserves diminish by $2,000 and
other checkable accounts at financial institutions (even though the CBDC rises by the same amount.
they pay little or no interest) is because they make it easy for Now suppose that the private bank initially had $20,000 worth
households and firms to make payments. Although consumers of assets, with $2,000 in reserves held in an account with the
value these transaction services, they tend to economize on central bank and $18,000 in loans to firms and households.
currency and bank deposits in their portfolio because there is an In other words, the private bank held 10 percent of its assets in
opportunity cost of holding money balances. That cost is the reserves. After one of its depositors transfers $2,000 to the CBDC,
difference between the interest rate on a risk-free asset and the private bank ends up with no reserves at all. To return to
the yield on money holdings. An efficient medium of exchange the desired portfolio composition, it would have to call in $1,800
would drive this differential to zero. worth of loans, holding everything else constant (Figure 2). But
When interest rates rise, households and firms tend to transfer this would happen only if the central bank does not issue new
some of their wealth from their noninterest-bearing checkable units of the CBDC to buy assets from the private bank.
accounts to risk-free assets. By paying an interest rate in line This example shows that the amount of loans generated from
with other risk-free assets in the economy, a CBDC would induce within the private sector will likely contract upon the introduction
people not to transfer money to those risk-free (but illiquid) assets. of a CBDC that pays a sufficiently attractive interest rate. If
In his classic 1969 article, Milton Friedman argued that in an households and firms shift their funds to a CBDC, and if nothing
economy in which money did not receive a rate of interest, as is else changes in the economy, intermediaries in the financial
now the case, people would hold too little wealth in the form of system must contract their balance sheets, which is why the
money. By encouraging people to hold more money as a propor- creation of a CBDC can lead to a reduction in private-bank loans
tion of their portfolio, a CBDC could make everyone better off.3 to households and firms.
One advantage of a CBDC is that its network can include
all households and firms in each country. By setting the interest FIGURE 2
rate on a CBDC equal to the risk-free rate, the central bank Before the Introduction of a Digital Currency
could then supply an efficient medium of exchange to all agents A customer makes
in the economy. a deposit at Bank A… $2,000
Another benefit of a CBDC is that it can be a safe asset for Reserves $2,000
households and firms. The current banking system necessitates
an elaborate system of bank regulation to prevent bank failures
and bank runs. A government bankruptcy is less likely than Bank A
Loans to
a banking crisis. Certainly, there is much less probability of a run earning the customer ~0% while the households
almost nothing… interest bank adds and firms
on a CBDC. As a result, a CBDC can promote financial stability in it to its $18,000
the banking system. balance
sheet. Total Assets $20,000
Disintermediation in the Banking System Disintermediation Process
As we have seen, a CBDC is a new payment instrument that com- The central bank creates so the customer moves his
petes with all forms of inside money. If a central bank decides a new digital currency & $2,000 to the central bank
allows individuals to deposit at from Bank A…
to launch a CBDC with the previously described properties, some the central bank directly…
households and firms will likely shift their funds from private
financial institutions to an account at the central bank, a process $2,000
economists call disintermediation.
To better understand disintermediation, suppose that a central 4%
bank creates a CBDC overnight and offers to pay 4 percent per interest
annum interest on its account balances. Right now, commercial
banks in the U.S. offer a negligible, if not zero, interest rate on
Bank A now has so it calls in loans to leaving less to loan to
most retail customers’ account balances. If commercial banks do both a smaller create reserves… households & firms.
not change their interest rate strategy in response to the intro- balance sheet and
no reserves…
duction of a CBDC, many people and firms will likely transfer their
balances to a CBDC account immediately. Because commercial
banks issue deposits to finance loans to households and firms, they
Loans to
will have to contract their loan portfolio in response to a decline households
in deposits, leading to disintermediation in the banking system. and firms
$16,200
The exact amount of this disintermediation depends on many
factors. For example, suppose that someone with a private-bank Total Assets $1,800
account worth $2,000 decides to shift their balance to the newly
12 Federal Reserve Bank of Philadelphia
Research Department
Central Bank Digital Currency: Is It a Good Idea?
2020 Q2You can also read