Maple Leaf Foods Q1 2020 Business & Financial Review
←
→
Page content transcription
If your browser does not render page correctly, please read the page content below

Maple
                                      Leaf
                                      Foods
                                      Q1 2020 Business
                                      & Financial Review

All dollar amounts are presented in
CAD dollars unless otherwise noted.
Forward-looking Statements and non-IFRS Measures
This presentation contains “forward-looking information” within the meaning of applicable securities law. These statements are based on current expectations, estimates, forecasts, and
projections about the industries in which the Company operates, as well as beliefs and assumptions made by the Management of the Company. The COVID-19 pandemic creates a very
fluid situation with many uncertainties. Based on its experience to date, the Company has made certain assumptions about the implications of COVID-19 for its business, including,
including: shifting demand balance between retail and foodservice channels, product mix, productivity, supply chain disruptions, operating cost pressures and business continuity.
The Company’s expectations with respect to future sales and returns associated with the anticipated growth of its plant protein business are based on a number of assumptions, estimates
and projections, including but not limited to: the impact of COVID-19, market growth assumptions, market share assumptions, new product and brand innovation, foreign exchange rates
and competition.
The Company’s expectations with respect to the growth of its meat protein business, such as anticipated growth in sales, adjusted EBITDA margin and gross margin, are based on a
number of assumptions, estimates and projections, including but not limited to: the impact of COVID-19, hog and pork processor margins, the strength of pork demand in Asia, poultry
markets; foreign exchange rates, and growth in demand for sustainable meats.
The Company's assumptions about capital project expenditures and timing are based on a number of assumptions, including but not limited to: impact and duration of work stoppages
and slowdowns associated with COVID-19, availability and cost of materials, labour, productivity levels, quality of estimating, weather conditions, and project scope.
These statements are not guarantees of future performance and involve assumptions and risks and uncertainties that are difficult to predict. These assumptions have been derived from
information currently available to the Company, including information obtained by the Company from third-party sources. These assumptions may prove to be incorrect in whole or in
part. In addition, actual results may differ materially from those expressed, implied, or forecasted in such forward-looking information, which reflect the Company’s expectations only as of
the date hereof. Please refer to the sections entitled “Risk Factors” and “Forward-Looking Statements” n the Company's Management Discussion and Analysis for the fiscal year ended
December 31, 2019 and the quarter ended March 31, 2020 for additional detail.
In addition, this presentation contains the following non-IFRS measures:
Adjusted Operating Earnings: Defined as earnings before income taxes adjusted for items that are not considered representative of ongoing operational activities of the business, and
items where the economic impact of the transactions will be reflected in earnings in future periods when the underlying asset is sold or transferred.
Adjusted Earnings per Share: Defined as basic earnings per share adjusted for all items that are not considered representative of ongoing operational activities of the business, and items
where the economic impact of the transactions will be reflected in earnings in future periods when the underlying asset is sold or transferred.
Adjusted Earnings Before Interest, Taxes, Depreciation and Amortization: Defined as Adjusted Operating Earnings plus depreciation and intangible asset amortization, adjusted for items
included in other expense that are not considered representative of ongoing operational activities of the business.
Net (Debt) Cash: Defined as cash and cash equivalents, less long-term debt and bank indebtedness.
Construction Capital: Defined as investments in projects over $50.0 million that are related to longer-term strategic initiatives, with no returns expected for at least 12 months in the future
and the asset will be re-categorized from Construction Capital once operational.

Please refer to the Company’s Management and Discussion and Analysis for the year ended December 31, 2019 and the Quarter ended March 31, 2020 for additional information on non-IFRS financial
measures
  2                                                                                                                          MAPLE LEAF FOODS – Q1 2020 BUSINESS AND FINANCIAL REVIEW | APRIL 29, 2020

Protect the Health &
                   Safety of our People

    Our COVID-19    Ensure Business
    Response          Continuity

                     Social Purpose

3
Took Swift Action to Protect and Support our People
1. Applied COVID-19 screening tools at all locations
2. Implemented work-from-home where possible and eliminated in-person
   meetings unless absolutely necessary
3. Prohibited business travel and imposed self isolation conditions on Team
   Members who have travelled internationally or live with someone who has
4. Allocated more space in welfare areas, staggered break times to enable
   social distancing
5. Mandatory face coverings and temperature monitoring at all sites
6. Supporting front-line Team Members with an additional $80/week above
   regular and overtime pay
7. Providing continued financial support (in coordination with CERB) for team
   members whose work is interrupted due to COVID-19 related illness,
   symptoms or temporary suspension of plant operations

    These efforts augment heightened sanitation procedures and
    widespread use of personal protective equipment at all sites

4                                                                           MAPLE LEAF FOODS – Q1 2020 BUSINESS AND FINANCIAL REVIEW | APRIL 29, 2020
As an Essential Service, Business Continuity is Imperative

                                     •   Government has designated our food
                                         system an essential service, and
                                         “critical infrastructure”

                                     •   We developed and adhere to a
                                         comprehensive COVID-19 playbook, with
                                         key stakeholder input
              Business
             Continuity              •   To-date, seven of our facilities have
                Plan                     experienced at least one positive COVID-19
                                         case among their teams
                                          o   Our playbook was deployed to safeguard
                                              employees before operations resumed

                                     •   All facilities adhering to strict preventative
                                         safety and sanitation measures

5                                                   MAPLE LEAF FOODS – Q1 2020 BUSINESS AND FINANCIAL REVIEW | APRIL 29, 2020
Expanding our Community Support Efforts
• Launched #ApartTogether $2 million
campaign to support emergency food relief
$1 million commitment from Maple Leaf, with funds
supporting Community Food Centres of Canada and
Food Banks Canada
Re-directed media spend to promote campaign on TV,
Facebook and YouTube
• Donated $2.5 million to The Frontline Fund,
supporting front-line healthcare workers
across Canada
• Internal campaign to raise $100,000 to
support food relief in local communities
• Actively connecting our suppliers with
capacity to support emergency food
organizations
6 MAPLE LEAF FOODS – Q1 2020 BUSINESS AND FINANCIAL REVIEW | APRIL 29, 2020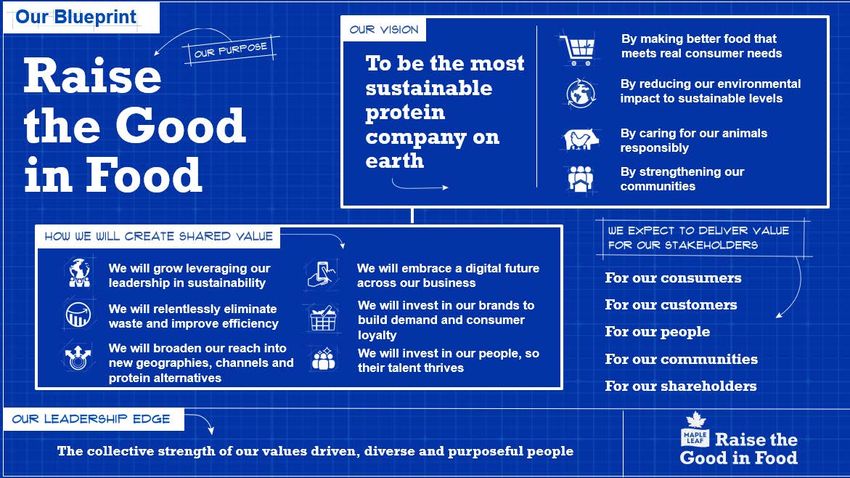
Our Strategy

7

Continuing to Execute our Strategic Blueprint

88                                              MAPLE LEAF FOODS – Q1 2020 BUSINESS AND FINANCIAL REVIEW | APRIL 29, 2020
We Built a Profitable Base; Now We’re Focused on Profitable Growth
2010 Transformation 2014 2015 Brand-led Growth Today
Exited non-core businesses Expanding sustainable meats platform
Rothsay (2013)
Olivieri (2013)
Canada Bread (2014)
Renovated core brands
Transformed our supply chain
Established scale prepared meats network,
consolidating fragmented supply chain
Delivered significant efficiency and margin
improvements Established leadership in Plant Protein
Invested in technology
Deployed SAP
9 MAPLE LEAF FOODS – Q1 2020 BUSINESS AND FINANCIAL REVIEW | APRIL 29, 2020
Maple Leaf’s Growth Vectors Have Delivered Compelling Results
1 Meat Protein Growth Vectors:
3-year Average Sales Growth
excluding acquisitions/divestments Building leadership in sustainable meats
Rapidly growing U.S. market reach
Fueling growth through brand renovation
Constructing new scale poultry facility
Expanding capacity in dry cured meats & protein kits
~3x
3.1%
2 Plant Protein Growth Vectors:
Leveraging strength of established brands
1.0% Broadening brand awareness through strategic
investment
Branded Meat Maple Leaf Foods
Peer Composite Accelerating innovation pipeline
Optimizing network to support profitable growth
Notes: Sales growth excludes impact of acquisitions and divestments; Branded Meat Peer Composite incudes Hormel,
10 Tyson, Kraft Heinz, ConAgra and Premium Brands; Figures represent equal-weighted average of F2017/18/19 results. MAPLE LEAF FOODS – Q1 2020 BUSINESS AND FINANCIAL REVIEW | APRIL 29, 2020Well-defined Strategies and the Leading Brands to Support Them
Two businesses, with two distinct strategies
Meat Protein Group Plant Protein Group
Strategy: Drive profitable growth Strategy: Invest for growth
Our
Brands
Adjusted EBITDA Dollars & Margin Sales
(in millions; margin as % of sales) (in millions)
$419 $186
$393 $176
$369
Financial $332 $337
$363
$154
$165
10.8% $147
Track 10.4%
$139
Record 9.9%
10.2%
10.1%
9.8%
Q4/18 Q1/19 Q2/19 Q3/19 Q4/19 Q1/20 Q4/18 Q1/19 Q2/19 Q3/19 Q4/19 Q1/20
Last 12 months ending... Last 12 months ending...
11 MAPLE LEAF FOODS – Q1 2020 BUSINESS AND FINANCIAL REVIEW | APRIL 29, 2020Q1 2020
Results
12Progress on Strategic, Financial & Operational Priorities in Q1 2020
Strategic Financial Operational
Maple Leaf
Increased quarterly dividend
Foods Delivered on shared value
through supporting emergency
10% commencing Q1/20
Mitigated COVID-19 supply
disruptions through quick
Becoming the most sustainable food relief and front-line deployment of proactive and
protein company on earth Solid balance sheet & liquidity
healthcare workers fund (Net Debt: $641M, undrawn credit: $1.3B) response playbook
Two businesses, with two distinct strategies:
Meat
Increased Asian markets sales
through strategic partnerships
Volume and mix drove strong
13% sales growth
Broad improvements to
operational efficiencies vs. the
Protein
Continued expansion in U.S.
Solid EBITDA margins (11.3%) prior year (e.g. improved fill
rates)
Drive profitable growth and sustainable meats delivered 30% EBITDA growth
Plant
Aligning brands to evolving
demand spaces
Sales growth approaching 30%
for third consecutive quarter
New innovation from Lightlife
(breakfast links/patties, Buffalo
Protein
Equity investment in Good
SG&A spend ($30.9M) on pace tempeh) and Field Roast
(breakfast patties, nuggets)
Investing for growth Catch (plant-based seafood) with full year plans ($150M)
13 MAPLE LEAF FOODS – Q1 2020 BUSINESS AND FINANCIAL REVIEW | APRIL 29, 2020Meat Protein Group – Q1 2020 Key Financial Metrics
Q1 2020 Change Drivers
• Strong retail channel volumes, increased sales to Asian
Sales $981.4 12.7% markets and favourable mix towards sustainable meats
• COVID-19 impact slightly accretive
Gross Profit $157.3 +19.3% • Mix-shift towards sustainable meats and channel
optimization towards Asian markets
Gross Margin 16.0% +90 bps • Partially offset by higher costs in hog production & poultry
SG&A Expenses $88.0 +1.9% • $2.5M donation to support front-line health care workers
• Partially offset by cost efficiencies
SG&A (as a % of sales) 9.0% -90 bps
Adj. Operating Earnings $69.2 +52.4%
Adj. EBITDA $111.1 +30.9% • Strong commercial performance coupled with pork
markets more in line with 5-yr average
Adj. EBITDA Margin 11.3% +160 bps • Net impacts from COVID-19 slightly dilutive to margins
Another quarter of strong commercial performance, supported by strategic drivers
14 Note: All figures in millions, unless noted otherwise. MAPLE LEAF FOODS – Q1 2020 BUSINESS AND FINANCIAL REVIEW | APRIL 29, 2020Meat Protein Group – Q1 Pork Complex Broadly in-line with 5-yr Avg.
Hog Production Margins Pork Processor Margins Pork By-Product Market
$20 $30 $6.5
$6.0
$10 $20
US/CWT
$5.5
US/CWT
US/CWT
$0 $10 $5.0
$4.5
-$10 $0
$4.0
-$20 Q1 Q2 Q3 Q4 -$10 Q1 Q2 Q3 Q4 $3.5 Q1 Q2 Q3 Q4
Hog production margins = live hog cost (CME) less Hog Raising Index Pork processor margins = pork cutout less live hog cost (CME) Notes: Figures shown represent USDA by-product drop value.
Source: Informa; CME Group. Source: USDA; CME Group. Source: USDA.
• Live hog prices remained suppressed through • Despite soft processing spreads mid-quarter • US by-product values remained relatively stable
the quarter due to over-supply and market (over-supply of bellies and ham), Q1 margins through the quarter, with no knock-on effects
uncertainty garnered by COVID-19 were slightly ahead of the 5-yr average from stronger values in Asian markets
Cumulatively, the Pork Complex performed broadly in-line with the 5-yr average,
resulting in an immaterial impact to the Meat Protein EBITDA margin in Q1
15 Note: 5-yr average represents smoothed trendline of 2015-2019 data for each metric. MAPLE LEAF FOODS – Q1 2020 BUSINESS AND FINANCIAL REVIEW | APRIL 29, 2020Plant Protein Group – Q1 2020 Key Financial Metrics
Q1 2020 Change Drivers
• Expanded distribution of recent product innovations
Sales $46.3 25.9% (raw burgers, sausages and grounds)
• Continued volume growth in legacy portfolio
Gross Profit $6.8 -20.5% • Increased trade and promotional expenditures
• Higher supply chain costs
Gross Margin 14.6% -860 bps
SG&A Expenses $30.9 +160.0% • Strategic ad & promo investment to drive brand
awareness and support new product launches
SG&A (as a % of sales) 66.6% +3430 bps • Expanded organizational capacity & innovation pipeline
Adj. Operating Earnings -$24.1 nm
Adj. EBITDA -$20.5 nm
Delivered sales growth in-line with expectations, while investing for the long-term
16 Note: All figures in millions, unless noted otherwise. MAPLE LEAF FOODS – Q1 2020 BUSINESS AND FINANCIAL REVIEW | APRIL 29, 2020Greenleaf Continues to Command a Strong #2 Position
• U.S. refrigerated market +111% y/y
Market growth
• Canadian market +32% y/y
remains high1
• Growth lead by products in fresh meat case
• Maintaining solid #2 market share position1
• Innovation velocities accelerating: +32% in U.S. and
Greenleaf +62% in Canada vs. Q42
Updates • Q1 sales growth (26%) driven by legacy products
and recent product innovations3
• Exciting innovation & marketing roll-out coming soon…
1 IRI/SPINS data (MULO + Natural) for U.S. refrigerated segment (12 weeks ended March 22, 2020);
Nielsen data (xAOC) for Canada refrigerated segment (l12 weeks ended March 28, 2020).
2 Velocities measured as $000/average TDP for innovation products only; growth benchmarked against Q4
(Canada: 12 weeks ended January 4, 2020, U.S.: 12 weeks ended December 29, 2019).
3 Based on Maple Leaf Food’s reported Plant Protein Group sales for Q1 2020 (vs. Q1 2019). MAPLE LEAF FOODS – Q1 2020 BUSINESS AND FINANCIAL REVIEW | APRIL 29, 2020
17Plant Protein Group – Gross Margin and SG&A Expense Evolution
Gross Margin SG&A Expenses
Product margins remain near 30%* Sequential decline in spend due to timing
$44.9M $45.3M
(95% of sales) (91% of sales)
7.6%
Short
12.8% 13.2% term $30.1M
inefficiencies (67% of sales)
Ad &
promo: Ad &
21.3%
promo:
14.4% 14.6%
Gross ~70% Ad &
of SG&A ~60% promo:
Margin (of SG&A)
~55%
(of SG&A)
Q3/19 Q4/19 Q1/20 Q3/19 Q4/19 Q1/20
Notable Items in Q1: Notable Items in Q1:
• Short-term inefficiencies primarily related to start-up inefficiencies, • Sequential decline in SG&A investment as we leverage
as well as heightened trade expenditure, and supply chain costs. strong brand awareness spend in the second half of 2019.
• SG&A (as % of sales) for Q1 in-line with 2020 outlook.
18 *Excluding impact of short term inefficiencies. MAPLE LEAF FOODS – Q1 2020 BUSINESS AND FINANCIAL REVIEW | APRIL 29, 2020Total Company – Q1 2020 Key Financial Metrics
Q1 2020 Change Drivers
Sales $1,022.8 +12.8% • Double-digit growth in both Meat & Plant Protein
Adj. Operating Earnings $45.1 +7.3%
Adj. EBITDA $90.5 +7.2% • Strong underlying margins in Meat Protein
• Impacted by strategic investment in Plant Protein
Adj. EBITDA Margin 8.9% -40 bps
Net earnings ($3.7) nm
Adj. EPS $0.21 +5.0%
Net Debt1 $640.6 +$256.2
• Increase in construction capital primarily related to the
Capital Expenditure (YTD) $99.2 +$39.0 London Poultry facility
Construction Capital (YTD) $56.9 +$38.8
Sustained strength in Meat Protein partially offset by ongoing investment in Plant Protein
1Excludes $262.6 million in lease obligations.
19 Notes: All figures in millions, except per share amounts. MAPLE LEAF FOODS – Q1 2020 BUSINESS AND FINANCIAL REVIEW | APRIL 29, 2020Update on Key Large-Scale Capital Projects
London Poultry Facility Shelbyville Plant Protein Facility
• Increases processing capacity for value- • Increases production capacity to meet
Strategic added, higher margin poultry products Strategic growing demand with low cost
Rationale • Gains operating efficiencies through lower Rationale manufacturing
costs and consolidation of sub-scale plants
• Steady progress achieved through Q1
• Construction halted in April due to COVID-19 • Engineering & design continued through Q1
Update • Currently assuming a 2-month suspension, Update • No material impact due to COVID-19
which is not expected to impact completion date
20 MAPLE LEAF FOODS – Q1 2020 BUSINESS AND FINANCIAL REVIEW | APRIL 29, 20202020 & Long Term
Outlook
21COVID-19 Introduces Incremental Costs & Uncertainty
Known Factors for Q2: Unknown Factors for Q2 & FY2020:
o Strong demand in retail channel and lower o Volatility in pork & poultry commodity and
sales in foodservice FX markets (+/-)
o Strong pork demand from Asian markets o Retail & foodservice demand balance (+/-)
o Continued traction in plant protein (growth o Potential production disruptions or
in both innovation & legacy products) shutdowns (-)
o Incremental COVID-19 costs could be up to o Incremental COVID-19 costs extending
$20M due to labour, PPE, sanitation and beyond Q2 (-)
other expenses. Maple Leaf will work to o Duration of government measures,
partially mitigate this through SG&A savings including social distancing (+/-)
All the while, we plan to execute against our strategic, financial and operational goals
222020 Financial Priorities Remain Largely Unchanged
Notwithstanding the potential unknown impacts of COVID-19, we expect to achieve:
Meat Protein Group Plant Protein Group Total Company
1. Mid-to-high single digit sales 1. Sales growth of approximately 1. Capital expenditure at least $50M
growth, driven by continued 30%, in line with the long-term below our prior range of $650 to
momentum in sustainable meats strategic targets, driven by $700M. This reduction is materially
and higher sales to Asian markets. product innovation, increased attributable to delays related to
distribution and market growth. COVID-19, which may introduce
further uncertainty to capital outlays
depending on the duration of social
2. Gross margin expansion due to 2. Gross margin expansion relative
distancing measures. Approximately
mix-shift benefits in prepared to 2019, driven by stronger product
70% of planned capital expenditure
meats, pork complex conditions margins while being impacted by
will be construction capital, which is
more in-line with 5-yr average, and the inherent inefficiencies of a
mainly related to construction of the
higher sales to Asian markets. rapidly growing business.
London poultry facility; further
capacity & efficiency improvements
3. Expand Adjusted EBITDA margin, 3. SG&A expenses of approximately in our PM business; and investments
making significant progress towards $150M, primarily related to in plant protein capacity at the
the 2022 target of 14-16%, based on advertising, promotion and Walker Drive facility, as well as
factors noted above as well as cost marketing, while scaling up talent further design, engineering and site
efficiencies. and operations. work at the Shelbyville facility.
23 MAPLE LEAF FOODS – Q1 2020 BUSINESS AND FINANCIAL REVIEW | APRIL 29, 20202020 Strategic & Operational Priorities
Company Wide
Leverage our Carbon Neutral commitment with our brands
Maintain a strong balance sheet with ample liquidity
Magnify our contribution to the war effort during COVID-19 crisis
Meat Protein Group
Grow sustainable meats, including continued momentum in the U.S.
Increase capacity in protein kits and dry cured meats
Continue construction of London Poultry facility
Plant Protein Group
Aligning brands with emerging customer demand segmentation
Continue to develop and launch innovative assortment
Advance design, engineering and site work at Shelbyville facility
24 MAPLE LEAF FOODS – Q1 2020 BUSINESS AND FINANCIAL REVIEW | APRIL 29, 2020Long Term Outlook – Focused on Material Value Creation
2022 Adjusted EBITDA margin target of 14-16%, driven by:
Meat
Protein • Growth in sustainable meats • Mix-shift benefits from our brand
and food renovation work
Group • Cost and operational efficiencies
2029 ambitious goals for high-growth business:
Plant
Protein • Reach $3B in sales, in a $25B market • Grow into low double-digit SG&A rate
Group • Deliver approx. 30% gross margin • Adj. EBITDA margin above Meat Protein
Stakeholder Maple Leaf is focused on creating value for ALL stakeholders:
• Leverage Carbon Neutral position, while making • Advancing social impact through the Maple
Value progress towards our Science-Based Targets Leaf Centre for Action on Food Security
Creation • Implementing world-leading animal welfare • Expanding sustainable meats, specifically RWA
standards
25 MAPLE LEAF FOODS – Q1 2020 BUSINESS AND FINANCIAL REVIEW | APRIL 29, 2020Appendix 26
Reconciliation of Non-IFRS Metrics – Adjusted EBITDA Margin

                                                                                 Three months ended March 31, 2020                                           Three months ended March 31, 2019(2)
                                                                               Meat               Plant                                                     Meat               Plant
     ($millions)(1)                                                          Protein            Protein             Non-                                  Protein            Protein             Non-
     (Unaudited)                                                              Group              Group        allocated(3)                Total            Group              Group        allocated(3)               Total
     Earnings (loss) before income taxes                                        $68.2              (24.1)             (47.2)             $(3.0)              $42.3               (3.3)              29.9              $68.9
     Interest Expense and other financing costs                                      —                  —                 7.9                7.9                 —                  —                 7.4                7.4
     Other expense (income)                                                         1.2                 —                 2.6                3.8                0.3                 —                 1.8                2.2
     Restructuring and other related costs                                        (0.2)                 —                  —               (0.2)                2.8                 —                  —                 2.8
     Earnings (loss) from operations                                            $69.2              (24.1)             (36.7)               $8.5              $45.4               (3.3)              39.2              $81.3
     Decrease in fair value of biological assets(4)                                  —                  —               14.7               14.7                  —                  —             (26.3)             (26.3)
     Unrealized loss (gain) on derivative contracts(5)                               —                  —               22.0               22.0                  —                  —             (12.9)             (12.9)
     Adjusted Operating Earnings                                                $69.2              (24.1)                  —             $45.1               $45.4               (3.3)                 —              $42.1
     Depreciation and amortization                                                43.0                 3.5                 —               46.6               39.7                 2.9                 —               42.6
     Items included in other expense representative of                            (1.2)                 —                  —               (1.2)              (0.3)                 —                  —               (0.3)
     ongoing operations
     Adjusted EBITDA                                                           $111.1              (20.5)                  —             $90.5               $84.8               (0.4)                 —              $84.4
     Adjusted EBITDA margin                                                    11.3%            (44.3)%                 N/A               8.9%               9.7%             (1.1)%                 N/A              9.3%

          1Totals may not add due to rounding.
          2Comparative   figures have been presented to align with current reportable segments.
          3Non-Allocated includes eliminations of inter-segment sales and associated costs of goods sold, and non-allocated costs which are comprised of expenses

          not separately identifiable to reportable segments and are not part of the measures used by the Company when assessing a segment’s operating results.
          4Refer to Note 5 of the Company’s 2020 first quarter consolidated financial statements for further details regarding biological assets.
          5Unrealized gains/losses on derivative contracts is reported within cost of goods sold in the Company’s 2020 first quarter consolidated

27        financial statements.                                                                                                                          MAPLE LEAF FOODS – Q1 2020 BUSINESS AND FINANCIAL REVIEW | APRIL 29, 2020
Reconciliation of Non-IFRS Metrics – Adjusted Earnings per Share
Three months ended March 31,
($ per share)
(Unaudited) 2020 2019
Basic earnings per share $(0.03) $0.41
Restructuring and other related costs(1) — 0.02
Items included in other expense not considered 0.02 0.01
representative of ongoing operations(2)
Change in the fair value of biological assets(3) 0.09 (0.16)
Unrealized loss (gain) on derivative contracts(3) 0.13 (0.08)
Adjusted Earnings per Share $0.21 $0.20
1Includes per share impact of restructuring and other related costs, net of tax.
2Primarilyincludes (gains) and losses in disposal of investment properties, acquisition related costs and interest income, net of tax.
3Includes per share impact of the change in unrealized loss (gain) on derivative contracts and the change in fair value of biological
28 assets, net of tax MAPLE LEAF FOODS – Q1 2020 BUSINESS AND FINANCIAL REVIEW | APRIL 29, 2020Capital Allocation Priorities
Growth capacity and efficiency initiatives
1 Reinvest in the Business with a focus on returns metrics & timing
Capitalize on inorganic opportunities
2 Accretive Acquisitions with financial and strategic appeal
3 Dividend Appreciation Deliver consistent predictable growth
Opportunistic buybacks when return
4 Share Repurchases metrics exceed other alternatives
While maintaining a strong balance sheet with ample liquidity
29 MAPLE LEAF FOODS – Q1 2020 BUSINESS AND FINANCIAL REVIEW | APRIL 29, 2020You can also read