Q1 2020 - We build for a better society. Slussen, Stockholm, Sweden - Skanska
←
→
Page content transcription
If your browser does not render page correctly, please read the page content below

Q1 2020
Press release, April 28, 2020, 7:30 a.m. CET

We build for a better society.
Slussen, Stockholm, Sweden

2 Press release, April 28, 2020, 7:30 a.m. CET
Three month report, January–March 2020
Highlights according to segment reporting Revenue
Revenue amounted to SEK 41.2 billion (35.1); adjusted for currency effects revenue SEK bn
200
increased 14 percent.
Operating income amounted to SEK 2.9 billion (0.5). 150
Earnings per share amounted to SEK 5.78 (0.87).
Operating cash flow from operations amounted to SEK 1.6 billion (–1.3), according to IFRS. 100
Adjusted interest-bearing net receivables (+)/net debt (–) totaled SEK 5.3 billion
50
(December 31, 2019: 3.2), according to IFRS.
Order bookings in Construction amounted to SEK 41.3 billion (27.3); adjusted for currency
0 2016 2017 2018 2019 R-12
effects order bookings increased 48 percent. The order backlog amounted to SEK 199.0 billion
(December 31, 2019: 185.4).
Operating income in Construction amounted to SEK 0.6 billion (0.4).
Operating income
Operating income in Project Development amounted to SEK 2.5 billion (0.3).
SEK bn
Return on capital employed in Project Development was 14.8 percent (9.7). 12
Return on equity was 27.0 percent (13.4). 10
8
6
4
Performance analysis
Tables referring to segment reporting are in shaded background. For more information see page 14. 2
For definitions of non-IFRS financial measures see pages 15-17.
0 2016 2017 2018 2019 R-12
SEK M Jan-Mar 2020 Jan-Mar 2019 Change, %
Revenue
Construction 35,939 35,333 2
Operating income per segment,
Residential Development 3,400 2,141 59 Mar 31, 2020, R-12
Commercial Property Development 4,759 884 438
Central and eliminations –2,932 –3,256 –10
Total 41,166 35,102 17
Operating income
Construction 589 371 59
Residential Development 394 198 99
Commercial Property Development 2,112 84 2,414
Central –121 –148 –18
Eliminations –73 –17 329
• Construction, 37%
Operating income 2,901 488 494 • Residential Development, 13%
Net financial items –48 –62 –23
• Commercial Property
Development, 50%
Income after financial items 2,853 426 570
Taxes –470 –71 562
Profit for the period 2,383 355 571 Operating cash flow
from operations
Earnings for the period per share, SEK 5.78 0.87 568
Revenue for the period according to IFRSs 40,340 37,115 9 SEK bn
8
Operating income for the period according to IFRSs 1,482 1,084 37
Earnings for the period per share according to IFRSs, SEK 2.91 2.11 38 6
Operating cash flow from operations 1,631 –1,319 –
4
Interest-bearing net receivables(+)/net debt(–) –3,244 –7,151 –55
Return on capital employed in Project Development, % 1
14.8 9.7 2
Adjusted interest-bearing net receivables(+)/net debt(–) 5,294 887 497
0
Return on equity, % 1 27.0 13.4
1 Rolling 12 months.
-2
-4
2016 2017 2018 2019 R-12
Skanska Three month report, January–March 2020     3

Comments from Skanska’s President and
CEO Anders Danielsson
                                      Skanska’s first quarter result                  In Residential Development, the volumes were strong, and
                                      in 2020 was strong in all three                 profitability was maintained at a good level in the first quarter.
                                      business streams. But the prospect              Looking ahead, a reduction in consumer confidence due to weaker
                                      of slower future economic                       economies and increased unemployment is likely to negatively
                                      growth that I mentioned after                   impact the housing market. Already now we can see that home
                                      delivering solid results in 2019 has            sales in the beginning of the second quarter are off to a slow start.
                                      quickly turned into a much more                 Adjusting to this new market situation is our primary focus. But with
                                      negative and severe situation due               our long-term ambition to be a leading residential developer in our
                                      to the Covid-19 pandemic. Real                  home markets, combined with a solid balance sheet, we expect that
                                      economies and financial markets                 we will continue to create profitable opportunities in the future.
                                      are negatively impacted. Currently
                                      it is very difficult to tell how severe         In Commercial Property Development, two significant and very
                                      the crisis will be and exactly how              profitable divestments were signed during the first quarter and were
long it will last. For Skanska, it is of utmost importance to protect                 the main contributors to a very strong start of 2020. Moreover, the
our people and the company, as well as support the societies we                       current economic uncertainty and the risk aversion in the financial
operate in to fight the spread of the virus. Skanska has, thanks                      markets is impacting the transaction market negatively. This is
to the strategic initiatives that were initiated in 2018, improved                    expected to impact our divestment activity for some time to come.
performance, reduced risks and costs and strengthened the balance                     When this uncertainty lessens, transactions are expected to come
sheet and governance. In times like these, Skanska is standing                        back. The pandemic’s impact on real economies is also impacting
strong. To make sure that we maintain that position long-term we                      our leasing activities. We have occupancy rates at satisfactory levels
are taking actions that will allow us to adjust to a future that will                 in our portfolio of high-quality green developments in attractive
look different after the Covid-19 pandemic.                                           locations but the pace of future leasing is expected to slow. We have
                                                                                      a very robust and experienced organization to tackle the current
In Construction, the first quarter yet again proved that we are on                    market situation. Backed by a strong financial position, our long-
the right path as we continue to improve our profitability. The                       term ambition is to continue to grow our Commercial Property
stream was not substantially impacted by the Covid-19 outbreak, as                    Development operations.
many projects have been able to proceed according to plan. Order
bookings have also been strong. However, we currently have some                       The near future is currently very uncertain, and we are following
projects being shut down due to government decisions, mainly in                       the situation closely. We are planning for various scenarios and are
the US and UK, and some projects are progressing at a slower pace.                    taking precautionary actions in many areas. Caring for our people is
This will have a negative impact on volumes and earnings for some                     of course a top priority and maintaining a strong balance sheet and
time to come. The top priority is to get these projects back in full                  good liquidity is also of great importance. As communicated earlier,
production as soon as possible and avoid additional shut downs or                     the Board of Directors withdrew the dividend proposal to the Annual
reductions in execution. Long-term, our strategy remains: Selective                   General Meeting held in March with the ambition to convene an
bidding, improved commercial focus and increased cost efficiency.                     Extra General Meeting to decide on the dividend in the autumn, if
                                                                                      circumstances permit. As I mentioned in the very beginning, Skanska
                                                                                      is standing strong. And we are well positioned to come out stronger
                                                                                      as the pandemic is contained.

                              Slussen, Stockholm, Sweden
                              Slussen, at the center of Stockholm, is a transportation hub that more than 480,000 people
                              pass through daily. It is also one of Sweden’s largest ongoing construction projects. The
                              City of Stockholm is responsible for the major reconstruction of the area of which Skanska
                              manages four of five large contracts, including the engineering and constructing of the new
                              Slussen bridge, a massive steel structure that is 145 meters long. The 3,500-tonne bridge
                              arrived in Stockholm in March 2020, after traveling 20,333 kilometers from China. The entire
                              project, which is targeted for completion in 2025, will better connect Stockholm and will
                              provide the city with a more secure drinking water supply.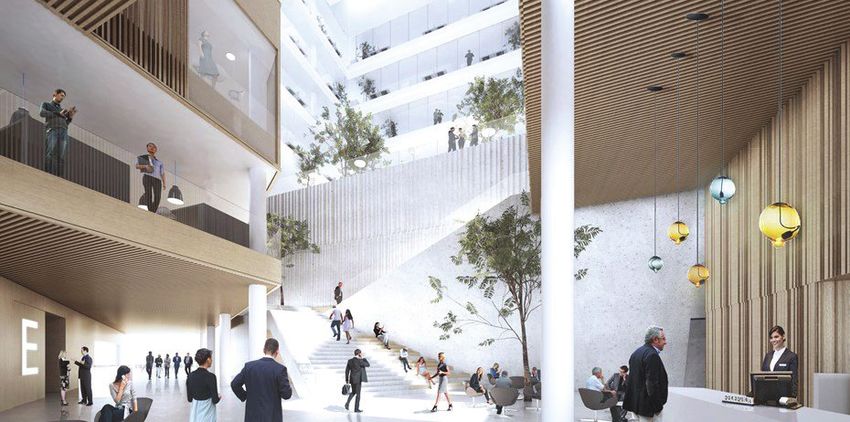
4   Skanska Three month report, January–March 2020

    Market outlook, next 12 months
    The Covid-19 pandemic is impacting both real economies in Skanska’s home markets and the financial market to a significant extent.
    Deteriorating real economy is expected, with lower demand in many industries, lower investments, increase in unemployment, and
    pressure on the national finances for many countries. Currently, it is difficult to say how severe the impact will be and for how long it
    will last.

      Weaker outlook compared to previous quarter.        Unchanged outlook compared to previous quarter.       Improved outlook compared to previous quarter.
      Very strong market coming 12m          Strong market coming 12m          Stable market coming 12m        Weak market coming 12m           Very weak market coming 12m

      Construction                                                                                                   Building,          Building,
      The extensive lockdown measures in countries outside of Sweden are                                             non-residential    residential         Civil
      now starting to impact the construction industry. Disruption to the supply
                                                                                             Nordics
      chain of equipment, materials and subcontractors are also impacting the
      industry but to a lesser extent. The industry might face increased downward       Sweden
      pressure on demand, especially in the private sector, along with supply           Norway
      chain challenges, if the Covid-19 pandemic continues or intensifies.
                                                                                        Finland
      Slowing economies will need stimulus however, and public investments
      into infrastructure and social infrastructure are usually considered as an             Europe
       effective way to stimulate the economies by decision makers.                     Poland
                                                                                        Czech Republic 1
                                                                                        United Kingdom                                         –
                                                                                             USA
                                                                                        USA                                                    –
                                                                                       1 Including Slovakia.

      Residential Development                                                                Nordics
      Greater economic uncertainty and rising unemployment in many markets
                                                                                        Sweden
      will likely impact consumer confidence for buying a home negatively, leading
      to a lower demand and potentially lower housing prices. Longer term, low          Norway
      interest rate policies to support a recovery in the economies would however       Finland
      improve affordability. This would strengthen the consumer confidence and
                                                                                             Europe
      the housing market which in many areas are experiencing a housing shortage.

                                                                                                                                Čertův vršek, Prague, Czech Republic

      Commercial Property Development                                                          Nordics
      A decline in transaction volumes is expected as the uncertainties in              Sweden
      the financial markets will turn property investors more risk-averse.
      The economic uncertainty will also have a negative impact on the availability     Norway
      of credit. Once the Covid-19 pandemic and its toll on the economies has           Finland
      bottomed out and uncertainties are being reduced the transaction volumes          Denmark
      are likely to recover. Deteriorating economies is impacting the leasing
      market negatively and rent levels are expected to come down. However,                    Europe
      several monetary and fiscal stimuli packages to contain the negative              Poland
      economic impact have been launched and could contribute to a recovery.            Czech Republic
                                                                                        Hungary
                                                                                        Romania
                                                                                               USA

                                                                                                                                High 5ive, Krakow, Poland
Skanska Three month report, January–March 2020 5
Performance analysis
Group
Revenue and operating income, rolling 12 months Revenue per segment, January–March 2020
SEK bn, operating income SEK bn, revenue
12 240
10 200
8 160
6 120
• Construction, 81%
• Residential Development, 8%
4 80 • Commercial Property
Development, 11%
2 40
0 0
2016 2017 2018 2019 2020
Q2 Q3 Q4 Q1 Q2 Q3 Q4 Q1 Q2 Q3 Q4 Q1 Q2 Q3 Q4 Q1 Q2 Q3 Q4 Q1
Revenue
Operating income
Operating income per segment, January–March 2020
Revenue and earnings
Jan-Mar Jan-Mar Change,
SEK M 2020 2019 %
Revenue 41,166 35,102 17
Operating income 1, 2 2,901 488 494
Net financial items –48 –62 –23
• Construction, 19%
Income after financial items 2,853 426 570 • Residential Development, 13%
• Commercial Property
Development, 68%
Taxes -470 –71 562
Profit for the period 2,383 355 571
Earnings for the p
eriod per share, SEK 3 5.78 0.87 568
Earnings for the period per share according to
to IFRSs, SEK 3 2.91 2.11 38
1 Central, SEK –121 M (–148).
2 Eliminations, SEK –73 M (–17).
3 Earnings for the period attributable to equity holders divided by the average number of Revenue increased 17 percent and amounted to SEK 41.2 billion
shares outstanding.
(35.1); adjusted for currency effects revenue increased 14 percent.
Operating income increased 494 percent and amounted to
SEK 2,901M (488); adjusted for currency effects operating income
increased 489 percent. Operating income was strong in all three
Changes and currency rate effects business streams. The operating income was positively impacted
Jan-Mar 2020 / Jan-Mar 2019 by two significant divestments within Commercial Property
Change in local Development.
Change in SEK currency Currency effect Central expenses totaled SEK –121 M (–148) of which SEK –5 M
Revenue 17% 14% 3% (25) relate to the PPP-portfolio. The elimination of gains in
Operating income 494% 489% 5% Intra-Group projects amounted to SEK –73 M (–17).
Net financial items amounted to SEK –48 M (–62).
Taxes for the period amounted to SEK –470 M (–71),
corresponding to an effective tax rate of 16 percent (17).
6 Skanska Three month report, January–March 2020
Cash flow
Group
Operating cash flow from operations Operating cash flow from operations amounted to SEK 1,631 M
SEK bn (–1,319), where change in net divestments in Commercial Property
10 Development is the main reason for the change in cash flow.
8 Taxes paid in business operations amounted to SEK –579 M (–351)
and the increase is a result of higher income after financial items.
6
Commercial Property Development assets sold but not transferred
4
will have a positive effect on cash flow of SEK 8.9 billion, of which
2 SEK 6.9 billion will be received during 2020. The remainder will
0 affect cash flow during 2021 and 2022.
-2
-4
-6
2016 2017 2018 2019 2020
Q2 Q3 Q4 Q1 Q2 Q3 Q4 Q1 Q2 Q3 Q4 Q1 Q2 Q3 Q4 Q1 Q2 Q3 Q4 Q1 Free working capital in Construction
• Operating cash flow from operations, quarterly SEK bn %
Rolling 12 months
30 18
Operating cash flow 25 15
Jan-Mar Jan-Mar Change,
SEK M 2020 2019 % 20 12
Cash flow from business operations 746 831 –10 15 9
Change in working capital 279 –525 –
10 6
Net divestments(+) /investments(–) 1,478 –1,160 –
5 3
Cash flow adjustment 33 34 –3
0 0
Cash flow from business operations before 2016 2017 2018 2019 2020
Q2 Q3 Q4 Q1 Q2 Q3 Q4 Q1 Q2 Q3 Q4 Q1 Q2 Q3 Q4 Q1 Q2 Q3 Q4 Q1
taxes paid 2,536 –820 –
Taxes paid in business operations –579 –351 65 • Free working capital, SEK bn • Free working capital, end of Q1, SEK bn
Average free working capital/Construction revenue, rolling 12 months, %
Cash flow from financing operations –326 –148 120
Operating cash flow from operations 1,631 –1,319 –
Free working capital in Construction amounted to SEK 26.7 billion
Net strategic divestments(+)/investments(–) 0 –6 –
(25.5), with average free working capital in relation to Construction
Dividend etc 0 0 – revenue in the past 12 months at 15.8 percent. Free working capital
Cash flow before change in interest-bearing in Construction remained at a good level due to favorable cash flow
receivables and liabilities 1,631 –1,325 – profiles in several projects and continued focus on cash generation
Change in interest-bearing receivables and liabilities in the Construction stream. Cash flow due to changes in working
excluding lease liabilities 1,645 –1,200 –
capital in Construction amounted to SEK –693 M (–892).
Cash flow for the period 3,276 –2,525 –
City Gate, Gothenburg, Sweden
Skanska Three month report, January–March 2020 7
Financial position
Adjusted interest-bearing net receivables(+)/net debt(–) At the end of the quarter, cash, cash equivalents and committed
SEK bn unutilized credit facilities amounted to SEK 19.3 billion
6 (December 31, 2019: 17.6), of which SEK 17.0 billion (December 31, 2019:
4 11.8) is available within one week. The Group central loan portfolio
2 amounted to SEK 3.7 billion (December 31, 2019: 3.5) consisting of
0
SEK 1.0 billion in Medium-Term Note (MTN) program with an
average maturity of 1.9 years and SEK 2.7 billion in bilateral loans with
-2
an average maturity of 3.0 years. At March 31, the Group’s unutilized
-4
credit facilities totaled SEK 7.1 billion. The central loan portfolio,
-6 including committed unutilized credit facilities, had an average matu-
-8 rity of 3.6 years (December 31, 2019: 3.4). At the end of the quarter,
-10 capital employed amounted to SEK 58.8 billion (December 31, 2019:
2016 2017 2018 2019 2020
Q2 Q3 Q4 Q1 Q2 Q3 Q4 Q1 Q2 Q3 Q4 Q1 Q2 Q3 Q4 Q1 Q2 Q3 Q4 Q1 55.9).
Balance sheet – Summary Equity
Mar 31, Mar 31, Dec 31,
SEK bn 2020 2019 2019 Changes in equity
Total assets 131.5 125.6 126.0 Jan-Mar Jan-Mar Jan-Dec
SEK M 2020 2019 2019
Total equity 34.8 28.0 33.0
Interest-bearing net receivables (+)/net debt (–) –3.2 –7.2 –4.9 Opening balance 33,021 29,347 29,347
Change in accounting principle1 – –67 –67
Adjusted interest-bearing net receivables(+)/
net debt(–) 5.3 0.9 3.2 Adjusted opening balance 33,021 29,280 29,280
Capital employed, closing balance 58.8 52.8 55.9 Dividend to shareholders 0 –2,462 –2,462
Equity/assets ratio, % 26.5 22.3 26.2 Other changes in equity not included in total
comprehensive income for the year 70 60 219
Change in net interest-bearing receivables and liabilities Profit for the period 1,199 864 6,054
Jan-Mar Jan-Mar Jan-Dec Other comprehensive income
SEK M 2020 2019 2019 Translation differences 734 705 679
Opening balance interest-bearing net Effects of remeasurements of pensions –69 –361 –729
receivables(+)/net debt(–) –4,917 3,231 3,231
Effects of cash flow hedges –165 –52 –20
Change in accounting principle 1 – –7,469 –7,469
Closing balance 34,790 28,034 33,021
Adjusted opening balance –4,917 –4,238 –4,238
1 Change in accounting principle is attributable to the implementation 2019 of IFRS 16.
Cash flow for the period 3,276 –2,525 –2,074 For further information see the Annual and Sustainability Report 2019, Note 1.
Less change in interest-bearing receivables and
liabilities –1,645 1,200 3,415
Adjusted equity, less standard tax of 10 percent
Cash flow before change in interest-bearing
receivables and liabilities 1,631 –1,325 1,341 SEK bn
Translation differences, net 50
receivables/net debt –131 120 129
40
Remeasurements of pension liabilities –10 –445 –751
30
Interest-bearing liabilities acquired/divested
Other changes, interest-bearing net
0 –615 –505
• PPP-portfolio
Effect in unrealized equity in
20
receivables/net debt 183 –648 –893
• Property
Unrealized Commercial
Development gains
Change in interest-bearing net
receivables/net debt 1,673 –2,913 –679
10
• Residential surplus
Unrealized value in
Development
Closing balance interest-bearing net
receivables(+)/net debt(–) –3,244 –7,151 –4,917
0
Mar 31, 2019 Dec 31, 2019 Mar 31, 2020
• Equity attributable to equity holders
Restricted cash –5,709 –6,000 –6,084
Pension liability, net 5,270 4,960 5,321
The Group’s equity amounted to SEK 34.8 billion (28.0), resulting
Lease liabilities 8,977 9,078 8,921
in an equity/assets ratio of 26.5 percent (22.3) and a net debt/equity
Closing balance adjusted interest-bearing net ratio of 0.1 (0.3). The strengthening of the equity position relative to
receivables(+)/net debt(–) 5,294 887 3,241
the comparable period is related to the absence of a dividend pay-out and
1 Change in accounting principle is attributable to the implementation 2019 of IFRS 16.
For further information see the Annual and Sustainability Report 2019, Note 1.
higher profit.
Translation differences amounted to SEK 734 M (705) and are due to a
weaker Swedish krona. Unrealized surplus values in Project
Adjusted interest-bearing net receivables (+)/net debt (–) amounted Development including the PPP-portfolio amounted to SEK 14.6 billion
to SEK 5.3 billion (December 31, 2019: 3.2). Interest-bearing net debt of which SEK 2.3 billion was realized according to segment reporting.
amounted to SEK –3.2 billion (December 31, 2019: –4.9) and include Corresponding amounts less standard tax were SEK 13.2 billion and
SEK 9.0 billion in interest-bearing lease liabilities according to IFRS SEK 2.1 billion respectively.
16.
8 Skanska Three month report, January–March 2020
Investments and divestments
Investments and divestments Investments, divestments and net divestments(+)/investments(-)
Jan-Mar Jan-Mar Change,
SEK bn
SEK M 2020 2019 %
15
Investments
10
Construction –295 –859 –66
5 Residential Development –2,709 –2,222 22
Commercial Property Development –2,581 –2,976 –13
0
Other –39 –18 117
-5 Total –5,624 –6,075 –7
-10 Divestments
Construction 23 124 –81
-15 2016 2017 2018 2019 2020
Q2 Q3 Q4 Q1 Q2 Q3 Q4 Q1 Q2 Q3 Q4 Q1 Q2 Q3 Q4 Q1 Q2 Q3 Q4 Q1 Residential Development 1,944 3,403 –43
• Divestments, • Investments, Net investments, Commercial Property Development 5,120 1,360 276
quarterly quarterly rolling 12 months
Other 15 22 –32
Total 7,102 4,909 45
The Group’s investments amounted to SEK –5,624 M (–6,075), Net divestments(+)/investments(–)
while divestments amounted to SEK 7,102 M (4,909), resulting in Construction –272 –735 –63
net divestments of SEK 1,478 M (–1,166). Residential Development –765 1,181 –
In Construction, investments totaled SEK –295 M (–859). These Commercial Property Development 2,539 –1,616 –
investments mainly relate to property, plant and equipment for the
Other –24 4 –
Group’s own operations. Net investments in Construction amounted
to SEK –272 M (–735). Depreciation of property, plant and Total 1,478 –1,166 –
equipment and depreciation of property, plant and equipment right- of which strategic 0 –6 –
of-use assets amounted to SEK –671 M (–651).
In Residential Development, investments totaled SEK –2,709 M
(–2,222), of which SEK –383 M (–366) relates to land acquisitions,
corresponding to 502 building rights. Divestments amounted to
SEK 1,944 M (3,403). Net investments in Residential Development Capital employed in Project Development
amounted to SEK –765 M (1,181).
SEK M Mar 31, 2020 Mar 31, 2019 Dec 31, 2019
In Commercial Property Development, investments totaled
Residential Development 13,301 12,873 12,954
SEK –2,581 M (–2,976), of which SEK –355 M (–225) relates to
investments in new land, while divestments amounted to Commercial Property Development 34,905 32,828 34,495
SEK 5,120 M (1,360). Net divestments in Commercial Property Total in Project Development 48,206 45,701 47,449
Development amounted to SEK 2,539 M (–1,616).
Investment, Ensjø Torg, Oslo, Norway Divestment, Solna United, Stockholm, Sweden
Skanska Three month report, January–March 2020 9
Performance analysis, business streams
Construction – Order situation
Order backlog, revenue and order bookings At the end of the quarter, the order backlog amounted to SEK 199.0
SEK bn billion compared to SEK 185.4 billion at the end of the previous quarter.
250 The order backlog corresponds to 15 months of production (December
31, 2019: 14).
200
150
100
Changes and currency rate effects
Change
50 Change in SEK in local currency Currency effect
Jan-Mar 2020 / Jan-Mar 2019
0
2016 2017 2018 2019 2020 Order bookings 51% 48% 3%
Q2 Q3 Q4 Q1 Q2 Q3 Q4 Q1 Q2 Q3 Q4 Q1 Q2 Q3 Q4 Q1 Q2 Q3 Q4 Q1
Mar 31, 2020 / Dec 31, 2019
Revenue, rolling 12 months Order bookings, rolling 12 months
Order backlog 7% 3% 4%
• Order backlog Order bookings per quarter
Order bookings and order backlog in Construction Major orders in the quarter
SEK bn Jan-Mar 2020 Jan-Mar 2019 Jan-Dec 2019 Geography Contract Amount SEK M Client
Order bookings 41.3 27.3 145.8
Europe Office project 3,000 Great Elm Assets Limited
Order backlog 1 199.0 190.1 185.4
Maryland Transportation
1 Refers to the end of each period. USA Bridge 2,900
Authority
Additional office
USA 2,400 Existing client
Order bookings amounted to SEK 41.3 billion (27.3); adjusted for improvements
currency effects order bookings increased 48 percent. On a rolling Nordic Hospital 2,000 Oulu University Hospital
12-month basis the book-to-build ratio was 100 percent (December 31,
2019: 91). The order bookings were strong across all markets during the USA Bridge 1,900
Delaware River
Port Authority
first quarter 2020 compared to the comparable period last year.
For more information, see page 26.
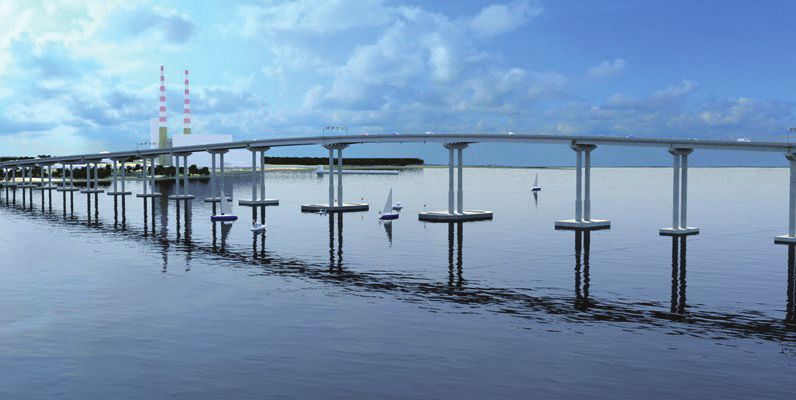
Bridge over the Potomac River, Virginia, USA
10   Skanska Three month report, January–March 2020

     Construction

     Revenue and operating margin, rolling 12 months                                    Changes and currency rate effects
     %                                                                     SEK bn                                              Jan-Mar 2020 / Jan-Mar 2019
     6                                                                       180                                                       Change in local
                                                                                                                     Change in SEK          currency         Currency effect
     5                                                                       150
                                                                                        Revenue                               2%                 -1%                    3%
     4                                                                       120        Operating income                     59%                54%                     5%
     3                                                                        90

     2                                                                        60
                                                                                        Revenue in the Construction business stream increased 2 percent
     1                                                                        30
                                                                                        and amounted to SEK 35.9 billion (35.3); adjusted for currency effects
     0                                                                          0       revenue decreased by 1 percent. Operating income increased 59 per-
     -1                                                                       -30       cent and amounted to SEK 589 M (371); adjusted for currency effects
                   2016        2017        2018        2019        2020
          Q2 Q3 Q4 Q1 Q2 Q3 Q4 Q1 Q2 Q3 Q4 Q1 Q2 Q3 Q4 Q1 Q2 Q3 Q4 Q1                   operating income increased 54 percent. The improvement in profit-
               Revenue                                                                  ability is related to enhanced performance in the USA and Europe,
               Operating margin                                                         while Nordics remains stable.

     Revenue and earnings
                                                       Jan-Mar   Jan-Mar   Change,
     SEK M                                                2020      2019        %

     Revenue                                           35,939    35,333             2
     Gross income                                       2,211     1,945         14
     Selling and administrative expenses               –1,621    –1,574             3
     Income from joint ventures and associated
     companies                                             –1         0             –
     Operating income                                     589       371         59

     Gross margin, %                                      6.2       5.5
     Selling and administrative expenses, %              –4.5      –4.5
     Operating margin, %                                  1.6       1.1
     Employees                                         31,796    34,351

     20 Ropemaker Street, London, UK
Skanska Three month report, January–March 2020 11
Residential Development
Revenue and operating margin, rolling 12 months Homes sold and started
% SEK bn Jan-Mar 2020 Jan-Mar 2019
20 20 Homes sold 911 740
Homes started 971 423
15 15
10 10 Homes under construction and unsold
Homes
5 5 9,000
8,000
0 0 7,000
2016 2017 2018 2019 2020
Q2 Q3 Q4 Q1 Q2 Q3 Q4 Q1 Q2 Q3 Q4 Q1 Q2 Q3 Q4 Q1 Q2 Q3 Q4 Q1 6,000
Revenue 5,000
Operating margin
4,000
3,000
2,000
Revenue and earnings
1,000
Jan-Mar Jan-Mar Change,
SEK M 2020 2019 % 0 2016 2017 2018 2019 2020
Q2 Q3 Q4 Q1 Q2 Q3 Q4 Q1 Q2 Q3 Q4 Q1 Q2 Q3 Q4 Q1 Q2 Q3 Q4 Q1
Revenue 3,400 2,141 59
Gross income 554 368 51
• Sold under construction • Unsold under construction • Unsold completed
Selling and administrative expenses –160 –170 –6
Operating income 394 198 99 Homes under construction and unsold
Gross margin, % 16.3 17.2 Mar 31, 2020 Mar 31, 2019 Dec 31, 2019
Selling and administrative expenses, % –4.7 –7.9 Homes under construction 6,948 6,454 7,130
Operating margin, % 11.6 9.2 of which sold, % 68 69 70
Return on capital employed, %1 11.5 11.3 Completed unsold, number of homes 139 403 134
1 For definition see page 16.
Revenue in the Residential Development business stream amounted Return on capital employed was 11.5 percent (11.3). At the end of
to SEK 3,400 M (2,141). The number of homes sold totaled 911 (740) the quarter, 6,948 homes (December 31, 2019: 7,130) were under
and construction started on 971 homes (423). Operating income construction. Of these, 68 percent (December 31, 2019: 70) were sold.
amounted to SEK 394 M (198). The operating margin amounted to The number of completed unsold homes amounted to 139 (December
11.6 percent (9.2). 31, 2019: 134). The number of completed homes amounted to 1,153
(1,508) in the first quarter of 2020.
Homes sold and started, rolling 12 months Breakdown of carrying amounts
Homes SEK M Mar 31, 2020 Mar 31, 2019 Dec 31, 2019
5,000 Completed projects 1,124 1,164 567
Ongoing projects 8,509 7,240 7,902
4,000
Undeveloped land and
development properties 7,991 7,823 8,196
3,000
Total 17,624 16,227 16,665
2,000
A breakdown of the carrying amounts for Residential Development
1,000
is presented in the table above. Ongoing projects amounted to
SEK 8.5 billion (December 31, 2019: 7.9) and undeveloped land and
0
2016 2017 2018 2019 2020 development properties amounted to SEK 8.0 billion (December 31,
Q2 Q3 Q4 Q1 Q2 Q3 Q4 Q1 Q2 Q3 Q4 Q1 Q2 Q3 Q4 Q1 Q2 Q3 Q4 Q1
2019: 8.2). The estimated unrealized surplus value in unsold homes
Sold in construction and undeveloped land and development properties
Started
amounted to SEK 3.3 billion. The undeveloped land and development
properties correspond to Skanska-owned building rights for 25,700
homes and 1,300 building rights held by joint ventures. In addition,
subject to certain conditions, the business stream has the right to
purchase 13,000 building rights.12 Skanska Three month report, January–March 2020
Commercial Property Development
Revenue and operating income from property divestments Unrealized and realized gains, segment reporting
SEK bn SEK bn
22 10
20
18 8
16
14
6
12
10
4
8
6
4 2
2
0 2016 2017 2018 2019 2020 0 2020
2016 2017 2018 2019
Q2 Q3 Q4 Q1 Q2 Q3 Q4 Q1 Q2 Q3 Q4 Q1 Q2 Q3 Q4 Q1 Q2 Q3 Q4 Q1 Q2 Q3 Q4 Q1 Q2 Q3 Q4 Q1 Q2 Q3 Q4 Q1 Q2 Q3 Q4 Q1 Q2 Q3 Q4 Q1
• Revenue from divestments, Operating income from divestments, Unrealized gains in: • Land •Ongoing projects • Completed projects
rolling 12 months rolling 12 months Realized gains, rolling 12 months
Revenue and earnings Leasing and degree of completion
Jan-Mar Jan-Mar Change, 000 sq m %
SEK M 2020 2019 %
550 100
Revenue 4,759 884 438 500 90
of which from divestment of properties 4,546 747 509 450 80
400
Gross income 2,330 182 1,180 70
350
60
Selling and administrative expenses –215 –229 –6 300
50
Income from joint ventures and a
ssociated 250
companies –3 131 – 200 40
150 30
Operating income 2,112 84 2,414
100 20
of which from divestment of properties 2,285 214 968 50 10
Return on capital employed, % 1 16.0 8.9 0
2016 2017 2018 2019
0
2020
1 For definition see page 16. Q2 Q3 Q4 Q1 Q2 Q3 Q4 Q1 Q2 Q3 Q4 Q1 Q2 Q3 Q4 Q1 Q2 Q3 Q4 Q1
• Leasing, rolling 12 months Occupancy rate, ongoing projects
Degree of completion, ongoing projects
In the Commercial Property Development business stream,
divestments worth SEK 4,546 M (747) were made in the first quarter
of 2020. Operating income amounted to SEK 2,112 M (84) and At the end of the quarter, Commercial Property Development had
included gains from property divestments totaling SEK 2,285 M (214) 37 ongoing projects. During the first quarter, one new project was
as well as income from joint ventures totaling SEK –3 M (131). started and six were completed. The 37 ongoing projects represent
Return on capital employed was 16.0 percent (8.9). leasable space of about 793,000 sq m with an occupancy rate of
57 percent, measured in rent. The projects’ degree of completion was 60
percent. Their investment value upon completion is expected to total
Breakdown of investment value and market value SEK 25.9 billion, with an estimated market value of SEK 32.9 billion.
Investment Investment Degree of
Of the ongoing projects, 14 have been divested according to segment
SEK M
value, end
of period
value upon
completion
Market
value 1,2
Occupancy
rate, %
comple-
tion, %
reporting. These projects represent an investment value upon
completion of SEK 5.6 billion, with a sales value of SEK 7.9 billion.
Ongoing projects 3 15,063 25,876 32,938 57 60
By the end of the first quarter the total number of completed projects
Completed projects 4,5 5,929 5,929 7,426 68 100
amounted to 12. The market value of these projects, excluding
Undeveloped land property divested according to segment reporting, was SEK 6.4 billion.
and development
properties 10,721 10,721 11,684 The occupancy rate, measured in rent, totaled 68 percent (December 31,
Total 31,713 42,526 52,048 2019: 65).
of which carrying At the end of the quarter, unrealized gains, excluding properties
amount 6 31,538 42,351 divested according to segment reporting totaled SEK 6.8 billion. These
of which completed gains related to SEK 4.7 billion in ongoing projects, SEK 1.1 billion in
projects sold
according to completed projects and SEK 1.0 billion in undeveloped land and
segment reporting 589 589 1,005 development properties.
of which ongoing Accumulated eliminations of Intra-Group project gains amounted to
projects sold
according to SEK 620 M. These eliminations are released at the Group level as each
segment reporting 3,733 5,561 7,898 project is divested. During first quarter new leases were signed for
1 Market value according to appraisal on December 31, 2019. 48,000 sq m (86,000).
2 Ongoing projects - estimated market value at completion fully leased.
3 Including tenant improvement and leasing commissions in CDUS amounted to SEK 485 M.
4 Including tenant improvement and leasing commissions in CDUS amounted to SEK 618 M.
5 Skanska’s share of total production cost in JVs is SEK 317 M end of period and upon
completion.
6 Includes Skanska’s total equity investment in JV of SEK 142 M.Skanska Three month report, January–March 2020 13
Personnel Financial reports for 2020
During the period, the average number of employees in the Skanska’s interim reports and year-end report are available for
Group was 33,330 (35,924). At the end of the quarter, the number download on Skanska’s website, www.skanska.com/investors
of employees totaled 33,535 people (December 31, 2019: 33,585).
The Group’s remaining interim reports for 2020 will be published
Transactions with related parties on the following dates:
For the nature and extent of transactions with related parties, see
the Annual and Sustainability Report 2019, Note 39. There were no July 23, 2020 Six Month Report
new significant transactions during the quarter. November 5, 2020 Nine Month Report
February 5, 2021 Year-end Report
Material risks and uncertainties
For information about risks and a description of key estimates and
judgments, see the Annual and Sustainability Report 2019, pages
50-54, Note 2 and 6, as well as the section above on market outlook. Stockholm April 28, 2020
Other matters Anders Danielsson
President and Chief Executive Officer
Annual General Meeting
Due to the prevailing uncertainty caused by Covid-19, the Board
of Directors decided to withdraw the dividend proposal to the This interim report has not been subject to a review by the
Annual General Meeting on March 26, 2020. The Annual General company’s auditors.
Meeting resolved that no dividend shall be paid, in accordance
with the Board’s proposal. The Board of Directors has the ambition,
if the circumstances permit, to convene an Extra General Meeting
in the autumn to decide on the dividend. The meeting re-elected
Hans Biörck, Pär Boman, Jan Gurander, Fredrik Lundberg,
Catherine Marcus, Jayne McGivern and elected Åsa Söderström
Winberg as Board members. Hans Biörck was re-elected as
Chairman of the Board.
Repurchase of shares
At the statutory Board meeting on March 26, 2020, the Board
resolved to exercise the authorization given by the Annual General
Meeting on March 26, 2020 to acquire own Series B shares in
Skanska on the following terms and conditions to secure delivery
of Series B shares to participants in the Skanska employee
ownership program adopted by the Annual General Meeting on
March 28, 2019 (Seop 5). Acquisitions may be made on one or
several occasions, however at the latest until the 2021 Annual
General Meeting, of no more than 1,200,000 Series B shares in
Skanska on Nasdaq Stockholm at a price within the from time to
time applicable range of prices (spread) on Nasdaq Stockholm,
meaning the interval between the highest purchase price and the
lowest selling price. Acquired own Series B shares in Skanska may
be transferred to participants in Seop 5 in accordance with the
conditions stipulated in the decision by the Annual General
Meeting on March 28, 2019. On March 26, 2020 Skanska held
8,107,126 Series B shares in its own custody.
Events after the end of the report period
There were no events after the end of the report period.14 Skanska Three month report, January–March 2020
Accounting principles Joint ventures are reported under the proportional method in the
For the Group, this interim report has been prepared in compliance segment reporting of Residential Development, whereas all other
with IAS 34 Interim Financial Reporting, the Annual Accounts Act streams/operating segments apply the equity method.
and the Securities Market Act. For the Parent Company, the interim Intra-Group pricing between operating segments occurs on
report has been prepared in compliance with the Annual Accounts market terms.
Act, the Securities Market Act, and Swedish Financial Reporting The Parent Company in a Swedish Group prepares its accounts in
Board’s Recommendation RFR 2. compliance with the Swedish Financial Reporting Board’s
As of January 1, 2020, the Group applies the amendments to IFRS Recommendation RFR 2 Accounting for Legal Entities (“RFR 2”).
9 and IFRS 7 attributable to the Interest Rate Benchmark Reform. According to RFR 2, the annual accounts of the legal entity must
In connection with the reform, the amendment provides temporary apply IFRS as far as this is possible within the framework of the
relief regarding specific requirements when hedge accounting is Annual Accounts Act and considering the connection between
applied. The relief aims to ensure that hedge accounting does not accounting and taxation.
end in connection with the reform. The change has not had any
significant impact on the Group’s financial reports.
Relation between consolidated operating cash flow statement
and consolidated cash flow statement
The difference between the operating cash flow statement and the
summary cash flow statement in compliance with IAS 7 Cash flow
Statements, is presented in the Annual and Sustainability Report
2019, Note 35.
Segment and IFRS reporting
Skanska’s business streams Construction, Residential Development
and Commercial Property Development represent the group’s
operating segments. Tables in this report that refer to segment
reporting are shown with a shaded background. In certain cases, the
segment reporting differs from the consolidated results presented in
accordance with International Financial Reporting Standards, IFRS.
Construction includes both building construction and civil con-
struction. Revenues and earnings are reported over time for both
segment and IFRS reporting.
Residential Development develops residential projects for
immediate sale. Homes are adapted to selected customer categories.
The units are responsible for planning and selling the projects.
The related construction assignments are performed by Skanska’s
construction units in the Construction segment in each market. In
the segment reporting Residential Development recognizes revenue
and earnings when contracts are signed for the sale of homes. In
the IFRS reporting revenues are instead recognized when the buyer
takes possession of the homes.
Commercial Property Development initiates, develops, leases
and divests commercial property projects. In most markets the
construction assignments are performed by Skanska’s Construction
segment. In the segment reporting Commercial Property
Development r ecognizes revenue and earnings when contracts are
signed for the sale of the properties. In the IFRS reporting revenues
are instead recognized when the buyer takes possession of the
property.Skanska Three month report, January–March 2020 15
Definitions
For further definitions, see the Annual and Sustainability Report 2019, Note 43.
Non-IFRS financial
measures Definition Reason for use
The following measures are used as they are
viewed as the best and most accurate ways to
measure Skanska’s operations; reflecting its
business model and strategy. Thus assisting
investors and management in analyzing trends
and performance in Skanska.
Revenue Segment Revenue segment is the same as revenue IFRS in all streams except for Measure revenue generated in current market
the Residential Development stream and the Commercial Property environment.
Development stream, where revenue is recognised for when signing
binding agreement for sale of homes and properties. As segment reporting
of joint ventures in Residential Development applies the proportional
method, revenue segment is affected by this.
Gross income Revenue minus cost of sales. Measure profit generated from projects.
Gross margin Gross income as a percentage of revenue. Measure profitability in projects.
Selling and admin expenses % Selling and administrative expenses as a percentage of revenue. Measure cost efficiency in selling and
administrative expenses.
Operating income Revenue minus cost of sales, selling and administrative expenses Measure profit generated from operations.
and income from joint ventures and associated companies.
Operating income segment Revenue minus cost of sales, selling and administrative expenses and Measure profit generated from operations in
income from joint ventures and associated companies, according to current market environment.
segment reporting, and where Residential Development applies the
proportional method for reporting of joint ventures.
Operating income Revenue minus cost of sales, selling and administrative expenses and Measure profit generated from operations.
rolling 12 months income from joint ventures and associated companies, rolling 12 months.
Operating margin Operating income as a percentage of revenue. Measure profitability in operations.
Net financial items The net of interest income, financial net pension cost, interest expense, Measure total net for financial activities.
capitalized expense, change in fair value and other net financial items.
Income after financial items Operating income minus net financial items. Measure profit generated before taxes.
Earnings per share, segment Profit for the period, segment, attributable to equity holders divided by Measure earnings per share, segment.
the average number of shares outstanding.
Book-to-build, rolling 12 months Order bookings divided by construction revenue, rolling 12 months. Measures to which extent new orders are
replacing work put in place.
Unrealized gains, Commercial Market value minus investment value upon completion for ongoing Measure potential realization of future gains in
Property Development (CD) projects, completed projects and land. Excluding projects sold according to Commercial Property Development.
segment reporting.
Capital employed, Group Total assets minus non-interest-bearing liabilities. Measure capital usage and efficiency.
Capital employed, Stream Total assets less tax assets, deposits in Skanska’s treasury unit and pension Measure capital usage and efficiency in a Stream.
receivable minus non-interest-bearing liabilities excluding tax liabilities.
Capitalized interest expense is removed from total assets for the Residential
Development and Commercial Property Development segments.
Capital employed Residential Total assets 22,055 Measure capital usage and efficiency in Residential
Development (RD) - tax assets –281 Development.
SEK M - deposits in internal bank –582
- pension receivable –33
- non-interest-bearing liabilities (excluding tax liabilities) –7,783
- capitalized interest expense –75
13,301
Capital employed Commercial Total assets 39,752 Measure capital usage and efficiency in
Property Development (CD) - tax assets –344 Commercial Property Development.
SEK M - deposits in internal bank 0
- pension receivable 0
- non-interest-bearing liabilities (excluding tax liabilities) –4,165
- capitalized interest expense –338
34,90516 Skanska Three month report, January–March 2020
Non-IFRS financial
measures Definition Reason for use
Capital employed average Calculated on the basis of five measuring points;
see below.
ROCE in RD segment, Operating income 1,391 Measure the performance (profitability and capital
rolling 12 months SEK M + capitalized interest expense 110 efficiency) in RD.
+/– financial income and other financial items 7
— interest income from internal bank –6
Adjusted profit 1,502
Capital employed average* 13,085
ROCE RD 11.5%
* Capital employed average
Q1 2020 13,301 x 0.5 6,651
Q4 2019 12,954 12,954
Q3 2019 13,444 13,444
Q2 2019 12,854 12,854
Q1 2019 12,873 x 0.5 6,437
52,340 / 4 13,085
ROCE in CD segment, Operating income 5,315 Measure the performance (profitability and capital
rolling 12 months + capitalized interest expense 262 efficiency) in CD.
SEK M +/– financial income and other financial items 19
– interest income from internal bank –2
Adjusted profit 5,594
Capital employed average* 34,927
ROCE CD 16.0%
* Capital employed average
Q1 2020 34,905 x 0.5 17,453
Q4 2019 34,495 34,495
Q3 2019 36,744 36,744
Q2 2019 34,600 34,600
Q1 2019 32,828 x 0.5 16,414
139,706 / 4 34,927
ROCE in Project Development, Is calculated as the summarized adjusted profit for RD and CD divided Measure the performance (profitability and capital
segment by the summarized capital employed average for RD and CD. efficiency) in Project Development.
SEK M
The total ROCE from RD and CD.
Adjusted
profit CE avg ROCE
RD 1,502 13,085 11.5%
CD 5,594 34,927 16.0%
7,096 48,012 14.8%Skanska Three month report, January–March 2020 17
Non-IFRS financial
measures Definition Reason for use
Return on equity segment, Profit attributable to equity holders as a percentage of Measure profitability on invested equity.
rolling 12 months average equity attributable to equity holders.
SEK M 8,375 /30,979 = 27.0%
Equity average attributable Calculated on the basis of five measuring points.
to equity holders
SEK M Q1 2020 34,692 x 0.5 17,346
Q4 2019 32,924 32,924
Q3 2019 30,204 30,204
Q2 2019 29,474 29,474
Q1 2019 27,935 x 0.5 13,968
123,916 / 4 30,979
Operating cash flow from Cash flow from business operations including taxes paid and Measure total cash flow generated from
operations cash flow from financing operations. operations.
Net divestments/investment Total investments minus total divestments. Measure the balance between investments and
divestments.
Free working capital Non-interest-bearing receivables less non-interest-bearing Measure the funding stemming from the negative
liabilities excluding taxes. working capital.
Average free working capital in Calculated on the basis of five measuring points. Measure the funding stemming from the negative
Construction working capital generated in Construction.
SEK M Q1 2020 –26,740 x 0.5 –13,370
Q4 2019 –26,401 –26,401
Q3 2019 –24,371 –24,371
Q2 2019 –24,332 –24,332
Q1 2019 –25,526 x 0.5 –12,763
–101,237 / 4 –25,309
Interest-bearing net receivables/ Interest-bearing assets minus interest-bearing liabilities. Measure financial position.
net debt
Adjusted interest-bearing net Interest-bearing net receivables/net debt excluding restricted Measure financial position and investment
receivables/net debt cash, lease liabilities and interest-bearing net pension liabilities. capacity. The latter is derived by comparing
adjusted interest-bearing net receivables/net debt
to limits set by the Board of Directors.
Equity/assets ratio Equity including non-controlling interest as a percentage of Measure financial position.
total assets.
Net debt/equity ratio Interest-bearing net debt divided by equity Measure leverage of financial position.
including non-controlling interest.
Adjusted equity attributable Equity attributable to equity holders 34.7 Measure financial position adjusted for surplus
to equity holders Unrealized surplus value in RD 3.3 values in Project Development net of taxes.
SEK bn Unrealized CD gains 9.5 The standard corporate tax represents an
Effect in unrealized equity in PPP-portfolio 1.8 approximation of the average corporate income
Less standard corporate tax, 10% –1.4 tax within the Group.
Adjusted equity 47.918 Skanska Three month report, January–March 2020
Reconciliation between segment reporting and IFRSs
External revenue Intra–Group revenue Total revenue Operating income
SEK M Jan-Mar 2020 Jan-Mar 2019 Jan-Mar 2020 Jan-Mar 2019 Jan-Mar 2020 Jan-Mar 2019 Jan-Mar 2020 Jan-Mar 2019
Construction 33,047 1 31,916 1 2,892 3,417 35,939 35,333 589 371
Residential Development 3,400 2,140 0 1 3,400 2,141 394 198
Commercial Property Development 4,686 882 73 2 4,759 884 2,112 84
Total operating segments 41,133 34,938 2,965 3,420 44,098 38,358 3,095 653
Central 33 164 94 4 127 168 –121 –148
Eliminations 0 0 –3,059 –3,424 –3,059 –3,424 -73 –17
Total Group 41,166 35,102 0 0 41,166 35,102 2,901 488
Reconciliation to IFRSs 2 –826 2,013 0 0 –826 2,013 -1,419 596
Total IFRSs 40,340 37,115 0 0 40,340 37,115 1,482 1,084
1 Of which external revenue from joint ventures in PPP-portfolio, SEK 1,740 M (1,587).
2 Of which effect from joint ventures in
Residential Development proportionally –192 –59 –58 –20
Of which effect of different revenue recognitions –634 2,072 -1,361 616
Revenue by geographical area (IFRS)
Commercial
Construction Residential Development Property Development Central and eliminations Total
Jan-Mar Jan-Mar Jan-Mar Jan-Mar Jan-Mar Jan-Mar Jan-Mar Jan-Mar Jan-Mar Jan-Mar
SEK M 2020 2019 2020 2019 2020 2019 2020 2019 2020 2019
Nordics 13,145 13,258 1,854 3,257 2,341 1,413 –1,834 –1,688 15,506 16,240
of which Sweden 7,644 7,697 1,164 1,690 782 1,389 –1,246 –1,135 8,344 9,641
Europe 6,245 6,815 72 159 1,296 21 –799 –856 6,814 6,139
USA 16,549 15,260 0 0 1,696 65 –225 –589 18,020 14,736
Total operating segments 35,939 35,333 1,926 3,416 5,333 1,499 –2,858 –3,133 40,340 37,115
Segment IFRS Segment IFRS
SEK M Jan-Mar 2020 Jan-Mar 2020 Jan-Mar 2019 Jan-Mar 2019
Revenue
Construction 35,939 35,939 35,333 35,333
Residential Development 3,400 1,926 2,141 3,416
Commercial Property Development 4,759 5,333 884 1,499
Central and eliminations –2,932 –2,858 –3,256 –3,133
Skanska Group 41,166 40,340 35,102 37,115
Operating income
Construction 589 589 371 371
Residential Development 394 87 198 475
Commercial Property Development1 2,112 1,016 84 406
Central –121 –121 –148 –148
of which PPP-portfolio –5 –5 25 25
Eliminations 1
-73 –89 –17 –20
Operating income 2,901 1,482 488 1,084
Net financial items –48 –47 –62 –47
Income after financial items 2,853 1,435 426 1,037
Taxes -470 –236 –71 –173
Profit for the period 2,383 1,199 355 864
Earnings for the period per share, SEK 2 5.78 0.87
Earnings for the period per share a
ccording to IFRSs, SEK 2 2.91 2.11
1 O f which gains from divestments of c ommercial properties reported in:
Commercial Property Development 2,285 1,189 214 536
Eliminations 122 95 22 42
2 Earnings for the period attributable to equity holders divided by the average number of shares outstanding.Skanska Three month report, January–March 2020 19
The Skanska Group
Summary income statement (IFRS)
SEK M Jan-Mar 2020 Jan-Mar 2019 Jan-Dec 2019
Revenue 40,340 37,115 172,846
Cost of sales –36,781 –34,128 –156,540
Gross income 3,559 2,987 16,306
Selling and administrative expenses –2,136 –2,156 –9,469
Income from joint ventures and associated companies 59 253 591
Operating income 1,482 1,084 7,428
Financial income 89 35 188
Financial expenses –136 –82 –276
Net financial items 1 –47 –47 –88
Income after financial items 1,435 1,037 7,340
Taxes –236 –173 –1,286
Profit for the period 1,199 864 6,054
1 Of which
Interest income 64 32 152
Financial net pension costs –14 –19 –84
Interest expenses –43 –69 –209
Interest expenses from lease liabilities –69 –71 –272
Capitalized interest expenses 57 92 307
Net interest items –5 –35 –106
Change in fair value –1 0 4
Other net financial items –41 –12 14
Net financial items –47 –47 –88
Profit attributable to:
Equity holders 1,197 864 6,031
Non-controlling interests 2 0 23
Earnings per share, SEK 2
2.91 2.11 14.68
Earnings per share after dilution, SEK 3 2.89 2.10 14.62
2 Earnings for the period attributable to equity holders divided by the average number of shares outstanding.
3 Earnings for the period attributable to equity holders divided by the average number of shares outstanding after dilution.
Statement of profit or loss and other comprehensive income (IFRS)
SEK M Jan-Mar 2020 Jan-Mar 2019 Jan-Dec 2019
Profit for the period 1,199 864 6,054
Other comprehensive income
Items that will not be reclassified to profit and loss
Remeasurements of defined benefit plans -121 -431 -895
Tax related to items that will not be reclassified to profit and loss 52 70 166
-69 -361 -729
Items that have been or will be reclassified to profit and loss
Translation differences attributable to equity holders 650 685 672
Translation differences attributable to non-controlling interests -1 2 3
Hedging of exchange rate risk in foreign operations 85 18 4
Effects of cash flow hedges 1 -97 -2 31
Share of other comprehensive income of joint ventures and associated companies 2 -65 -46 -41
Tax related to items that have been or will be reclassified to profit and loss -3 -4 -10
569 653 659
Other comprehensive income after tax 500 292 -70
Total comprehensive income 1,699 1,156 5,984
Total comprehensive income attributable to
Equity holders 1,698 1,154 5,958
Non-controlling interests 1 2 26
1 Of which transferred to income statement 0 0 2
2 Of which transferred to income statement 26 28 14820 Skanska Three month report, January–March 2020
Summary statement of financial position (IFRS)
SEK M Mar 31, 2020 Mar 31, 2019 Dec 31, 2019
ASSETS
Non-current assets
Property, plant and equipment 7,656 7,970 7,742
Property, plant and equipment right-of-use assets 4,493 4,645 4,616
Goodwill 4,030 4,521 4,057
Intangible assets 847 989 865
Investments in joint ventures and associated companies 3,355 3,238 3,442
Financial non-current assets 1,3 3,118 2,760 2,528
Deferred tax assets 1,670 2,250 1,862
Total non-current assets 25,169 26,373 25,112
Current assets
Current-asset properties2 47,917 44,734 46,373
Current-asset properties right-of-use land 4,175 4,154 3,980
Inventories 1,139 1,334 1,128
Financial current assets3 5,676 6,827 6,899
Tax assets 753 321 670
Contract assets 7,254 7,541 5,898
Trade and other receivables 27,255 26,043 27,213
Cash 12,161 8,281 8,745
Total current assets 106,330 99,235 100,906
TOTAL ASSETS 131,499 125,608 126,018
of which interest-bearing financial non-current assets 3,071 2,719 2,483
of which interest-bearing current assets 17,718 14,945 15,517
Total interest-bearing assets 20,789 17,664 18,000
EQUITY
Equity attributable to equity holders 34,692 27,935 32,924
Non-controlling interests 98 99 97
Total equity 34,790 28,034 33,021
LIABILITIES
Non-current liabilities
Financial non-current liabilities3 2,614 3,742 2,565
Lease liabilities 7,900 8,126 7,843
Pensions 6,320 6,061 6,866
Deferred tax liabilities 923 808 1,045
Total non-current liabilities 17,757 18,737 18,319
Current liabilities
Financial current liabilities3 6,320 5,958 4,617
Lease liabilities 1,077 952 1,078
Tax liabilities 320 598 564
Current provisions 9,754 9,851 10,021
Contract liabilities 21,747 21,601 20,419
Trade and other payables 39,734 39,877 37,979
Total current liabilities 78,952 78,837 74,678
TOTAL EQUITY AND LIABILITIES 131,499 125,608 126,018
of which interest-bearing financial liabilities 17,713 18,754 16,051
of which interest-bearing pensions and provisions 6,320 6,061 6,866
Total interest-bearing liabilities 24,033 24,815 22,917
1 Of which shares 46 40 44
2 Current-asset properties
Commercial Property Development 30,293 28,507 29,708
Residential Development 17,624 16,227 16,665
3 I tems regarding non-interest-bearing unrealized changes in derivatives/financial instruments are included in the following
amounts:
Financial non-current assets 1 1 1
Financial current assets 119 163 127
Financial non-current liabilities 2 4 2
Financial current liabilities 196 20 50
Note: Contingent liabilities amounted to SEK 41.4 bn on March 31, 2020 (Dec 31, 2019: 38.8) and relates to joint operations in Construction and joint ventures in Project Development.
For more information see 2019 Annual and Sustainability Report, Note 20B, 20C and 33. During the period, contingent liabilities increased by SEK 2.6 bn.You can also read