Q2 2021 INVESTOR UPDATE - August 12, 2021 - NorthWest Healthcare ...
←
→
Page content transcription
If your browser does not render page correctly, please read the page content below
Q2 2021
INVESTOR UPDATE
    August 12, 2021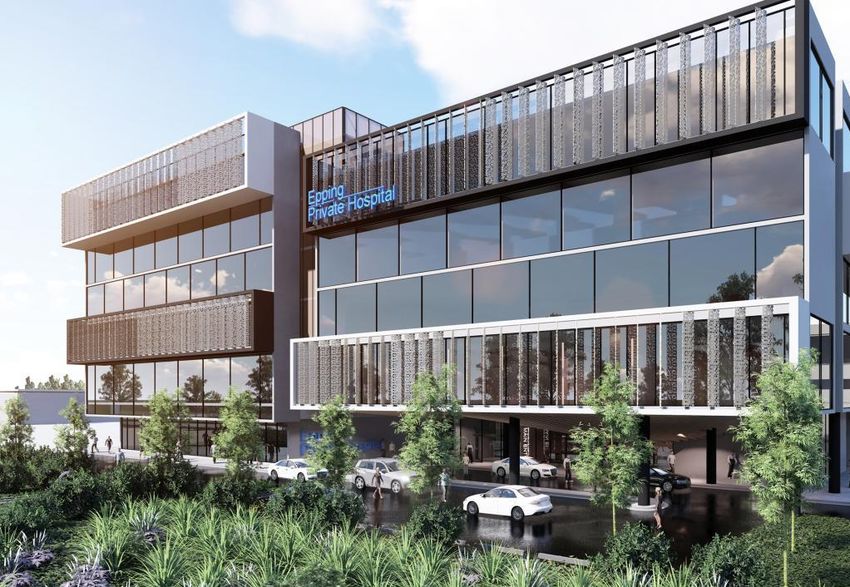
DISCLAIMER

 This presentation provides a summary description of Northwest Healthcare Properties Real Estate Investment Trust (“NWH” or the “REIT”). This presentation should be read in conjunction with
 and is qualified in its entirety by reference to the REIT’s most recently filed financial statements, management’s discussion and analysis, management information circular and annual information
 form (the “AIF”).

 This presentation contains forward-looking statements. These statements generally can be identified by the use of words such as “expect”, “anticipate”, “believe”, “foresee”, “could”, “estimate”,
 “goal”, “intend”, “plan”, “seek”, “strive”, “will”, “may”, “would”, “might”, “potential”, “should”, “stabilized”, “contracted”, “guidance”, “normalized”, or “run rate” or variations of such words and
 phrases. Examples of such statements in this presentation may include statements concerning: (i) the REIT’s financial position and future performance, including normalized and target financial
 metrics, forecasted liquidity and potential deleveraging transactions; (ii) joint venture conditional capital commitments and negotiations, potential acquisitions, dispositions and other transactions,
 including a potential UK joint venture, and transactions involving Aspen and Australian Unity; (iii) the REIT’s development pipeline and associated future value creation, (iv) the REIT’s property
 portfolio, cash flow and growth prospects, liquidity, un-deployed capital, leverage ratios, future financings and asset management fees, (v) the REIT’s intention and ability to distribute available
 cash to security holders, (vi) the industry in which the REIT operates and trends related thereto, and (vii) the REIT’s strategic and governance initiatives.

 Such forward-looking information reflects current beliefs of the REIT and is based on information currently available to the REIT. Other unknown or unpredictable factors could also have material
 adverse effects on future results, performance or achievements of the REIT. Forward-looking information involves significant risks and uncertainties, should not be read as a guarantee of future
 performance or results and will not necessarily be an accurate indication of whether or not, or the times at which, or by which, such performance or results will be achieved, and readers are
 cautioned not to place undue reliance on such forward-looking statements. The forward-looking statements contained in this presentation are based on numerous assumptions which may prove
 incorrect and which could cause actual results or events to differ materially from the forward-looking statements. Although these forward-looking statements are based upon what the REIT
 believes are reasonable assumptions, the REIT cannot assure investors that actual results will be consistent with this forward-looking information. Such assumptions include, but are not limited to,
 the assumptions set forth in this presentation, as well as assumptions relating to (i) completion of anticipated acquisitions, dispositions, development, joint venture, deleveraging and other
 transactions (some of which remain subject to completing documentation) on terms disclosed; (ii) the REIT’s properties continuing to perform as they have recently, (iii) the REIT successfully
 integrating past and future acquisitions, including the realization of synergies in connection therewith; (iv) various general economic and market factors, including exchange rates remaining
 constant, local real estate conditions remaining strong, interest rates remaining at current levels, the impacts of COVID-19 on the REIT’s business ameliorating or remaining stable; and (vii) the
 availability of equity and debt financing to the REIT. These forward-looking statements may be affected by risks and uncertainties in the business of the REIT and market conditions, including that
 the assumptions upon which the forward-looking statements in this presentation may be incorrect in whole or in part, as well as the various risks described in the AIF.

 These forward-looking statements reflect the REIT’s expectations only as of the date of this presentation. The REIT disclaims any obligation to update or revise any forward-looking statements,
 whether as a result of new information, future events or otherwise, except as required by law.

 Certain information concerning Vital Trust contained in this presentation has been taken from, or is based upon, publicly available documents and records on file with regulatory bodies. Although
 the REIT has no knowledge that would indicate that any of such information is untrue or incomplete, the REIT was not involved in the preparation of any such publicly available documents and
 neither the REIT, nor any of their officers or trustees, assumes any responsibility for the accuracy or completeness of such information or the failure by Vital Trust to disclose events which may
 have occurred or may affect the completeness or accuracy of such information but which are unknown to the REIT.

 Funds from operations (“FFO”), adjusted funds from operations (“AFFO”), net operating income (“NOI”), same property NOI (“SPNOI”), and net asset value (“NAV”) are not measures recognized
 under International Financial Reporting Standards (“IFRS”) and do not have standardized meanings prescribed by IFRS. FFO, AFFO, NOI, SPNOI, and NAV are supplemental measures of a real estate
 investment trust’s performance and the REIT believes that FFO, AFFO, NOI, SNOI and NAV are relevant measures of its ability to earn and distribute cash returns to unitholders. The IFRS
 measurement most directly comparable to FFO, AFFO, NOI and SPNOI is net income. The IFRS measurement most directly comparable to NAV is net equity. A reconciliation of NAV, NOI, FFO, AFFO
 and Normalized AFFO to net income is presented in the REIT’s management’s discussion and analysis of financial condition and results of operations of the REIT for the period ended June 30, 2021
 as filed on SEDAR.

                                                                                                   1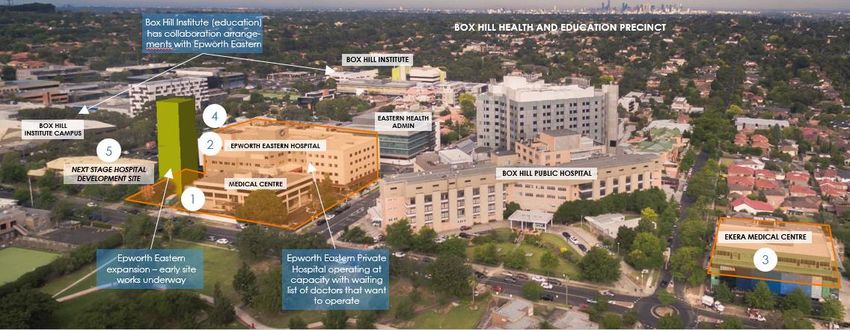
TORONTO
Focused Healthcare Real Estate Investment Partner

✓ Global scale, local relationships
  Partner of choice for leading operators
                                                                                                                        LONDON
                                                                                         SÃO PAULO
✓ Defensive operating fundamentals
  Cure focus underpinned by government funding

✓ A proven track record
  10+ year total shareholder return of 160% (10% CAGR)
                                                                                                                           MELBOURNE
                                                                  B E R L I N                             S Y D N E Y
✓ Scalable platform with embedded growth
  Robust acquisition and development pipeline
                                                                                       71% Global Gateway City Exposure

                                                                           Established Relationships with Leading Healthcare Operators

 NWH AT A GLANCE                                                                                CONSOLIDATED NOI
                                                                                                DIVERSIFICATION(4)

     16.1M                  190                  $8.3B
     SQUARE FEET           PROPERTIES          TOTAL ASSETS(3)

    96.7%                  14.2                  5.5%
     OCCUPANCY             YEAR WALE            IFRS CAP RATE

    $2.8B                  6.2%                   87%
    MARKET CAP (1)     DISTRIBUTION YIELD(1)   PAYOUT RATIO (2)

                                                                       2
HEALTHCARE REAL ESTATE - CURE VS CARE

                GLOBAL Healthcare Real Estate is estimated to be >$3T in value.

             NORTHWEST focuses on the CURE segment of Healthcare Real Estate.

                         CURE                                         CARE

    Higher Acuity                                                                       Lower Acuity

  Hospital    Post-acute Rehab    Outpatient   Life Sciences       Skilled    Assisted Living   Independent
              & Ambulatory Care     MOB                        Nursing/Aged                        Living
                                                                   Care

                         NWH FOCUS

                                                3
HEALTHCARE REAL ESTATE IN THE SPOTLIGHT
LTM RELATIVE TOTAL SHAREHOLDER RETURN PROJECTED OPERATING PERFORMANCE BY SECTOR
’20E – ’24E GSA NOI Growth Projections
180% 81.6%
110% 6.2% 6.2% 6.0%
(3.1)%
100% (4.0)%
160%
4.1%
(12.4)%
Return
90% 3.6%
TotalReturn
38.0%
80% (18.5)%
29.5%
140% 2.2%
27.0%
(22.0)%
IndexedTotal
70% 25.9% 1.3% 1.1%
120% (29.9)%
25.8%
Indexed
60%
(31.8)%
9.5%
Office
Mall
Industrial
Stu. Housing
Healthcare
Apartment
Life Science
Net Lease
50%
100%
40%
80%
30%
Jun-2020
Feb-2020 Aug-2020
Apr-2020 Oct-2020
May-2020 Dec-2020
Jun-2020 Feb-2021 Sep-2020
Aug-2020 Apr-2021 Nov-2020
Jun-2021
NWH CARE CURE Residential Office Lodging & Retail Industrial
SELECT ACUTE CARE & LIFE SCIENCE TRANSACTIONS (>$100mm) CAPITAL FORMATION
Public equity raised (C$ in millions) by US and Canada healthcare and
Date Size (C$mm) Buyer Seller
life science REITs3
MOB Portfolio Apr-21 $ 467 PEAK Undisclosed $ 7,000
Northwest
$ 6,277
UK Assets Jan-21 1,830 MPW ACHC Healthcare REIT
Cambridge Discovery
$ 6,000
$ 5,541
Nov-20 837 PEAK Harrison Street RE
Park
ARE Various
$ 5,000
39 Life Science Assets YTD Sep-20 2,642 $ 215 $ 225
Aspen Portfolio Aug-20 454 NWH WELL $ 4,000
$ 3,565
$ 3,169
Genesis / 4000 Shoreline Aug-20 1,275 VTR Bain Capital
$ 3,000
$ 2,745
Salt Lake City Assets Jul-20 1,287 MPW Undisclosed $ 2,186
UK Hospital Portfolio Feb-20 169 NWH BMI
$ 2,000
Circle Health Portfolio Jan-20 2,559 MPW BMI $ 1,000
$ 134 $ 77
Select Acute Care and Life Science transactions YoY across transactions $0
in excess of $100mm reflect the growing demand for Healthcare (CURE) 3Q19 4Q19 1Q20 2Q20 3Q20 4Q20 1Q21 2Q21
real estate assets
4
Source: IBES market data, SNL, GreenStreet Advisors Research. Market data as of 11-Nov-2020. |¹CARE includes GMRE, WELL, VTR, PEAK, OHI, DHC, NHI, LTC, SBRA, UHT, CTRE and CHCT. CURE includes DOC, HTA, HR and MPW. Residential includes Student
Housing, Manufactured Homes, and Apartments. Lodging & Retail includes Mall, Strip Center, and Lodging which consists of PK, HST, SVC, APLE, SHO, RLJ, RHP, PEB, DRH, XHR, INN, CLDT | 2 Mall includes SKT, TCO, MAC and SPG. Student Housing includes ACC.
Healthcare includes WELL, VTR, PEAK, HTA, HR, OHI and SBRA. Manufactured Homes includes ELS and SUI. Strip Center includes AKR, BRX, FRT, KIM, REG, ROIC, RPAI, SITC, UE, and WRI. Industrial includes DRE, EGP, FR, PLD, PSB, REXR and TRNO. Cold Storage
includes COLD. Life Science includes ARE and PEAK assets. Office includes AAT, ARE, BDN, BXP, CLI, CUZ, DEI, ESRT, EQC, HIW, HPP, JBGS, KRC, OFC, PDM, PGRE, SLG, VNO, and WRE. Apartment includes AIV, AVB, CPT, EQR, ESS, MAA and UDR. Self-Storage
includes CUBE, EXR, PSA, and LSI. Net lease includes NNN, O, SRC, STOR, VER, and WPC.|3 Includes ARE, CTRE, CHCT, GMRE, LTC, HR, HTA, PEAK, MPW, NHI, NWH, OHI, DOC, SBRA, UHT, VTR and WELL.
2021 STRATEGIC PRIORITIES

STRATEGIC INITIATIVES     SCALING GLOBAL ASSET
                                                                   GLOBAL EXPANSION                          FOCUS ON ESG
ALIGN WITH CONTINUED     MANAGEMENT PLATFORM
MATURATION OF THE
ORGANIZATION:            • Increasing scale through             • In 2020 the REIT successfully        •   REIT wide commitment to
                             capital deployment:                  entered the UK and acquired              development and
                             • Available undeployed               a high quality 10 hospital               implementation of an
SCALING THIRD-PARTY             capital totals $3.7B in           portfolio                                active ESG program;
MANAGEMENT PLATFORM             active funds
                         •   New fund initiatives:              • The REIT intends to extend           •   ESG is the top priority for
                             • Proposed UK JV is a top            its geographic footprint in              recently created, and
POTENTIAL EXPANSION TO          priority and will include         2021. Key markets under                  filled, role of Chief
                                the REIT’s expanded UK            consideration include:                   Administrative Officer
NEW MARKETS WITHIN
                                hospital portfolio                • The United States                      (CAO)
NORTH AMERICA AND            • Increasing scale in AUS            • Other Western Europe
WESTERN EUROPE                  to accommodate                                                         •   Commitment to issuing
                                strategic transactions                                                     inaugural ESG report in
                         •   Target: Be the leading                                                        2021, incorporating
ENHANCING THE REIT’S         healthcare real estate asset                                                  feedback from GRESB and
                             manager globally                                                              CDP evaluations
INSTITUTIONAL BRAND BY
FORMALIZING ITS ESG
PROGRAM                  BALANCE SHEET OPTIMIZATION AND ACHIEVEMENT OF INVESTMENT GRADE CREDIT METRICS

BALANCE SHEET
                                     Net Debt / EBITDA < 8.0x                                   Management Fees Growth
OPTIMIZATION &
                                           LTV < 50%                                               AFFOPU Growth
ACHIEVING INVESTMENT
GRADE METRICS

                                                            5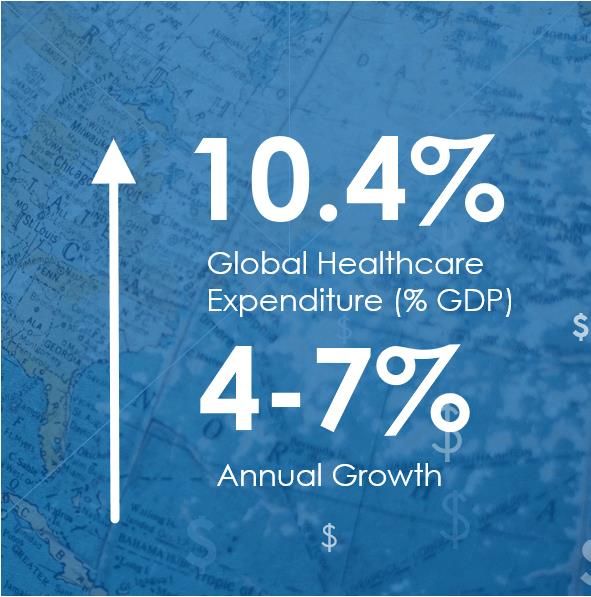
DELIVERING ON NAV GROWTH WITH MORE TO COME

                                                  6% YOY NAV/UNIT GROWTH

                       $1.37                ($0.26)                          ~8%
                                                                        Growth (constant
                                                           ($0.34)         currency)
                                                                                           $0.03

                                                                            $13.14                          $13.17

      $12.37

  Q2-20 NAV/Unit   IPP revaluation           FX             Other       Q2-21 NAV/Unit     FX          PF NAV/Unit

                                     CLEAR PATH TO A FURTHER +$250M OF VALUE CREATION

                                                                     Global Asset
       Institutionalization                                                                 Development
                                           UK Portfolio              Management
         of Healthcare
                                          Repositioning                Platform                 Accretion
           Real Estate
                                                                      Expansion

                                                               6
UK VALUE CREATION INITIATIVES NEARING COMPLETION

                           ~$650M                                     ~6.6%
                              TOTAL UK                             ACQUISITION CAP
                            INVESTMENT                                  RATE

                                            Substantial UK
 OPCO SALES PROCESS:
  ENHANCING CREDIT
                                            Value Creation                                   STRONG OPERATING
                                                                                             PERFORMANCE AND
 QUALITY AND TENANT
                                                                                             COVERAGE METRICS
   DIVERSIFICATION

       CLAREMONT PRIVATE           EDINBURGH CLINIC       CANCER CENTRE LONDON       HOLLY PRIVATE HOSPITAL

                                                      7
EXPANSION OF ASSET MANAGEMENT PLATFORM

                                                UK JV LEADS TO ~$75M OF VALUE CREATION

                                                                                $125M

                                                     $75M

                                                                                                            $725M

                     $525M

                     Q2-21                           UK JV                 AUS JV Expansion                Proforma
                    Valuation

                    UK MANAGER VALUATION                                                KEY INSTITUTIONAL RELATIONSHIPS

   ~$8M                          ~75%                        13x
  Stabilized Fees               EBITDA Margin         Valuation Multiple

                                 ~$75M
                             UK JV Value Creation
                                                                     8
DEVELOPMENT PIPELINE TO BE A SIGNIFICANT SOURCE OF VALUE CREATION
PIPELINE TO GENERATE NAV & EARNINGS GROWTH GROWTH OPPORTUNITIES
+$1B 6.5%
Development
Average Yield
Pipeline
$350M 100bps
Spread to Stabilized Healthcare Post-acute Rehab
Active Projects Precincts
Cap Rates & Ambulatory Care
+$100M +$1B
Value Creation Development Pipeline
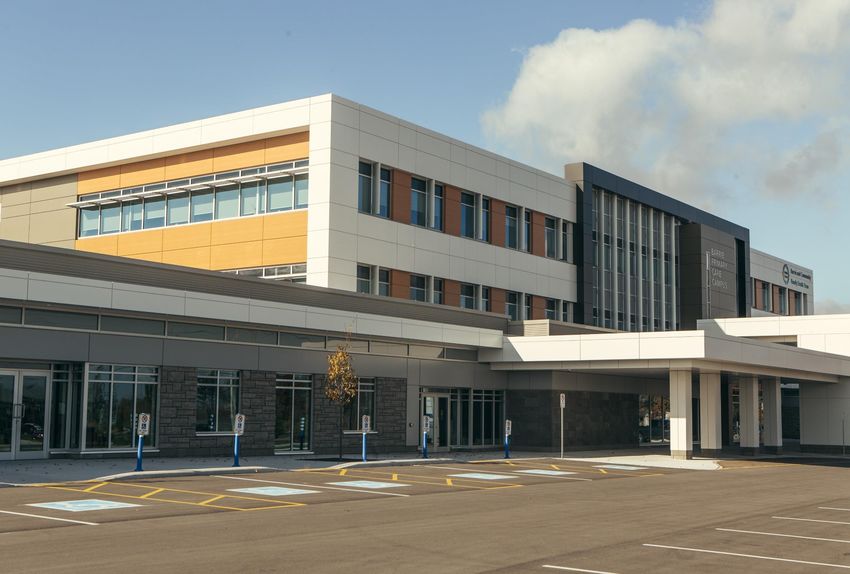
ACTIVE PROJECTS
EPWORTH EASTERN LAKERIDGE HEALTH ACURITY WAKEFIELD
9DEFENSIVE UNDERLYING PORTFOLIO
Operating Metrics Diversification
97% 98.8% 7 >2,000
Q2 2021 Cash &
Portfolio Occupancy Countries Tenants
Total Collections
Diverse tenants encompass
76% 14 yr hospitals operators,
Inflation Indexed rehabilitation clinics, life
WALE sciences and individual
Rents
STABLE practitioners
OPERATING
FUNDAMENTALS
> 80%
Tenants with Australia’s Leading
Government Support Hospital Operator
>$350B
One of Germany’s leading Brazil’s Leading
Stable Private Funding from Public
Rehabilitation Clinic Operators Hospital Operator
Healthcare Funding Healthcare Systems
Government Funding Strategic Relationships
10EVOLUTION OF ASSET MANAGEMENT PLATFORM
DUE TO THE GROWTH HISTORICAL CHART OF AUM AND OWNERSHIP
OF THE GLOBAL ASSET $9B $8.3B 100%
$7.8B
90%
MANAGEMENT $8B
75% 73%
$7B 70% $6.5B 80%
PLATFORM OVER THE $6B 61% $3.4B
$3.6B 70%
60%
PAST 5 YEARS, TOTAL $5B
$4.1B $4.1B $2.5B 56% 56% 50%
$4B
AUM HAS INCREASED $3.0B $1.1B $1.2B 40%
$3B
$0.7B 30%
FROM $3B TO $8.3B $2B $4.B $4.4B $4.7B
20%
$3.B $2.9B
WHILE LOOK THROUGH $1B $2.3B 10%
$B 0%
OWNERSHIP HAS 2016 2017 2018 2019 2020 Q2 2021
DECREASED TO 56% Owned AUM Third Party AUM Lookthrough Ownership
RETURNS COMPARISON KEY BENEFITS OF JV STRUCTURE
$100
Investment Direct JV
(5% Cap Rate) Reduced Equity Increased
Ownership 100% 30% Requirements Fees
LTV 65% 65%
Interest Rate ~3% ~3%
NOI $5 $1.5
Higher
Fees N/A $0.4
ROE
Interest Expense ($1.9) ($0.6)
Total Return $3.1 $1.3
Equity Required $35 $10.5
ROE 9% 12%
11INVESTMENT CREDIT GRADE METRICS ACHIEVED: POSITIONED FOR GROWTH
Target LTV of ~40% Proportionate Net Debt/EBITDA Bridge
(0.40x) (1.16x)
Forecast
57.6% 57.0%
52.1%
49.6%
48.0%
52.6%
48.0%
40.4% 39.6% 8.86x
44.3%
43.1% 7.30x
41.8%
34.5% 33.6%
Q3-20 Q4-20 Q1 21 Q2 21 Tranche F UK JV & Value Dev't &
Conversion* Creation Portfolio
Revaluation Q2-21 Tranche F UK JV Target
Conversion*
Consolidated Proportionate
~40% ~10 bps ~$450M ~5%
LTV WACR YTD Equity WAIR on Debt
Post UK JV Compression Issuance Repaid
* Based on the REIT’s $13.07/unit closing price on August 12, 2021, Series F which matures in 2021 is in the money. Includers the impact of the $25M private placement that closed July 22, 2021.
12BUSINESS MODEL
• WALE: 14.2 Years / Occupancy: 96.7%
SPNOI (Levered)
+5.8% • Inflation Indexed Leases: 76%
• Fee Bearing Capital*: $8.6B
Asset Management
+3.6% • Target Capital Commitments: $12.1B
Development
Accretion • Committed Developments: $347M
+0.3% • Development Yield: 100bps spread
~10% Annualized Return
+16% Recurring Return
+6% Distribution Yield
13
* Includes undeployed capacityFINANCIAL HIGHLIGHTS
14FINANCIAL DASHBOARD
As Reported Normalized
AFFO/unit (5) $0.86/unit $0.92/unit
LTV (6)/ 43.1% / 49.6% ~40%/~45%
Proportionate LTV
NAV (7) $13.14/unit ~$14/unit
Accretive JV Debt
Developments Deployment Repayment
15PROPORTIONATE INCOME STATEMENT
~8% AFFO PER UNIT
GROWTH DRIVEN BY
SPNOI GROWTH,
INCREASED Includes European &
Australian JV Acquisition Fees
MANAGEMENT FEES
AND REDUCED INTEREST
EXPENSE
Deleveraging through equity
issuance and reduced WAIR
2.9% ~9% 12 bps
SPNOI Growth AFFO/Unit Growth Reduction in
(Constant (Constant
Currency) Currency) WAIR
16PROPORTIONATE BALANCE SHEET
~6% NAV PER UNIT
GROWTH DRIVEN BY As at June 30
IMPROVED PROPERTY C$M 2020 2021 % change
+$200M
VALUATIONS OFFSET BY Investment Properties 3,971.3 4,662.2 17.4% Fair Value Gain
Other Assets 281.1 374.9 33.3%
FX DEPRECIATION Total Assets 4,252.5 5,037.1 18.5%
Mortgages, Loans and Convertible Debentures (2,398.7) (2,496.4) -4.1% ~$450M
2021 Equity Issuance
Other Liabilities (340.0) (423.7) -24.6%
Total Liabilities (2,738.7) (2,920.1) -6.6%
Global Manager 525.0 525.0 0.0%
Other Adjustments 155.3 209.1
Net Asset Value ("NAV") 2,194.0 2,851.0 29.9%
NAV per Unit $12.37 $13.14 6.3%
Gross Book Value ("GBV") 4,252.5 5,037.1 18.5%
Debt, including Convertible Debentures 2,398.7 2,496.4 4.1%
Debt to GBV 56.4% 49.6% (680) bps
~8%
3.2% NAV/Unit Growth +21%
WAIR (Constant AUM Growth
Currency)
17SIGNIFICANT VALUE CREATION IN GLOBAL ASSET MANAGER
Available
AUM NWH Stabilized
$8.6B OF GLOBAL Status
($B)
Capacity
($B)
Ownership
Term
Fees ($M)
CAPITAL Active Australian Core
Active $3.4 $1.3 30% Perpetuity $20
COMMITMENTS Hospital JV
DRIVING SIGNIFICANT Vital Active $2.3 Open 26% Perpetuity $25
VALUE CREATION IN
European JV Active
THE REIT’S ASSET $2.9 $2.4 30% 12 Years $15
MANAGER Australian JV
Committed $1.8 $1.8 30% Perpetuity $10
Expansion
INCREMENTAL NAV UK Healthcare Under
$1.7 $1.1* 20%-30% TBD $10
Fund Negotiation
Under
GROWTH ON Negotiation
Total $12.1 $6.6 $80
CONTINUED
EXPANSION OF THE
$200M
ASSET MANAGEMENT
PLATFORM $125M
$725M
$525M
$400M
Q3-19 European Q2-21 Committed & Under Proforma
Valuation Joint Venture Valuation Negotiation
AUM (B) $5.7 $2.9 $8.6 $3.5 $12.1
Stabilized
$45 $15 $60 $20 $80
Fees (M)
18
* Assumes existing UK portfolio seeds future JVRISK MANAGEMENT – FOREIGN EXCHANGE
OVER A 15 YEAR
PERIOD, THE REIT’S
NOI WEIGHTED
FOREIGN EXCHANGE
INDEX HAS REMAINED
RELATIVELY STABLE
RENTAL INDEXATION
ACTS AS NATURAL
CURRENCY HEDGE
PORTFOLIO SECURED
WITH LOCAL
CURRENCY DEBT
WHEREVER POSSIBLE
TO MINIMIZE FX RISK • Canada: FX • Europe: FX volatility • Australia: FX
appreciation due to an expected due to appreciation due to
increase in commodity vaccine distribution proximity to China’s
prices concerns economic recovery
• Brazil: FX depreciation • UK: Stable FX due to • New Zealand: FX
due to increased greater certainty stability expected since
inflation and political around “BREXIT” and the country’s
risk successful COVID-19 comparatively smaller
vaccine distribution population can be
vaccinated quicker
19GLOBAL HEALTHCARE
TRENDS
20GLOBAL HEALTHCARE MARKET
21TRENDS DRIVING GLOBAL HEALTHCARE
1. Population growth Aging Population
2. Aging population
3. Increase in obesity, addictions
4. Growing middle class in emerging markets
5. Increase in urban migration
1. Consolidation
Consolidation
2. Rise in health awareness and spending
3. Higher quality / value care
$195B
Global healthcare M&A
4. Shortage of qualified healthcare professionals deals in 2020
5. Changing funding models 716
deals in the
US alone
1. Emergence of new treatments
Emergence of New Treatments
2. Rise and new approaches for chronic diseases
3. Early prevention and detection
$2M
Surgical robot cost
4. Increasing digitalization of the hospital
↑5.2%
(per robot)
5. Emergence of remote medicine
Same-day hospitalizations
(vs ↑ 2.6% overnight)
22HEALTHCARE TRENDS IMPACT ON HEALTHCARE REAL ESTATE
HEALTHCARE TRENDS are driving real estate opportunities.
Outpatient / Increased
Aging Operator Increasing
Urbanization funding
population home care consolidation asset size
needs
Limited
Positive Positive Positive Positive Positive
Hospitals impact
Outpatient / Positive Positive Positive Positive Positive Positive
Medical Office
Limited Limited
Care Positive Positive Positive Positive
impact impact
Facilities
Life Sciences Positive Positive N/A N /A Positive Positive
/ Research
23INVESTMENT ACTIVITY
24CONSOLIDATED INVESTMENT ACTIVITY
2020 TRANSACTIONS
TRANSACTION TYPE REGION C$M
AUS/
Clinics, Hospitals and Life
Acquisition UK/GER/ 917
Sciences Assets
NL
JV Dispositions & Asset AUS/GER/
Disposition 976
Sales NL
UNITED KINGDOM
Total 1,893
2021 YTD TRANSACTIONS
TRANSACTION TYPE REGION C$M
Netherlands JV Disposition NL 24 AUSTRALIA GERMANY
Netherlands MOB Acquisition NL 176
Life Sciences Asset Acquisition NL 24
Vital Acquisition Acquisition AUS 30
Australian Unity
M&A AUS 110
Acquisition
Life Sciences Asset Acquisition CAD 15
Non-Core Asset Sales Disposition CAD 22
Total 401
25COMMITTED DEVELOPMENTS
• ~$347.2M (fully consolidated; $126.6M proportionate) of committed low risk development &
WITH A TRACK expansions in Australasia, Europe, Brazil and Canada to be funded through a combination of
existing resources and property financing
RECORD OF
▪ $276.8M ($69.5M proportionate) of Australasian hospital and MOB expansions
COMPLETING MORE ▪ $18.9M ($5.7M proportionate) of European developments
THAN $500M OF ▪ $27.4M of Brazilian hospital expansions
▪ $24.0M of Canadian MOB development
DEVELOPMENTS AND
• ~$79.1M ($24.0M proportionate) of stabilized value accretion on a proportionate basis
EXPANSIONS, THE ▪ Potential to generate up to an incremental ~$0.36 NAV/Unit ($0.11 NAV/Unit proportionate)
REIT IS LEVERAGING Potential
Est. Project Cost to Pre-Leased Project Project
ITS EXPERIENCE TO Country (8) Projects
Completion Cost Complete Occupancy Yield NOI
Value
Accretion
DELIVER AN
ADDITIONAL $347M 10
Q3 2021 to
276.8 124.0 97% ~6.2% 17.1 73.6
Q4 2023
OF VALUE
ENHANCING Q4 2021 to
2 18.9 12.0 100% ~5.3% 1.0 0.0
Q1 2022
PROJECTS TO ITS
PORTFOLIO
Q3 2021 to
2 27.4 27.4 100% ~7.5% 2.1 2.9
Q4 2022
1 Q1 2022 24.0 16.2 53% ~7.1% 1.7 2.5
Q3 2021 to
15 347.2 179.6 94% ~6.3% 21.9 79.1
Q4 2023
Note: represents post-quarter close development metrics
26PORTFOLIO OVERVIEW
27ASSET MIX BY REGION AND SEGMENT
ON A PROPORTIONATE PROPORTIONATE NOI DIVERSIFICATION
BASIS HOSPITALS Q2 2021 Q2 2021
ACCOUNT FOR 59% OF Australasia
Canada
Hospital and MOB
Healthcare
NET OPERATING 26%
22%
27% Facilities
Q2 2020 Q2 2020
30%
INCOME 41%
REGIONS ASSET MIX 48%
52%
INCREASING FOCUS 59%
27%
ON HEALTHCARE 21% 17%
Brazil
INFRASTRUCTURE, 30%
INCLUDING Europe
ACUTE/POST ACUTE Detailed Segment Breakdown
HOSPITALS AND
AUS NZ BRL CAD GER NL UK
RELATED BUILDINGS IN
EACH OF ITS MARKETS Acute hospitals
Post-acute hospitals
MOBs
Aged care
Life Sciences
High Priority Low Priority
28STRATEGIC RELATIONSHIPS AND TENANT DIVERSIFCATION
STRATEGIC RELATIONSHIPS ALLOWING FOR BEST-
TOP 10 TENANTS BY GROSS RENT(9)
IN-CLASS PERFORMANCE
TENANT REGION % GROSS RENT • Alberta Health Services (6
Locations): Largest provincial
1
healthcare provider to 4.3 M
Healthscope Limited 15.5% Albertans
2
Healthe Care 9.4%
3
Rede D’Or 7.8%
4
Aspen Healthcare 5.8% • Median (5 Transactions): Germany’s
largest private provider of
5
rehabilitation services
Epworth Foundation 5.0%
6
BMI Healthcare 2.5%
7
Acurity Group 2.1%
• Epworth Foundation (7 transactions):
8 The largest not-for profit hospital
Median Kliniken 1.7% operator in the Australian state of
Victoria
9
Bolton Clarke 1.1%
10
CISSS / CIUSSS 1.1%
• Rede D’Or (7 transactions):
Top 10 Tenants 51.9% Brazil’s leading hospital
operator
29CASE STUDY – EPWORTH EASTERN HOSPITAL, MELBOURNE
NON-FOR-PROFIT PRIVATE
HEALTHCARE GROUP THAT
RAISES FUNDS TO
PURCHASE ADVANCED
MEDICAL EQUIPMENT,
NorthWest has supported Epworth over 15+ years with expansion opportunities, advice and capital. Developments
FUND RESEARCH AND have added to the quality & value of assets, driving operational benefits & efficiencies that attract practitioners.
PROVIDE BEST POSSIBLE 2003-05 2014-17 2017-21
CARE TO PATIENTS Private hospital
Public and private hospitals Eastern Private Hospital
development leads to
EPWORTH EASTERN IS A drive health precinct announces major expansion
formation of precinct
LEADING HOSPITAL WITH
223 BEDS AND STATE OF • Development of Epworth Eastern • Acquisition of Ekera Medical Centre • $125m expansion of Epworth
Hospital (private) increases NorthWest assets in Eastern Hospital
THE ART EQUIPMENT AND • Establishes operator relationship precinct • Construction is in progress and
with Victoria’s largest not-for-profit • Strategic acquisition of adjacent site remains on target for late 2021
TECHNOLOGY private healthcare group for private hospital expansion completion.
• Public and private hospital co- • Public hospital major expansion • Epworth Eastern Hospital at
location further attracts specialists • Council designated ‘Education and capacity for 3 years
• Begins to drive early stage precinct Health precinct’ – targeted as a • New 30-year lease term over entire
formation high growth area with increased expanded hospital
density
30INVESTMENT OPPORTUNITY
31NORTHWEST OVERVIEW
GLOBAL HEALTHCARE REAL ESTATE INVESTMENT PARTNER
Global Dynamic
Capital Capital
Relationships Allocation
Accretive Strategic
Acquisition
Opportunities
NWH.UN Operator
Partnerships
Regional LISTED Brownfield
Operating Development
Platforms
TSE Opportunities
Healthcare Long Term
Precincts in Indexed
Urban Locations Leases
32RELATIVE VALUATION
THE REIT IS TRADING
AT A DISCOUNT TO
ITS PEERS ON AN
AFFO MULTIPLE BASIS
$15.10
- Based on NWH.UN’s closing unit price of $13.07/unit as of August 12, 2021, and normalized AFFO/Unit of $0.92 per year;
NWH.UN’s NAV/unit is based on Q2 2021 of $13.14.
33INVESTOR FACTSHEET
Ticker NWH.UN
Listed Exchange TSX
Distribution Payable Monthly
40% Other Income/
Distribution Type
60% Return on Capital
Unit Price (August 12, 2021) $13.07
Market Capitalization ~$2.8B
Distribution Yield 6.1%
52-Week Trading Range $10.90-$13.47
Volume Weighted Avg. Price (VWAP) (20-day) $12.99
Average Daily Volume (90-days) ~955,000
NAV/Unit (Q2 2021)(7) $13.14
34NOTES
1. Based on NWH.UN’s closing unit price of $13.07/unit as of August 12, 2021.
2. Based on the REIT’s distribution policy of $0.80/unit per annum and normalized Q2 2021 AFFO of $0.92/unit.
3. Based on total assets under management of NWH, Vital Trust on a fully consolidated basis including post-quarter acquisitions. NWH
owns a 26.0% interest in Vital Trust.
4. The pie chart fully reflects consolidated NOI and includes i) post- quarter acquisitions ii) 100% of NOI from Vital Trust and iii) 100% of the
NOI from the REIT’s institutional JVs including the Healthscope portfolio and European JV.
5. AFFO/unit is based on annualized Q2 2021 Reported AFFO/unit and adjusted for acquisitions, and financings as presented in the REIT’s –
Q2 2021 MD&A PART III.
6. LTV includes convertible debentures and is shown on a fully consolidated basis (Vital Trust at 100%) and includes the HSO portfolio
accounted for using the equity method.
7. Presented on a fully consolidated basis. Assuming projects are 100% debt funded at the existing region’s financing costs and is for
indicative purposes only.
8. Gross rent on a fully consolidated basis.
9. NAV is based on unitholder’s equity plus add-backs as set out in Part XII in the REIT’s Q2 2021 MD&A.
35CONTACT INFORMATION
NORTHWEST HEALTHCARE PROPERTIES REIT
Paul Dalla Lana, Chairman & CEO
pdl@nwhreit.com
416-366-2000 Ext. 1001
Shailen Chande, CFO
shailen.chande@nwhreit.com
416-366-2000 Ext. 1002
36You can also read