Q4 2018 Investor Presentation - Chartwell Retirement
←
→
Page content transcription
If your browser does not render page correctly, please read the page content below
Q4 2018 Investor Presentation

Cautionary Statements
This presentation contains forward-looking information that reflects the current expectations, estimates and
projections of management about the future performance and opportunities for Chartwell and the seniors
housing industry. The words “plans,” “expects,” “scheduled,” “estimates,” “intends,” “anticipates,”
“projects,” “believes” or variations of such words and phrases or statements to the effect that certain
actions, events or results “may,” “will,” “could,” “might” occur and other similar expressions identify forward-
looking statements. Forward-looking statements are based upon a number of assumptions and are
subject to a number of known and unknown risks and uncertainties, many of which are beyond our control,
and that could cause actual results to differ materially from those that are disclosed in or implied by such
forward-looking statements.
While we anticipate that subsequent events and developments may cause our views to change, we do not
intend to update this forward-looking information, except as required by applicable securities laws. This
forward-looking information represents our views as of the date of this presentation and such information
should not be relied upon as representing our views as of any date subsequent to the date of this
document. We have attempted to identify important factors that could cause actual results, performance or
achievements to vary from those current expectations or estimates expressed or implied by the forward-
looking information. However, there may be other factors that cause results, performance or achievements
not to be as expected or estimated and that could cause actual results, performance or achievements to
differ materially from current expectations. There can be no assurance that forward-looking information will
prove to be accurate. Accordingly, readers should not place undue reliance on forward-looking
information. See the "Risks and Uncertainties" section in our 2018 MD&A and risk factors highlighted in
materials filed with the securities regulatory authorities in Canada from time to time, including but not
limited to our most recent Annual Information Form.
In this document we use a number of performance measures that are not defined in generally accepted
accounting principles (“GAAP”) such as Net Operating Income (“NOI”), Funds from Operations (“FFO”),
Internal Funds from Operations (“IFFO”), “Adjusted Resident Revenue”, “Adjusted EBITDA”, “Net Debt to
Adjusted EBITDA Ratio”, “Liquidity”, “Imputed Cost of Debt”, “Lease-up-Losses”, “Adjusted Development
Costs”, “Unlevered Yield”, “Stabilized NOI” “Adjusted NOI”, and any related per unit amounts to measure,
compare and explain the operating results and financial performance of the Trust (collectively, the “Non-
GAAP Financial Measures”). These Non-GAAP Financial Measures do not have standardized meanings
prescribed by GAAP and, therefore, may not be comparable to similar measures used by other issuers.
The Real Property Association of Canada (“REALPAC”) issued white papers with recommendations for
calculations of FFO, Adjusted Funds from Operations (“AFFO”), and Adjusted Cash Flow from Operations
(“ACFO”) (the “REALPAC Guidance”). Our FFO definition is substantially consistent with the definition
adopted by REALPAC. Please refer to the “Additional Information on Non-GAAP Financial Measures”
section of our 2018 MD&A for details.
In this document we use various financial metrics and ratios in our disclosure of financial covenants such
as “Interest Coverage Ratio”, “Indebtedness Percentage”, “Unencumbered Property Asset Value”. These
metrics are calculated in accordance with the definitions contained in our credit agreements and the trust
indenture governing our outstanding debentures, and may be described using terms which differ from
standardized meanings prescribed by GAAP. These metrics may not be comparable to similar metrics
used by other issuers. Please refer to the “Liquidity and Capital Resources – Financial Covenants” section
of our 2018 MD&A for details.

 making people’s lives BETTER®                                                                                     1

Chartwell at a Glance

      Member of S&P/TSX                              Largest Canadian                                      Significant
       Composite Index                               Owner/ Operator                                       Employer
         since 2005
       $2.9 Billion (1)                             211 / 31,219 (2)                                        ~15,000
       Market Capitalization                   Communities / Suites & Beds                                   Employees

              Revenue                                Adjusted EBITDA                             High Occupancy Rates

       $955.1 Million                             $286.7 Million (3)                                       92.0% (4)

      Interest Coverage                                 Net Debt to                                       Debt to
            Ratio                                    Adjusted EBITDA                                   Capitalization

               3.2 (3)                                        7.8 (3)                                      43.4% (1)

(1)   Trust Unit price $13.67 at December 31, 2018
(2)   Includes development properties and Batimo Inc. (“Batimo”) development properties under management as at December 31, 2018
(3)   Rolling twelve months ended December 31, 2018 including proforma adjustments
(4)   Same property portfolio for the quarter ended December 31, 2018

      making people’s lives BETTER®                                                                                                2
Why Chartwell?

      1. Exceptional corporate culture and governance
      2. Winning customer focused business strategy
      3. Unmatched execution capability through national
         operating platform
      4. Significant industry long-term growth potential
           Demographic trends = more demand
           Government fiscal constraints = more private pay demand
           Fragmented industry = consolidation opportunities

      5. Solid financial position and investment grade
         credit

making people’s lives BETTER®                                        3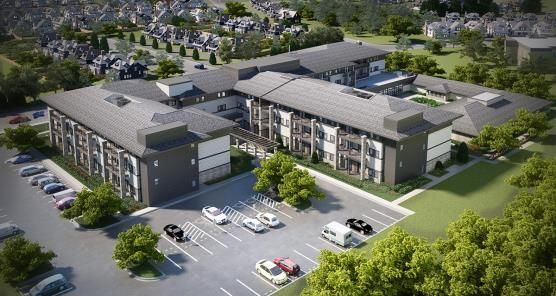
What’s our Why

making people’s lives BETTER®   4
Profile – Strong Governance
Globe and Mail Board Games 2018 - Ranked #7 in the Country
(Top Real Estate and Healthcare Company)
Tenure on
Board Members Relevant Experience
Chartwell’s Board
Senior business advisor at Fasken Martineau Du Moulin LLP
Michael D. Director of Canaccord Genuity Group Inc., Colliers International 15
Harris1,4 Group Inc., Route 1 Inc.
(Chair)
Former Premier of Ontario
Lise
Director of Laurentian Bank of Canada 14
Bastarache1,2,3
Former RBC Executive
Director of Gluskin Sheff + Associates Inc., Director of Women’s
Ann
College Hospital Foundation, Canada Guaranty Mortgage 2
Davis1,2,3
Insurance Company, Canadian Investor Protection Fund
Former partner of KPMG
Andre Director of Dorsay Development Corporation
Kuzmicki1,3 14
Former Executive Director of the Brookfield Centre in Real
(Chair, Investment
Committee) Estate, Schulich School of Business, York University
Sidney
Robinson1,4 Director of RIO2 Limited and Amerigo Resources Inc. 15
(Chair, CG&N Former Senior Partner of Torys LLP
Committee)
Sharon Trustee RioCan REIT
9
Sallows1,3,4 Director, Home Capital Group Inc. and AIMCO
Former principal at Ryegate Capital Corporation
Huw Trustee of SmartCentres REIT
Thomas1,2,4 7
Director of Dollarama
(Chair, Audit
Committee) Former CEO of SmartCentres REIT
W. Brent Binions See management team page 15
1 Independent
2 Member of the Audit Committee
3 Member of the Investment Committee
4 Member of the Compensation, Governance and Nominating Committee (“CG&N”)
making people’s lives BETTER® 5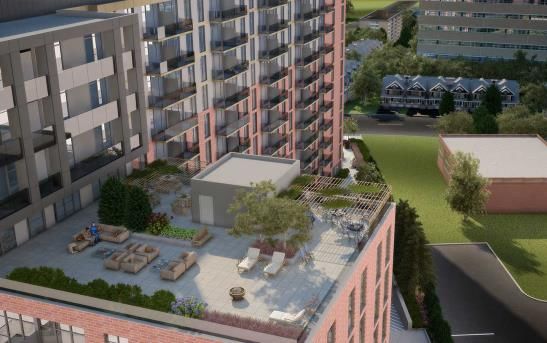
Profile - Experienced
Executive Team
100 years of collective industry experience
Tenure
Industry
Name & Title Past Experience with
Experience
Chartwell
W. Brent Binions1 Past President of the Ontario Long Term 15 37
President and Care Association and a past Vice
Chief Executive President of the Ontario Residential Care
Officer Association
Vlad Volodarski Prior to joining Chartwell, was a Senior 15 15
Chief Financial Manager with KPMG LLP
Officer & Chief
Investment Officer
Karen Sullivan Prior to joining Chartwell, held 11 32
Chief Operating progressive positions over a 21 year
Officer career at the Ontario Long Term Care
Association, including six years as their
Executive Director
Sheri Chateauvert Prior to joining Chartwell, held various 12 19
Chief positions at Retirement Residences
Administrative REIT including Senior Vice President of
Officer Finance and Director of Corporate
Accounting
Prior to joining Chartwell, practiced 11 11
Jonathan M.
corporate and securities law at Torys
Boulakia
Chief Legal Officer LLP
1 Also on the Board of Directors. Only non-independent board member.
making people’s lives BETTER® 6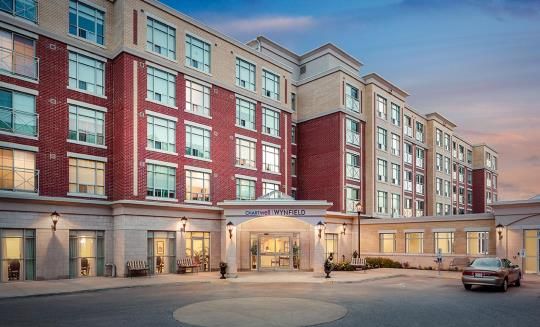
Business Strategy

    In 2023, we will achieve in our retirement
     residences, Employee Engagement of
           55% (highly engaged), Resident
    Satisfaction of 67% (very satisfied) and
                  Exceptional
     Same Propertyservices and
                    Occupancy  of 95% to
                  quality care
    drive strong IFFOPU growth by providing
        exceptional resident experiences
      through personalized services in our
     upscale and mid-market residences in
            urban and suburban locations.

making people’s lives BETTER®                    7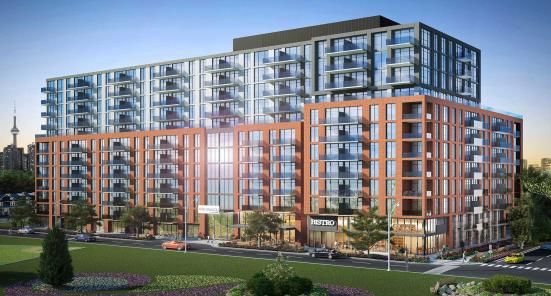
Business Strategy
              Employee Engagement                                     Highly Engaged
            60%                                                              55%

            50%                                           47%
                         40%              41%
            40%

            30%

            20%

            10%

              0%
                         2016            2017             2018            2023 Target

              Resident Satisfaction                                   Very Satisfied
            70%                                                              67%
                                                          58%
            60%          51%              53%
            50%
            40%
            30%
            20%
            10%
              0%
                         2016            2017             2018            2023 Target

              Retirement Same Property Occupancy (1)
            100.0%         92.6%           91.9%           90.5%             95.0%

             80.0%

             60.0%

             40.0%

             20.0%

               0.0%
                            2016            2017            2018          2023 Target
(1)    Same property Retirement Operations, as defined in each year

 making people’s lives BETTER®                                                          8
Business Strategy
Exceptional Resident Experience through
Personalized Services
Exceptional
services and
quality care
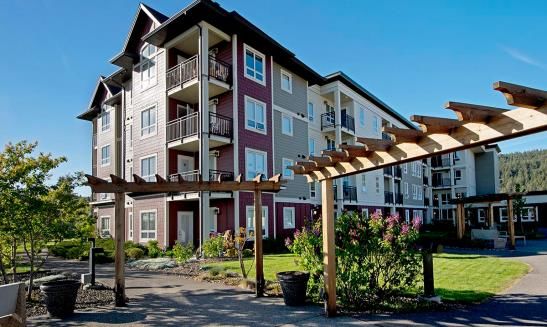
making people’s lives BETTER® 9Business Strategy – Our
Properties
• Urban and Suburban
• Upscale and Mid Market
• Own, Operate, Build
• Leader in four most populous provinces
By Ownership (1) (2) By Geographic Location (1)
Leader in each of its markets (3)
Province Share of Market
Ontario 16%
Quebec 8%
British Columbia 7%
Alberta 12%
1) Based on number of suites as at December 31, 2018 at Chartwell‟s share of ownership interest. Excluding development properties
and development properties managed for Batimo.
2) Minimum ownership of partially owned properties is 50%.
3) Ratio of Chartwell-operated suites to total retirement suites inventory as reported by CMHC in their Seniors‟ Housing Report -
Canada‟s Highlights (2018)
making people’s lives BETTER® 10Industry Profile
Independent Assisted Living (AL) Long Term Care (LTC)
Supportive Living & Memory Care (MC)
(ISL) & Independent
Living (IL)
Level of Care: Low to medium Medium to high Very high
Target More active, healthy seniors Seniors with some Seniors with acute cognitive
Resident: cognitive and/or physical and/or physical impairments
impairments requiring higher levels of daily
personal care
Service Activities, transportation, ISL/IL services + Care 24-hour registered nursing
Offering: security services and specific ML care or supervision
Availability of meals, programming included
housekeeping, basic
assistance with daily living
Funding: Predominantly private pay Mostly private pay Predominantly government
funded
Regulations: Mostly consumer protection Mostly consumer Heavily regulated
protection
Independent
Long Term Living, 5%
Care, 16%
Memory Care,
1%
Chartwell’s Portfolio Assisted Living,
by Level of Care (1) 5%
Independent
Supportive
Living, 73%
(1) At Chartwell‟s share of ownership interest at December 31, 2018.
making people’s lives BETTER® 11Industry Profile
Significant Future Demand in Canada
Projected Aged 75 and over Population, 2018-2036, Canada
6,000,000
5,000,000
4,000,000
3,000,000
2,000,000
1,000,000
-
2018 2021 2026 2031 2036
Source: Statistics Canada, Population Projections for Canada, Provinces, and Territories, 2009 to 2036, Catalogue no. 91-520-X
• Current supply is ~ 425,000 suites
• ~ 600,000 new suites are required by 2036
Total Supply Required Annual Supply
600,000
Long Term Care Retirement
500,000
400,000
300,000
200,000
100,000
0
2018 2021 2026 2031 2036
Retirement demand is estimated by applying the current national penetration rate of 8.98% (CMHC Seniors Housing Report
Canada) to 75+ population as reported by Statistics Canada.
LTC demand is estimated based on 97.8 beds per 1,000 people aged 75 and over. This estimate represents the LTC
Beds/Population ratios reported by Statistics Canada in their Residential Care Facilities reports.
making people’s lives BETTER® 12Industry Profile
Retirement Suites Demand in Chartwell Markets (1)
Total Suites Required to 2038 is approximately 247,000
16,000
14,000
12,000
10,000
8,000
6,000
4,000
2,000
-
2019 2020 2021 2022 2023 2024 2025 2026 2027 2028 2029 2030 2031 2032 2033 2034 2035 2036 2037 2038
(1) Ontario, Quebec, Alberta, British Columbia
making people’s lives BETTER® 13Industry Profile
Canadian Supply Concentration
Largest Retirement Operators No. of Properties No. of Suites Largest Long Term Care Operators No. of Properties No. of Suites
Operated (1) Operated (2) Operated (1) Operated (2)
1 Chartwell Retirement Residences 167 24,300 1 Extendicare Inc. 105 14,108
2 Revera Inc. 108 12,218 2 Revera Inc. 74 9,243
3 Sélection Retraite 37 9,596 3 Sienna Senior Living 48 7,613
4 Le Groupe Maurice 28 7,885 4 Chartwell Retirement Residences 28 3,692
5 Cogir 35 7,480 5 Schlegel Villages 18 2,642
6 Groupe Savoie 14 5,646 6 Park Place Seniors Living 19 2,015
7 All Seniors Care 30 4,568 7 Retirement Concepts 17 1,918
8 Sienna Senior Living 37 4,143 8 Shannex Inc. 22 1,845
9 Amica Mature Lifestyles & Baybridge 30 4,014 9 Rykka Care Centres 11 1,689
10 Verve Senior Living 27 3,737 10 Group Champlain 13 1,592
11 Atria Senior Living 29 3,376 11 Jarlette Health Care 14 1,486
12 Seasons Retirement Communities 20 2,259 12 Omni Health Care 18 1,475
13 Shannex Inc. 13 2,088 13 Caressant Care 15 1,247
14 Schlegel Villages 8 2,025 14 Good Samaritan Society 12 1,148
15 Retirement Concepts 18 1,948 15 Steeves & Rozema 7 928
15 Largest Operators’ Share of Total Suites 38% 15 Largest Operators’ Share of Total Suites 26%
(1) Excludes properties under development. Includes managed properties for third-parties and excludes U.S. (1) Excludes properties under development; Includes managed properties for third-parties and excludes U.S. holdings.
holdings. (2) Includes only LTC units within the above noted properties
(2) Includes only IL, AL and MC suites within the above-noted properties. Also includes some LTC (Western LTC
homes are reported under Retirement segment ).
Source: CBRE Limited and Company Reports, Q2 2018 Source: CBRE Limited and Company Reports, Q2 2018
making people’s lives BETTER® 14Financial Position and Credit
Metrics
December 31, 2018:
$415.5 million in Liquidity (1)
$676.9 million of Unencumbered Assets Value (2)
Interest Coverage Ratio (3) Net Debt to Adjusted EBITDA (3)
3.7
3.5
3.2
3.0 7.8
7.7
7.3 6.9
2015 2016 2017 2018 2015 2016 2017 2018
Indebtedness Percentage (4) Debt to Capitalization (5)
BBB(l) rated by DBRS
50.1 49.3 49.3
45.0 43.1%
40.3% 43.4%
35.4%
2015 2016 2017 2018 2015 2016 2017 2018
Demonstrated ability to rationalize capital structure
(1) Includes cash and available credit facilities (4) As at the end of the period, including proforma adjustments
(2) Represent value of 33 properties (5) At market value of Trust Units as of December 31, 2018
(3) Rolling 12 months, including proforma adjustments
making people’s lives BETTER® 15Financial Position and Credit
Metrics
Debt Maturities
* 10% of total principal debt = $218.7 million
Mortgage Portfolio
At December 31, 2018 At December 31, 2017
Fixed Rate Variable Rate Total Total
Principal amount ($000s) 1,805,176 31,728 1,836,904 1,629,935
Weighted average interest rate 3.80% 4.10% 3.80% 3.86%
Average term to maturity (years) 7.1 3.5 7.1 7.8
• 68% of total mortgages are CMHC insured.
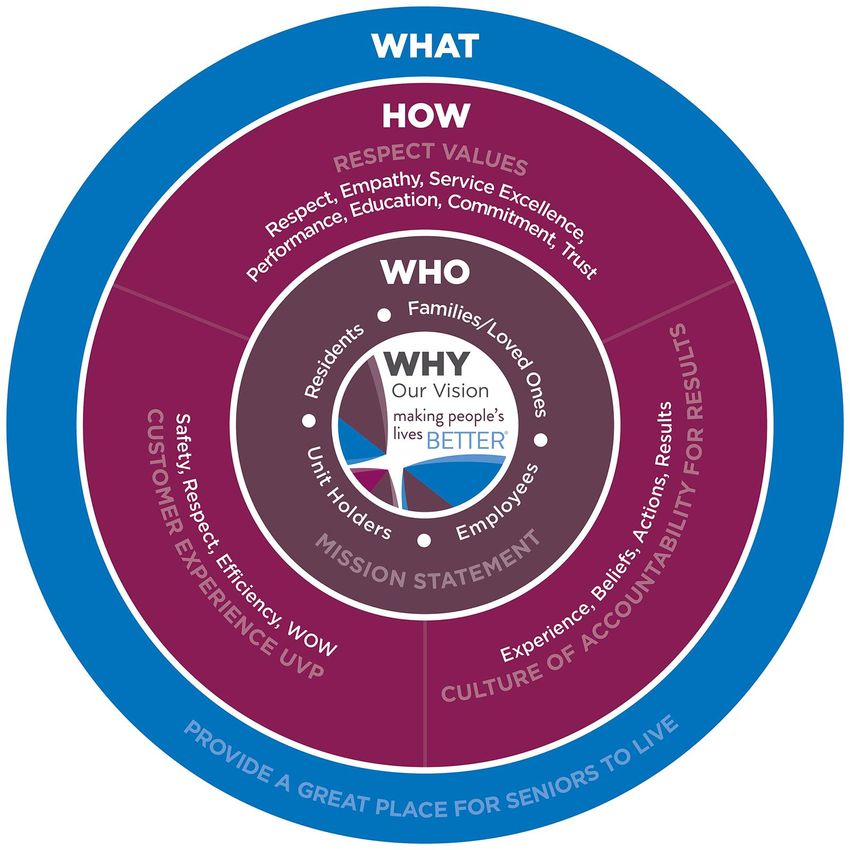
making people’s lives BETTER® 16Building Sustainable Value
Build Value of our Real Estate Portfolio
Portfolio
and Asset Development Acquisitions
Management
Market and
Risk
Industry
Management
Research
2
2018
Acquired five residences in Edmonton, Alberta for an aggregate contractual
purchase price of $317.4 million.
Forward purchase agreement for another residence in Edmonton, Alberta for
$120 million.
Sold interests in four non-core properties in Quebec for $45.5 million.
Development pipeline of 1,638 suites with six projects (871 suites) in
construction and five projects (767 suites) in pre-construction.
Options to acquire interests in development projects by Batimo are expected to
add another 2,744 suites to our portfolio over time.
making people’s lives BETTER® 17Building Sustainable Value
• Improving portfolio by selling older assets and buying/building newer,
high-quality assets.
• Since 2013, the average age of suites acquired/developed is 8.0 years.
• Since 2013, the average age of suites sold is 25.6 years.
Average Age of Assets Acquired/Developed vs. Sold
50.0
45.0
40.0
35.0
30.0
25.0
20.0
15.0
10.0
5.0
-
2013 2014 2015 2016 2017 2018
Acquisitions/Developments Dispositions
2013 2014 2015 2017 2018 2018
Suites Acquired/Developed 718 539 1,637 461 1,305 937
Suites Sold 1,381 1,957 5,537 400 250 609
making people’s lives BETTER® 18Building Sustainable Value
Highlights of Development Pipeline
Projects in Construction
(1)
incurred as at December 31, 2018
Estimated Lease-up-Losses and
Adjusted Development Costs (1)
Estimated Development Cost (1)
Adjusted Development Costs
Estimated Stabilized NOI (1)
Stabilized Occupancy Date
Stabilized Occupancy (%)
Imputed Cost of Debt (1)
Completion Date
Unlevered Yield
Reservations
($ millions)
($millions)
($millions)
($millions)
($millions)
Estimated
Expected
Expected
Expected
Expected
Suites / Suite
Project Location Beds Type
The Sumach by Q1 Q2
Chartwell (2) Toronto, ON 332 IL 45.3 3.6 48.9 39.6 2019 2021 44% 95% 3.5 7.2%
Chartwell Wescott ISL/ Q1 Q3
Retirement Residence Edmonton, AB 137 MC 42.4 5.7 48.1 36.8 2019 2021 25% 94% 3.4 7.0%
Chartwell Thunder Bay Thunder Bay, Q4 Q4
Senior Townhomes ON 9 IL 3.8 0.1 3.9 0.9 2019 2019 - 100% 0.3 7.5%
Chartwell Guildwood Scarborough, IL/ISL/ Q2 Q4
Retirement Residence (3) ON 172 MC 33.5 3.1 36.6 6.9 2020 2022 37% 92% 2.5 7.0%
Chartwell Meadowbrook Q2 Q2
Village Lively, ON 56 IL/ISL 21.5 1.6 23.1 2.3 2020 2021 - 93% 1.6 6.9%
706 146.5 14.1 160.6 86.5 11.3 7.0%
Project by Signature Retirement Living (“Signature Living”)
Kingsbridge Retirement Kingston, ISL/ Q2 Q3
Community (4) ON 165 AL 28.9 2.9 31.8 22.4 2019 2021 25% 95% 2.7 7.0%
871 175.4 17.0 192.4 108.9 14.0 7.0%
(1) Calculated at Chartwell‟s ownership interest in the project.
(2) Chartwell owns a 45% interest in this project and manages pre-opening and lease-up.
(3) Redevelopment of the 83-suite residence to a 172-suite residence. Chartwell owns a 50% interest in this project.
(4) The site includes excess land for potential development of 84 additional suites. Chartwell owns a 60% interest in this project and
Signature Living and its affiliates own the remaining 40% interest and provide development and operations management services.
Chartwell expects to acquire the remaining 40% interest upon the property achieving the expected stabilized occupancy. Signature
Living is entitled to a promote payment if the project‟s return on equity exceeds certain targets. The expected unlevered yield
calculation includes estimates of such promote payment.
making people’s lives BETTER® 19Building Sustainable Value
Highlights of Development Pipeline
Projects in Pre-Construction
Estimated Lease-up-Losses and Imputed
(1)
Construction Commencement Date
incurred as at December 31, 2018
Adjusted Development Costs (1)
Estimated Development Cost (1)
Adjusted Development Costs
Estimated Stabilized NOI (1)
Stabilized Occupancy Date
Stabilized Occupancy (%)
Completion Date
Unlevered Yield
Cost of Debt (1)(
($ millions)
($millions)
($millions)
($millions)
($millions)
Estimated
Expected
Expected
Expected
Expected
Expected
Suites / Suite
Project Location Beds Type
Chartwell Ridgepointe Kamloops, Q3 Q4 Q1
Retirement Residence BC 89 IL 23.6 1.4 25.0 1.9 2019 2020 2022 97% 1.9 7.7%
Chartwell Montgomery Orangeville, Q2 Q4 Q3
Village ON 122 IL 41.8 3.6 45.4 1.9 2019 2020 2022 93% 3.1 6.9%
Chartwell Royalcliffe Q3 Q4 Q1
Retirement Community (2) 163 IL/MC 32.5 3.2 35.7 1.3 2019 2020 2023 93% 2.4 6.8%
London, ON
Chartwell Wynfield Q3 Q3 Q4
Retirement Community Oshawa, ON 201 IL/MC 75.5 7.3 82.8 6.7 2019 2021 2023 97% 5.7 6.9%
Q4 Q4 Q4
Chartwell Ballycliffe LTC (3) Ajax, ON 192 LTC 46.7 2.3 49.0 3.0 2019 2022 2022 100% 3.5 7.1%
767 220.1 17.8 237.9 14.8 16.6 7.0%
(1) Calculated at Chartwell‟s ownership interest in the project.
(2) Chartwell owns a 50% interest in this project.
(3) We filed an application with the Ontario Ministry of Health and Long Term Care (the “MOH”) to redevelop the existing 100-bed Class
C LTC and 40-suite retirement residence into a 192-bed LTC residence. The MOH agreed to provide the additional 92 licensed LTC
beds. The retirement operations have been discontinued at this location, and demolition of this section of the building has been
completed. The existing LTC operations are expected to continue during the redevelopment. Estimated stabilized NOI for this
project includes expected capital funding subsidy receipts.
making people’s lives BETTER® 20Building Sustainable Value
Highlights of Batimo Acquisition Pipeline
Current Actual / Expected Expected
Suites / Project Completion Stabilized Occupancy
Project Location Beds Suite Type Status (1) Date Date
Chartwell L’Unique III St. Eustache, QC 163 ISL O March 2017 Q3 2019
Chartwell Le Prescott Vaudreuil, QC 324 ISL O June 2017 Q3 2020
Chartwell Le Montcalm Candiac, QC 283 ISL O September 2017 Q2 2020
Chartwell St. Gabriel St. Hubert, QC 345 ISL / AL O May 2018 Q4 2019
Chartwell Le Teasdale II Terrebonne, QC 221 ISL O October 2018 Q1 2020
Chartwell Greenfield Park Longueuil, QC 368 ISL / AL C Q2 2019 Q1 2021
Chartwell L’Envol Cap Rouge, QC 360 ISL / AL C Q3 2019 Q1 2021
Chartwell Atwater Montreal, QC 321 ISL / AL / MC P Q2 2021 Q4 2023
Charlesbourg Project Quebec City, QC 359 ISL / AL P Q4 2020 Q4 2022
2,744
(1) Current project status is defined where „O‟ means „Operating‟, „C‟ means „Construction‟ and „P‟ means „Pre-Construction.
making people’s lives BETTER® 21Financial Performance making people’s lives BETTER® 22
Historical Trends

Adjusted Resident Revenue ($ millions)                                                EBITDA ($ millions)

                                                                                                                                     280.3
                  922.7 927.8                                  939.3                                                         262.9
                                                                                         256.9 260.1                 250.7
         874.5                                        877.4                      246.4
                                              834.7
750.6                             750.1 (2)
                                                                        202.3                            206.5 (2)

2011     2012     2013     2014     2015      2016    2017     2018     2011     2012    2013     2014       2015    2016    2017    2018

  Source: Company disclosure. Includes Chartwell‟s proportionate share of equity accounted joint ventures.
(1)   CAGR – Compound Annual Growth Rate
(2)   Note: In 2015 Chartwell sold its U.S portfolio of 35 properties

                              Proven track record of profitable growth

 making people’s lives BETTER®                                                                                                          23
Historical Trends
FFO ($ millions)
193.4
182.5
172.6
143.0 146.3
133.5
124.2
96.4
2011 2012 2013 2014 2015 2016 2017 2018
Same property portfolio performance
94.0% 7.0%
NOI (YOY % Growth)
92.0% 6.0%
Occupancy %
90.0% 5.0%
88.0% 4.0%
86.0% 3.0%
84.0% 2.0%
82.0% 1.0%
80.0% 0.0%
2011 2012 2013 2014 2015 2016 2017 2018
Occupancy % 90.3% 90.3% 89.8% 90.3% 91.9% 93.6% 93.0% 91.7%
Adjusted NOI (YOY %
1.8% 3.7% 1.2% 1.8% 1.9% 6.6% 4.3% 3.3%
growth)
Same property portfolio as defined in each year
making people’s lives BETTER® 24Historical Trends
Distributions
$0.6000
$0.5880
$0.5760
$0.5618
$0.5508
$0.5400
2% 2% 2.5% 2.1% 2%
March March March March March March
2014 2015 2016 2017 2018 2019 *
* Effective for the March 31, 2019 distribution paid on April 15, 2019.
making people’s lives BETTER® 252018 Highlights
• FFO up 6.1%
• Same property adjusted NOI up 3.3%
• Distributions increase 2.0% as of March 31, 2019
Year Ended Year Ended Increase/
2018 2017 (Decrease)
Net income ($ millions) $18.5 $13.1 $5.4
FFO ($ millions) $193.6 $182.5 $11.1
FFO per unit $0.90 $0.93 ($0.03)
Average occupancy – same property 91.7% 92.5% (0.8pp)
Adjusted NOI – same property
$276.5 $267.6 $8.9
($ millions)
making people’s lives BETTER® 26Q4 2018 Highlights
• FFO up 1.0%
• Same property adjusted NOI up 2.2%
• Same property occupancy was 92.0%
Q4 Q4 Increase/
2018 2017 (Decrease)
Net income/(loss) ($ millions) ($13.1) $0.7 ($13.8)
FFO ($ millions) $48.5 $48.0 $0.5
FFO per unit $0.23 $0.24 ($0.01)
Average occupancy – same property 92.0% 92.9% (0.9pp)
Adjusted NOI – same property ($ millions) $69.7 $68.2 $1.5
making people’s lives BETTER® 27Ontario Retirement Platform
Year Ended Year Ended Increase/(Decrease)
2018 2017 $ %
Same property statistics:
Adjusted NOI ($ millions) $133.9 $129.5 $4.4 3.4%
Occupancy 87.1% 88.3% N/A (1.2pp)
Q4 2018 Q4 2017 Increase/(Decrease)
$ %
Same property statistics:
Adjusted NOI ($ millions) $34.0 $33.0 $1.0 2.9%
Occupancy 87.5% 88.8% N/A (1.3pp)
• Adjusted NOI growth driven by rental rate increases in line with
competitive market conditions and lower utilities expenses.
100%
Occupancy
95%
90% 88.9% 88.6% 88.3% 88.8% 88.2%
87.4% 87.5%
86.2% 86.5%
85%
80%
75%
70%
Q4 16 Q1 17 Q2 17 Q3 17 Q4 17 Q1 18 Q2 18 Q3 18 Q4 18
making people’s lives BETTER® 28Ontario Retirement Platform
Retirement Suites Demand in Ontario (1)
Total Suites Required to 2038 = 66,891
4,000
3,500
3,000
2,500
2,000
1,500
1,000
500
-
2019 2020 2021 2022 2023 2024 2025 2026 2027 2028 2029 2030 2031 2032 2033 2034 2035 2036 2037 2038
(1) Calculated applying current penetration rate of 5.5% to total population of people aged 75 and older
making people’s lives BETTER® 29Western Canada Platform
Year Ended Year Ended Increase/(Decrease)
2018 2017 $ %
Same property statistics:
Adjusted NOI ($ millions) $52.6 $50.0 $2.6 5.2%
Occupancy 96.2% 96.6% N/A (0.4pp)
Q4 2018 Q4 2017 Increase/(Decrease)
$ %
Same property statistics:
Adjusted NOI ($ millions) $13.1 $12.7 $0.4 3.5%
Occupancy 96.3% 97.1% N/A (0.8pp)
• Strong adjusted NOI growth driven by rental rate increases in line with
competitive market conditions.
Occupancy
100%
96.9% 96.3% 96.3% 96.9% 97.1% 96.3% 96.3%
95.9% 96.2%
95%
90%
85%
80%
75%
70%
Q4 16 Q1 17 Q2 17 Q3 17 Q4 17 Q1 18 Q2 18 Q3 18 Q4 18
making people’s lives BETTER® 30Western Canada Platform
Retirement Suites Demand in Alberta (1)
Total Suites Required to 2038 = 23,216
2,000
1,750
1,500
1,250
1,000
750
500
250
-
2019 2020 2021 2022 2023 2024 2025 2026 2027 2028 2029 2030 2031 2032 2033 2034 2035 2036 2037 2038
(1) Calculated applying current penetration rate of 5.7% to total population of people aged 75 and older
making people’s lives BETTER® 31Western Canada Platform
Retirement Suites Demand in British Columbia (1)
Total Suites Required to 2038 = 34,769
2,000
1,750
1,500
1,250
1,000
750
500
250
-
2019 2020 2021 2022 2023 2024 2025 2026 2027 2028 2029 2030 2031 2032 2033 2034 2035 2036 2037 2038
(1) Calculated applying current penetration rate of 8.3% to total population of people aged 75 and older
making people’s lives BETTER® 32Quebec Platform
Year Ended Year Ended Increase/(Decrease)
2018 2017 $ %
Same property statistics:
Adjusted NOI ($ millions) $59.6 $60.1 ($0.5) (0.8%)
Occupancy 92.3% 93.1% N/A (0.8pp)
Q4 2018 Q4 2017 Increase/(Decrease)
$ %
Same property statistics:
Adjusted NOI ($ millions) $14.5 $15.1 ($0.6) (4.0%)
Occupancy 92.4% 93.2% N/A (0.8pp)
• Adjusted NOI decreased due primarily to higher staffing costs and
competitive pressures in certain markets from new construction which
have impacted occupancy.
100% Occupancy
94.7%
95% 93.5% 92.7% 92.9% 93.2%
92.3% 92.0% 92.4% 92.4%
90%
85%
80%
75%
70%
Q4 16 Q1 17 Q2 17 Q3 17 Q4 17 Q1 18 Q2 18 Q3 18 Q4 18
making people’s lives BETTER® 33Quebec Platform
Retirement Suites Demand in Quebec (1)
Total Suites Required to 2038 = 121,810
8,000
7,000
6,000
5,000
4,000
3,000
2,000
1,000
-
2019 2020 2021 2022 2023 2024 2025 2026 2027 2028 2029 2030 2031 2032 2033 2034 2035 2036 2037 2038
(1) Calculated applying current penetration rate of 17.9% to total population of people aged 75 and older
making people’s lives BETTER® 34Ontario LTC Platform
Year Ended Year Ended Increase/(Decrease)
2018 2017 $ %
Same property statistics:
Adjusted NOI ($ millions) $30.4 $28.0 $2.4 8.5%
Occupancy 98.2% 98.5% N/A (0.3pp)
Q4 2018 Q4 2017 Increase/(Decrease)
$ %
Same property statistics:
Adjusted NOI ($ millions) $8.0 $7.4 $0.6 8.9%
Occupancy 98.5% 98.7% N/A (0.2pp)
• Adjusted NOI growth is primarily due to higher preferred accommodation,
ancillary revenues and a positive adjustment to certain reserves.
• Approximately 35,000 people on the waiting list for LTC accommodation in
Ontario.
Occupancy
100% 98.6% 98.0% 98.5% 98.7% 98.7% 98.3% 98.3% 98.5%
97.7%
95%
90%
85%
80%
75%
70%
Q4 16 Q1 17 Q2 17 Q3 17 Q4 17 Q1 18 Q2 18 Q3 18 Q4 18
making people’s lives BETTER® 35You can also read