Q4 2019 Investor Presentation - February 2020 - EVERYTHING YOU NEED - CoreSite
←
→
Page content transcription
If your browser does not render page correctly, please read the page content below

ONE DATA CENTER PROVIDER.
                                  EVERYTHING YOU NEED.

Q4 2019 Investor Presentation

February 2020

                                                            1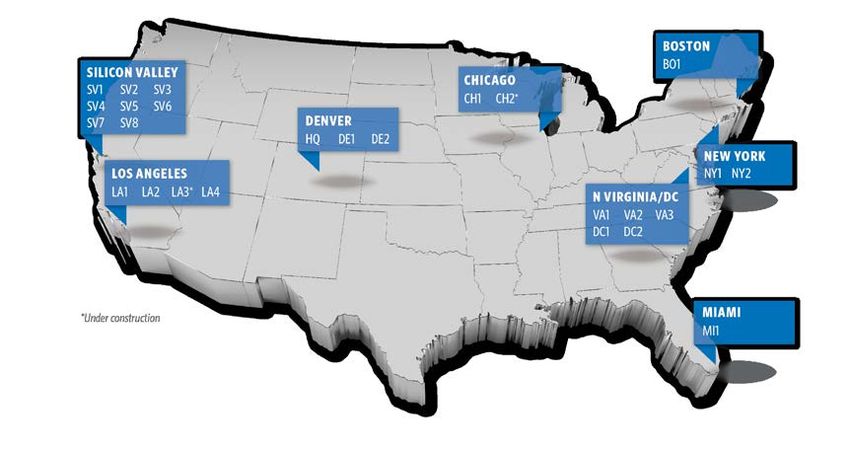
Forward Looking Statements

This investor presentation may contain forward-looking statements within the meaning of the federal securities laws.
Forward-looking statements relate to expectations, beliefs, projections, future plans and strategies, anticipated events
or trends and similar expressions concerning matters that are not historical facts. In some cases, you can identify
forward-looking statements by the use of forward-looking terminology such as “believes,” “expects,” “may,” “will,”
“should,” “seeks,” “approximately,” “intends,” “plans,” “pro forma,” “estimates” or “anticipates” or the negative of these
words and phrases or similar words or phrases that are predictions of or indicate future events or trends and that do not
relate solely to historical matters. Forward-looking statements involve known and unknown risks, uncertainties,
assumptions and contingencies, many of which are beyond CoreSite’s control, that may cause actual results to differ
significantly from those expressed in any forward-looking statement. These risks include, without limitation: the
geographic concentration of the CoreSite’s data centers in certain markets and any adverse developments in local
economic conditions or the level of supply of or demand for data center space in these markets; fluctuations in interest
rates and increased operating costs; difficulties in identifying properties to acquire and completing acquisitions;
significant industry competition, including indirect competition from cloud service providers; failure to obtain necessary
outside financing; the ability to service existing debt; the failure to qualify or maintain its status as a real estate
investment trust (“REIT”); financial market fluctuations; changes in real estate and zoning laws and increases in real
property tax rates; and other factors affecting the real estate industry generally. All forward-looking statements reflect
CoreSite’s good faith beliefs, assumptions and expectations, but they are not guarantees of future performance.
Furthermore, CoreSite disclaims any obligation to publicly update or revise any forward-looking statement to reflect
changes in underlying assumptions or factors, of new information, data or methods, future events or other changes. For
a further discussion of these and other factors that could cause the CoreSite’s future results to differ materially from any
forward-looking statements, see the section entitled “Risk Factors” in its most recent annual report on Form 10-K, and
other risks described in documents subsequently filed by CoreSite from time to time with the Securities and Exchange
Commission.

                                             ONE DATA CENTER PROVIDER. EVERYTHING YOU NEED.          © 2020, CoreSite, L.L.C. All Rights Reserved.   2
                                                                                                                                                     2
2019 Highlights & 2020 Guidance
See the Company’s Q4 Earnings Information & Form 10-K for a complete summary of 2019 Results & 2020 Guidance.
Sales, Pricing, Backlog Revenue Property Development
New & Expansion Leasing Revenue 2019 and 2020 Development
• 2019 – $55.0M • 2019 – Grew revenues 5.2% YoY • Placed into service:
• Retail – $23.2M • Q4 – Grew revenues 5.0% YoY, • Q4 – 74,000 NRSF*
• Scale – $31.8M 0.8% sequentially • 2019 – 224,000 NRSF
• Q4 – $6.6M • Q4 – SV8 Phase II, placed in • Expected completions:
• Retail – $6.6M service at 100% occupancy • 2020 – 196,000 NRSF
Estimated for Year
• Record Sales in 2019
• Nearly double 2018 sales Balance Sheet
• Strong 2019 New Logo Additions Leverage Guidance & Outlook
• Increased 50% over 2018 • 4.7x Net Principal Debt / 2020 Guidance
Annualized Adjusted EBITDA
Q4 Data Center Sales Backlog • Net income per diluted share –
• 4.5x including GAAP
(signed, not yet commenced) $1.74 to $1.84
backlog
• GAAP Basis – $15.6M • FFO per share & unit diluted –
Amended Credit Agreement in
• Cash Basis – $19.8M $5.10 to $5.20
November 2019
Cash Renewal Growth • Extended maturity on revolving • Cash Rent Churn – 9% to 11%
• 2019 – 0.4% credit facility and combined and • Cash Rent Growth – 0% to 2%
• Q4 – (0.8%) extended the 2020 & 2021 debt • Total CapEx – $225M to $275M
maturities
• Added $100 million of liquidity
* NRSF – Net Rentable Square Feet
ONE DATA CENTER PROVIDER. EVERYTHING YOU NEED. © 2020, CoreSite, L.L.C. All Rights Reserved. 3
32019: A Technology Transition – Record Sales / Record Churn
Strong New Business Models Emerging
– 2019 Record Sales Driven By –
• More Data Center Capacity – Allowing us to compete for a broader range of deployment sizes
• Strategic Scale Sales – Pre-leased 100% of two Phases of SV8, and 74% of Phase 1 of LA3
• Winning Edge, Hybrid-Cloud, and High Performance Cases – We believe is a longer term trend
strengthened by our ecosystems
• New Logo Wins –
• Highest # of logos in 3 years and new logo revenues grew 50% over 2018; valuable strategic accounts
• Agile Changes in Product Offerings Enabling Customers to –
• Easily provision services with redundancy for resiliency & cloud SLAs
• Flatten their WAN networks for significant cost savings
• Optimize flexibility and responsiveness of hybrid-cloud architectures
• Operational Excellence –
• “Eight 9s” Power & Cooling Uptime, 4.8% improvement in Power Utilization Effectiveness
• Expanded Cloud Provider Relationships – More edge cloud products & availability zones
• Continued Strong Secular Tailwinds – For hybrid and multi-cloud needs (AI, IoT, Analytics, 5G)
Older Business Models Waning
– 2019 Record Churn Driven By –
• Two Key Drivers –
• Pre-Cloud Business Models Waning – Generic Resellers, Hosting, Storage, DR & Managed Services
• Movement to the Cloud – For Burst Capacity and Other Business Use cases
• Low Remaining Exposure – An estimated 4-6% of Embedded Annualized Cash Rent Base
ONE DATA CENTER PROVIDER. EVERYTHING YOU NEED. © 2019, CoreSite, L.L.C. All Rights Reserved. 4
4CoreSite at a Glance
Delivering network dense, edge-market data centers, with rich ecosystems
As of 12/31/2019
2001 450+ 4.6+ Million
Year Founded Professionals Gross Square Feet
1,350+ 550+ 450+ 325+
Customers Enterprise and Network Service Cloud and IT
Digital Content Providers Service Providers
100% 23 8 28,000+
SLA Operational Markets Customer
Data Centers Interconnections
ONE DATA CENTER PROVIDER. EVERYTHING YOU NEED. © 2020, CoreSite, L.L.C. All Rights Reserved. 5
5Our Focus and Strategy
Bringing together a strong network and cloud community
to support the needs of the enterprise
High-Performance Data Center Solutions
• Network-dense locations in top U.S. markets;
interconnected campuses suitable for hybrid-
cloud / multi-cloud technology architectures
• On-premises access to top public cloud
providers – reduces network cost and
complexity, optimizes cloud performance and
resiliency, enhances scalability of enterprise
requirements
• Operational and service excellence
– A cultural mindset of continuous improvement
– Meeting and exceeding customer expectations
– Dedicated in-house 24/7 data center operations
personnel
• Centralized utilities to support rapid and
efficient access to public clouds and
technology-solutions partners
– Private IP on-ramps
– Ethernet fabric
– APIs supporting leading global cloud providers
and networks
Delivering a Strong Ecosystem
ONE DATA CENTER PROVIDER. EVERYTHING YOU NEED. © 2020, CoreSite, L.L.C. All Rights Reserved. 6
6Performance Sensitive Data Center Drivers
Internet Traffic Growth Cloud Computing
• A major driver of data center growth
• Growth in internet usage has increased IT requirements
– Shared infrastructure provides flexibility and cost efficiency
– Traffic drivers: big data analytics, Internet of Things (IoT), 5G,
Internet TV, smart phone adoption, media content, and social – Proximity to enterprises and multiple networks needed for the
media cloud
– Fast, flexible, reliable data centers are critical – Enterprises are trending toward high performance hybrid
cloud architecture
Increased IT Spending and DC Outsourcing Customer Specifications
• Companies gain efficiencies of scale, better security, greater • Performance-sensitive applications require a data center to be in
reliability, and the ability to scale quickly close proximity to end-users
• Globalization is causing companies to consider outsourcing in • Enterprises benefit from data centers in multiple geographies with
order to connect with their clients’ IT infrastructure flexible power configurations, interconnection options and the
• CoreSite expects third party data center spend to continue to ability to scale
increase • Heightened regulatory and cybersecurity compliance
High Barriers to Entry
• Most existing points of dense interconnection are already owned by data center providers
• Building dense network and cloud ecosystems generally takes 10+ years
• Scale, purchasing power and expertise reduce costs
• National platform and existing customer base are important to enterprises that desire national MSAs
and network / cloud companies that want an ecosystem of companies to sell their services
ONE DATA CENTER PROVIDER. EVERYTHING YOU NEED. © 2020, CoreSite, L.L.C. All Rights Reserved. 7
7Data Center Business: Core Retail vs. Hyperscale
Third-party data centers are often classified by the size and level of customization of the customer
space, in addition to the products and/or services they provide
Core Retail Scale Hyperscale
• Smaller spaces; secured cabinets / cages in • Defined by large blocks of space (5,000 – • Defined by large blocks of space (>50,000
larger suites 50,000 NRSF) and power capacity NRSF) and power capacity
• Smaller power capacity requirements • Greater power needs • Customers tend to pay lower rents as they
typically lease entire rooms and keep their
• 3 – 4 year initial lease terms with auto- • 5 – 10 year lease terms own staff on site to maintain IT deployments
renewal provisions
• Customer base of large commercial • Some hyperscale customers lease “shell”
• Small business to Global 1000 customers enterprises, cloud providers, and government space at warehouse-level rents and will build
• Application needs can range from requiring agencies out all of the mechanical improvements to the
limited connectivity to requiring access to • Scale deployments are typically performance- building to turn it into a full data center
multiple network / cloud ecosystems sensitive applications that require being in • 10+ year lease terms with multiple renewal
• “Performance-sensitive” customers need edge markets options
strong networks / connections, technical • Customers charged for rent, power and • Most hyperscale applications do not require
personnel, location and security cooling costs; they are generally responsible high levels of interconnection services and
for everything inside their space select providers based on cost
• Those customers with “undifferentiated”
applications choose providers based on
reliability and price
• Customers typically pay rent for the space,
power, installation fees and cross-connects
CoreSite targets retail customers with performance-sensitive applications and
opportunistically focuses on scale and hyperscale leasing
ONE DATA CENTER PROVIDER. EVERYTHING YOU NEED. © 2020, CoreSite, L.L.C. All Rights Reserved. 8
8High Quality, Strategically Located, Network-Dense Portfolio
Our customers can reach 22% of the U.S. population representing 31% of U.S. GDP and
have the ability to cover more than 75% of U.S. businesses within 5 milliseconds
with performance-sensitive applications and products across our 8 markets.
As of 12/31/19
Market # of Networks
Los Angeles 330+
Denver 85+
Northern Virginia / D.C. 70+
San Francisco Bay 65+
New York / New Jersey 60+
Boston 35+
Chicago 40+
Miami 20+
CLOUD SERVICES
CLOUD ON-RAMP AVAILABILITY
AWS Direct Connect: All Eight Markets
Microsoft Azure ExpressRoute: LA, SV, CH, NY, BO, DE, VA
Google Cloud Interconnect: LA, DE, CH
IBM Cloud Direct Link: LA, DE, VA
In addition to direct connect markets listed, Amazon, Microsoft,
Google, Alibaba Cloud, IBM Cloud and Oracle FastConnect can all be Alibaba Cloud: VA, SV
accessed through inter-site connectivity or service providers in all
eight of our markets Oracle FastConnect: VA
CoreSite owns approximately 92% of the NRSF underlying its data centers
ONE DATA CENTER PROVIDER. EVERYTHING YOU NEED. © 2020, CoreSite, L.L.C. All Rights Reserved. 9
9Available and Developable Capacity NRSF
By Top 5 Markets
San Francisco Bay, Los Angeles, Northern Virginia, New York and Chicago
Available Capacity (NRSF)(1) vs Developable NRSF (2)(3)
(1) Our available capacity represents unoccupied operating data center NRSF, including stabilized and pre-stabilized assets and the calculation assumes max occupancy of 95%.
(2) Developable NRSF represents all NRSF under construction at year-end and NRSF held for development that has the ability be developed within two quarters.
(3) Dependent on development / construction timing and market absorption.
ONE DATA CENTER PROVIDER. EVERYTHING YOU NEED. © 2002, CoreSite, L.L.C. All Rights Reserved. 10
10Delivery of New Capacity to Support Continued Growth
2020 - Expect to Deliver 196,000 NRSF of capacity
Ground-Up Development Data Center Expansions
Under Construction as of 12/31/19
Chicago New York
• CH2 Phase 1: 56,000 NRSF • NY2 Phase 3: 35,000 NRSF
− Expected completion Q2 2020 − Expected completion Q1 / Q2 2020
Los Angeles Santa Clara
• LA3 Phase 1: 51,000 NRSF
• SV8 Phase 3: 54,000 NRSF
‒ Expected completion Q3 / Q4 2020
− Expected completion Q2 2020
‒ 74% pre-leased
2019 - Delivered 224,000 NRSF of capacity
Providing More Contiguous Space to Compete for New Leasing
ONE DATA CENTER PROVIDER. EVERYTHING YOU NEED. © 2020, CoreSite, L.L.C. All Rights Reserved. 11
11Current Development Pipeline
As of 12/31/19
Data center expansion
New development
Total development(2)(3)
For all footnotes, see page 19 of our 12/31/19 earnings supplemental information.
ONE DATA CENTER PROVIDER. EVERYTHING YOU NEED. © 2020, CoreSite, L.L.C. All Rights Reserved. 12
12Target Development Yield
The following graph illustrates an example of CoreSite’s target development yield for ground-up, purpose-built data center projects:
Phase 1 Phase 2 Phase 3
Incremental Yield 4-6% 15-25% 15-25%
Cumulative Yield 4-6% 8-12% 12-16%
*Note that actual results may differ from the example illustrated below. This example does not factor in the estimated time frame to achieve the results.
3
1 Initial investment yields expected to be lower than stabilized yields due to Phase 1 investment (50% of the total), including land acquisition, shell build-out, supporting infrastructure, & other.
2
2 Throughout the 24-month stabilization period we expect investment returns to begin to increase as operating expenses become more dependent on occupancy levels.
3 Upon project completion, and as each project reaches stabilized occupancy levels, our underwriting goal is to achieve stabilized yields of 12-16%.
ONE DATA CENTER PROVIDER. EVERYTHING YOU NEED. © 2020, CoreSite, L.L.C. All Rights Reserved. 13
13Financial Strength – a Competitive Advantage
Debt commitments of approximately $1.9 billion as of December 31, 2019 to support growth
(including undrawn revolver capacity)
Variable - 29%
Fixed - 71%
ONE DATA CENTER PROVIDER. EVERYTHING YOU NEED. © 2020, CoreSite, L.L.C. All Rights Reserved. 14
142019 and 2020 Churn
2019 Churn & Impacts 2020 Churn Guidance
2019 Cash Rental Churn 2020 Cash Rental Churn Guidance –
• Q1 - 2.7% Elevated by Two Customer Relocations
• Q2 - 2.4% • Q1 – Expect 3.25 – 3.75% of churn
• Q3 - 3.1% ─ Includes SV2 customer relocation
• Q4 - 2.9%
Total 11.1% • Q4 – Expect 3.0 to 3.5% of churn
─ Includes SV7 customer relocation
Historical Churn Rate ─ 5 MW in October 2020 (~250 bps)
• 7.5% to 8.0% ─ Remaining 4 MW churn in October 2021
Illustrative Impact of Elevated Churn • Total 2020 Expected Churn - 9.0%-11.0%
• Annualized Data Center Cash Base Rent
At 12/31/19 ~$308 Million 2020 Two Customer Relocations
• Moved out of market – no longer require
• Elevated churn above Historic Churn
latency sensitive location
11.1% vs. 7.5% ~360 basis points
• Silicon Valley Location – continues to be a
• Implied Lost Revenue from Elevated Churn strong market for demand & pricing
Rental Revenue Lost ~$11 Million
(Before Power/Interconnection)
CoreSite Remains Focused On Strong Sales Execution
And Returning to More Historical Churn Rates
ONE DATA CENTER PROVIDER. EVERYTHING YOU NEED. © 2019, CoreSite, L.L.C. All Rights Reserved. 15
15Other Financial Information
ONE DATA CENTER PROVIDER. EVERYTHING YOU NEED. 16
16Summary of Financial Data
For the period of Growth % Growth %
Summary of Results Q4 2018 Q3 2019 Q4 2019 Q/Q Y/Y FY 2018 FY 2019 Y/Y
GAAP Financial Measures
Operating revenues $139,146 $144,891 $146,035 0.8% 5.0% $544,392 $572,727 5.2%
Net income 25,898 22,644 24,745 9.3 (4.5) 106,763 99,037 (7.2)
Net income attributable to common shares 19,631 17,450 19,194 10.0 (2.2) 77,922 75,840 (2.7)
Net income attributable to common shares per share - diluted $0.54 $0.47 $0.51 8.5 (5.6) $2.22 $2.05 (7.7)
REIT Financial Measures
Funds from operations (FFO) to shares and units $60,751 $61,736 $62,935 1.9% 3.6% $243,221 $246,079 1.2%
Adjusted funds from operations (AFFO) 61,169 61,171 62,193 1.7 1.7 232,691 247,318 6.3
EBITDAre 71,401 74,189 75,421 1.7 5.6 283,912 293,741 3.5
Adjusted EBITDA 74,575 77,928 79,024 1.4 6.0 296,118 308,132 4.1
Adjusted EBITDA margin 53.6% 53.8% 54.1% 30 bps 50 bps 54.4% 53.8% (60 bps)
Cash flow distributable to common equity(1) $60,307 $59,470 $60,087 1.0% (0.4)% $226,805 $240,889 6.2%
FFO per common share and OP unit - diluted $1.26 $1.28 $1.30 1.6% 3.2% $5.06 $5.10 0.8%
(1) Cash flow distributable to common equity defined as AFFO less non-recurring capital.
ONE DATA CENTER PROVIDER. EVERYTHING YOU NEED. © 2020, CoreSite, L.L.C. All Rights Reserved. 17
17Summary of Financial and Operational Data
As of
Q4 2018 Q1 2019 Q2 2019 Q3 2019 Q4 2019
Dividend Activity
Dividends declared per share and OP unit $1.10 $1.10 $1.22 $1.22 $1.22
TTM FFO payout ratio 82.1% 84.9% 88.8% 92.1% 93.7%
TTM AFFO payout ratio 85.8% 87.1% 88.6% 91.2% 93.2%
Market Capitalization & Principal Debt
Total enterprise value $5,345,711 $6,401,725 $6,895,883 $7,287,403 $6,919,211
Total principal debt outstanding $1,133,901 $1,213,706 $1,314,414 $1,382,547 $1,484,452
Net Principal Debt to:
Annualized adjusted EBITDA 3.8x 4.1x 4.3x 4.4x 4.7x
Enterprise value 21.2% 19.0% 19.1% 19.0% 21.5%
As of
Q4 2018 Q1 2019 Q2 2019 Q3 2019 Q4 2019
Operating Portfolio Statistics
Operating data center properties 22 22 22 23 23
Stabilized data center NRSF 2,318,220 2,320,538 2,277,668 2,335,962 2,406,512
Stabilized data center NRSF occupied 2,151,747 2,128,820 2,078,752 2,110,574 2,179,854
Stabilized data center % occupied 92.8% 91.7% 91.3% 90.4% 90.6%
Turn-Key Data Center ("TKD") Same-Store Statistics
MRR per Cabinet Equivalent $1,547 $1,556 $1,575 $1,590 $1,611
TKD NRSF % occupied 90.3% 89.2% 88.9% 87.5% 87.2%
ONE DATA CENTER PROVIDER. EVERYTHING YOU NEED. © 2020, CoreSite, L.L.C. All Rights Reserved. 1818Key Portfolio Statistics
12 Months Ended
YTD 2015 YTD 2016 YTD 2017 YTD 2018 YTD 2019
New / Expansion Leases Signed
Number of Leases(1) 526 579 478 514 507
Annualized Rents (000s)(2) $46,211 $48,760 $38,937 $27,653 $54,979
Total Leased NRSF 404,038 245,853 180,415 142,116 278,713
Annualized Rent per Leased NRSF $114 $198 $209 $203 $197
Renewal Leases Signed
Rental Churn Rate 7.5% 7.8% 5.5% 7.7% 11.1%
Cash Rent Growth 4.6% 3.9% 3.4% 3.6% 0.4%
GAAP Rent Growth 9.1% 7.6% 7.3% 7.5% 4.2%
Commenced Leases
Number of Leases(1) 509 616 495 517 519
Annualized Rents (000s)(2) $42,926 $58,632 $32,775 $32,940 $48,347
Total Leased NRSF 304,328 443,112 136,902 174,834 253,664
Annualized Rent per Leased NRSF $141 $132 $239 $182 $195
(1) Number of leases represents each agreement with a customer; a lease agreement could include multiple spaces and a customer could have multiple leases.
(2) During Q2 2019, a customer’s lease for reserved expansion space commenced. The contractual reservation payment was included in a prior quarter’s GAAP annualized rent. As such, it
is excluded from the Q2 GAAP annualized rent; however, the rent per leased NRSF includes the reservation payment.
ONE DATA CENTER PROVIDER. EVERYTHING YOU NEED. © 2020, CoreSite, L.L.C. All Rights Reserved. 19
192020 Guidance
(1) Implied growth is based on the midpoint of 2020 guidance.
(2) Refer to slide 21 for the adjustments made to net income to calculate adjusted EBITDA.
ONE DATA CENTER PROVIDER. EVERYTHING YOU NEED. © 2020, CoreSite, L.L.C. All Rights Reserved. 20
20Definition of Non-GAAP Financial Measures
This document includes certain non-GAAP financial measures that management believes are helpful in understanding our
business, as further described below. Our definition and calculation of non-GAAP financial measures may differ from those of
other REITs, and therefore, may not be comparable. The non-GAAP measures should not be considered an alternative to net
income as an indicator of our performance and should be considered only a supplement to net income, cash flows from operating,
investing or financing activities as a measure of profitability and/or liquidity, computed in accordance with GAAP.
Definitions
Earnings before Interest, Taxes, Depreciation and Amortization for Real Estate (EBITDAre) and Adjusted EBITDA
EBITDAre is calculated in accordance with the standards established by the National Association of Real Estate Investment Trusts
(“Nareit”). EBITDAre is defined as earnings before interest, taxes, depreciation and amortization, gains or losses from the sale of
depreciated property, and impairment of depreciated property. We calculate adjusted EBITDA by adding our non-cash
compensation expense, transaction costs from unsuccessful deals and business combinations and litigation expense to EBITDAre
as well as adjusting for the impact of other impairment charges, gains or losses from sales of undepreciated land and gains or
losses on early extinguishment of debt. Management uses EBITDAre and adjusted EBITDA as indicators of our ability to incur and
service debt. In addition, we consider EBITDAre and adjusted EBITDA to be appropriate supplemental measures of our
performance because they eliminate depreciation and interest, which permits investors to view income from operations without the
impact of non-cash depreciation or the cost of debt. However, because EBITDAre and adjusted EBITDA are calculated before
recurring cash charges including interest expense and taxes, and are not adjusted for capital expenditures or other recurring cash
requirements of our business, their utilization as a cash flow measurement is limited.
Funds from Operations “FFO”
FFO is a supplemental measure of our performance which should be considered along with, but not as an alternative to, net
income and cash provided by operating activities as a measure of operating performance. We calculate FFO in accordance with
the standards established by Nareit. FFO represents net income (loss) (computed in accordance with GAAP), excluding gains (or
losses) from sales of property and undepreciated land and impairment write-downs of depreciable real estate, plus real estate
related depreciation and amortization (excluding amortization of deferred financing costs) and after adjustments for
unconsolidated partnerships and joint ventures.
Our management uses FFO as a supplemental performance measure because, by excluding real estate related depreciation and
amortization and gains and losses from property dispositions, it provides a performance measure that, when compared year over
year, captures trends in occupancy rates, rental rates and operating costs.
Additional definitions can be found in our earnings supplemental for the quarter ended December 31, 2019.
ONE DATA CENTER PROVIDER. EVERYTHING YOU NEED. © 2020, CoreSite, L.L.C. All Rights Reserved. 21
21Definition of Non-GAAP Financial Measures
Adjusted Funds from Operations “AFFO”
AFFO is a non-GAAP measure that is used as a supplemental operating measure specifically for comparing year over year ability
to fund dividend distribution from operating activities. We use AFFO as a basis to address our ability to fund our dividend
payments. AFFO is calculated by adding to or subtracting from FFO:
1. Plus: Amortization of deferred financing costs and hedge amortization
2. Plus: Non-cash compensation
3. Plus: Non-real estate depreciation
4. Plus: Impairment charges
5. Plus: Below market debt amortization
6. Plus: Original issuance costs associated with redeemed preferred stock
7. Plus/Less: Net straight line rent adjustments (lessor revenue and lessee expense)
8. Plus/Less: Net amortization of above and below market leases
9. Less: Recurring capital expenditures
10. Less: Tenant improvements
11. Less: Capitalized leasing costs
Capitalized leasing costs consist of commissions payable to third parties, including brokers, leasing agents, referral agents, and
internal sales commissions payable to employees. Capitalized leasing costs are accrued and deducted from AFFO generally in
the period the lease is executed. Leasing costs are generally paid a) to third party brokers and internal sales employees 50% at
customer lease signing and 50% at lease commencement and b) to referral and leasing agents monthly over the lease term as
and to the extent we receive payment from the end customer.
AFFO is not intended to represent cash flow from operations for the period, and is only intended to provide an additional measure
of performance by adjusting for the effect of certain items noted above included in FFO. Other REITs widely report AFFO,
however, other REITs may use different methodologies for calculating AFFO and, accordingly, our AFFO may not be comparable
to other REITs.
Additional definitions can be found in our earnings supplemental for the quarter ended December 31, 2019.
ONE DATA CENTER PROVIDER. EVERYTHING YOU NEED. © 2020, CoreSite, L.L.C. All Rights Reserved. 22
22Thank you
CoreSite Investor Relations
1001 17th Street, Suite 500
Denver, CO 80202 USA
+1 866.777.CORE
+1 303.405.1000
CoreSite.com
InvestorRelations@CoreSite.com
ONE DATA CENTER PROVIDER. EVERYTHING YOU NEED. 23You can also read


