Australian Housing Outlook 2019-2022 - The QBE Australian Housing Outlook
←
→
Page content transcription
If your browser does not render page correctly, please read the page content below
The
 QBE Australian
Housing Outlook
            2018–2021

            The QBE
Australian
Housing Outlook
2019–2022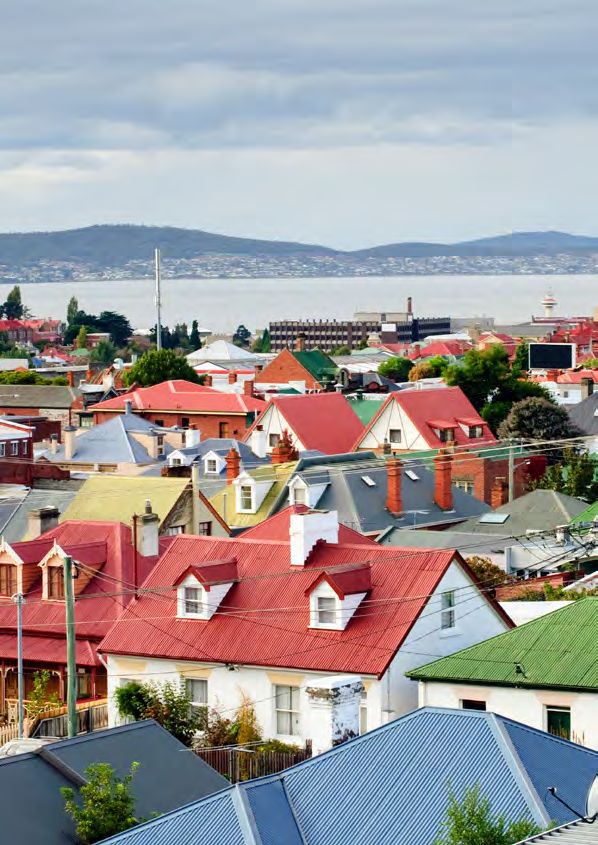
Premiums4Good™

                            Together
                                   we’re
                                                     making a
                             difference

QBE is using insurance premiums to help make
a real, sustainable difference to our communities.
Premiums4Good is a smart global initiative from QBE. We direct a
portion of everyday insurance spending to areas that create positive
environmental or social change. It’s a simple way to benefit those
who need it most, at no additional cost or risk to our customers.
To find out more, speak with your QBE representative or visit
qbe.com/lmi/premiums4good
Welcome to           First home buyers, accounting for almost
                     20% of mortgage lending, are continuing to
                     lead the charge to buy residential property
                     as more onerous lending conditions forced
The QBE Australian   many potential investors out.

                     More than 110,000 first-time home buyers
 Housing Outlook     entered the market last year. Although tighter
                     lending standards, declining property prices

    2019–2022        and uncertainty related to the economy
                     have deterred some, we still expect a similar
                     number of first home buyers to be getting
                     the keys to their very own property this year.

                     I’m pleased to welcome you to the 18th edition
                     of the QBE Australian Housing Outlook,
                     authored by our partners at BIS Oxford
                     Economics. You’ll find the latest property
                     market forecasts and analysis, which we hope
                     will give you some fresh perspectives as the
                     market continues to evolve.

                     It’s certainly been an interesting year for
                     Australian property.

                     Regulatory intervention in financial markets
                     has had a profound impact on the residential
                     property market. While record low interest
                     rates and low unemployment would
                     typically have continued to fuel property
                     prices, the limited availability of credit has
                     more than offset demand resulting in
                     significant property price declines across
                     many of our capital cities.

                     The future looks a lot brighter for our capital
                     cities. In our largest markets of Sydney and
                     Melbourne we expect property prices to
                     stabilise as owner occupiers are enticed back.

                     Strong population growth continues to
                     underpin demand and the residential
                     property market endures as one of the core
                     contributors to our domestic economy.

                     I’m particularly pleased that this year’s report
                     shines a spotlight on the current composition
                     of residential property construction in the
                     Australian market. In our feature “High-
                     density missing the mark?” we dissect a
                     vital residential property challenge currently
                     facing many of our capital cities.

                     With the Australian dream of home ownership
                     as strong as it has ever been, the residential
                     property market must continue to evolve.

                     I hope you enjoy this year’s QBE Australian
                     Housing Outlook.

                     Phil White
                     CEO, QBE LENDERS’ MORTGAGE INSURANCE

                       The QBE Australian Housing Outlook 2019–2022     1
Table of New South Wales
A positive
contents prospect
Recovery underway as new
serviceability threshold
encourages owner occupiers
back into the market
12
SECTION PAGE
01. Introduction 1
02. Australian housing snapshot 4
03. Spotlight: High-density missing the mark? 6
04. State and Territory overview 8 Victoria
State and Territory outlook 10
New heights
New South Wales 12
Victoria 16 Migration set to benefit economy,
but a surge in unit supply may
Queensland 20 dampen price growth
Western Australia 26
16
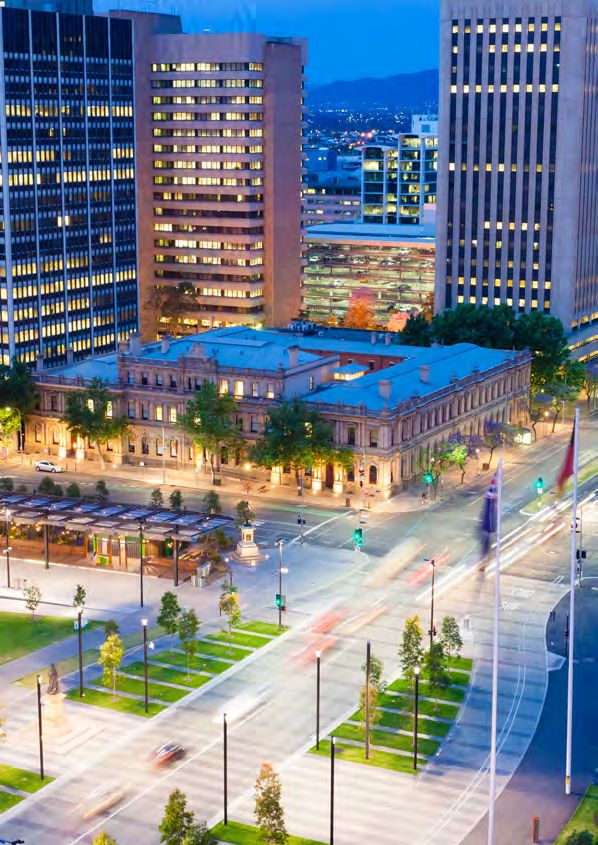
South Australia 30
Tasmania 33
Australian Capital Territory 36
Northern Territory 38
05. Glossary of terms 40
2
Spotlight

  6                                                                              High-density
                                                                                 missing the
                                                                                 mark?
                                                                                 The share of new medium and
                                                                                 high-density dwellings (units)
                                                                                 has increased across Australia’s
                                                                                 capital cities to meet the demand
                                                                                 for affordable homes. But is
                                                                                 this a positive outcome for the
                                                                                 residential property market and
                                                                                 housing affordability?

                                                                                 Queensland

                                                                                 Opportunity
                                                                                 abounds
                                                                                 Tourism is boosting economy
                                                                                 and affordability remains
                                                                                 advantageous

                                                     26
Western Australia

Baby steps                                                                         20
Minimal growth forecast
following continued challenges
after mining investment boom

                                                   Tasmania

 33                                                In demand
                                                   Price surge is slowing, but
                                                   employment opportunity and
                                                   migration beckons demand

See page 41 for references, disclaimer and acknowledgements.

                                                                                  The QBE Australian Housing Outlook 2019–2022   3
02.              Housing
                                                 outlook

              Australian
              housing snapshot

       Economic indicators 2022 forecast
                                                                                                                      Overseas
           Cash rate                             Employment growth                     Unemployment rate              migration

           1.5% 1.7% 4.8%
           July 2019 1.0%                        2019 2.6%                             2019 5.1%
                                                                                                                      248,446
           Consumer Price                                                              Gross Domestic                 year to
                                                                                2.5

           Index (CPI) growth                                                          Product (GDP)                  December 2018
                                                                                       growth
                                                    2.1

                                                                         1.9
                                                           1.7

                                                                  1.6

           2.5%                                                                        2.9%                           2.8%
                                                                                                                      from
                                                    2018

                                                           2019

                                                                  2020

                                                                         2021

                                                                                2022

           2019 1.7%                                                                   2019 2.1%
                                                                                                                      December 2017

           Housing                                 Population
           affordability*

           26%
                                                   25,180,234                                           1.6%
           at June 2019                            from December 2018                                   from December 2017 (est)

    * Housing affordability is shown as, mortgage repayments at the prevailing standard variable rate
    (based on 75% of the median house price), as a percentage of household disposable income
4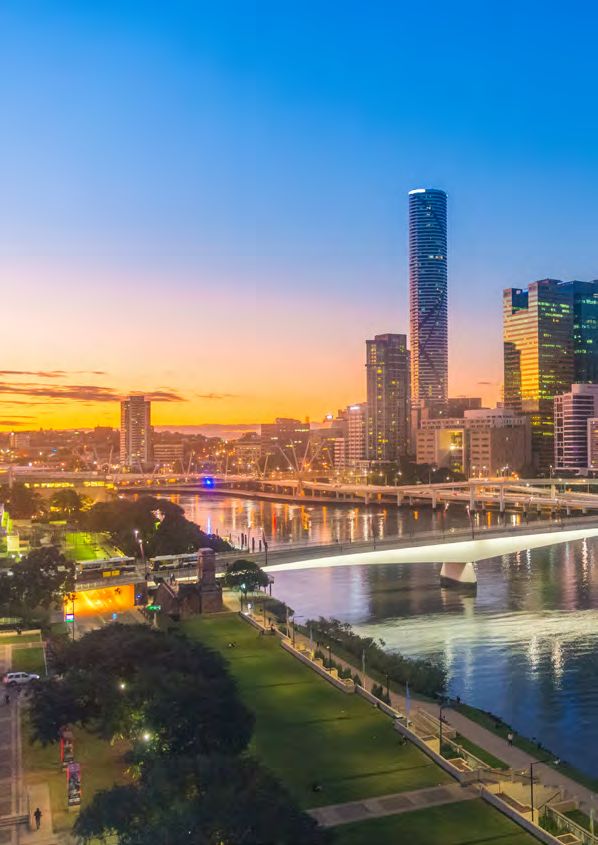
Change in home loan activity Year to June 2019

     First home buyer                       Non first home buyer                       Investors*

     -6.8%                                  -14.0% -25.5%                              *based on value of investor loans

 House commencements                                                Vacancy             Sydney                Brisbane
                                                                    rates                    3.6%                  2.2%
 ‘000s pa                     ‘000s pa                              at Mar 2019         2018 2.5%             2018 2.2%

 109.1                        116.3                                                     Melbourne
                                                                                             2.1%
                                                                                                              Perth
                                                                                                                   2.4%
 10 years to 2019             five years to 2019
                                                                                        2018 1.9%             2018 4.8%

 Unit commencements                           Unit dwellings                                          Total dwelling
                                                                                                      commencements
                                              as a proportion of total
 ‘000s pa           ‘000s pa                  dwelling commencements
                                                                                                      192.9                ‘000s
                                                                                                                           pa

 83.8 103.7 43%                                                   47%                                 10 years to 2019

 10 years to 2019   five years to 2019         10 years to 2019   five years to 2019                  220.0                ‘000s
                                                                                                                           pa
                                                                                                      five years to 2019

                                                                                       The QBE Australian Housing Outlook 2019–2022   5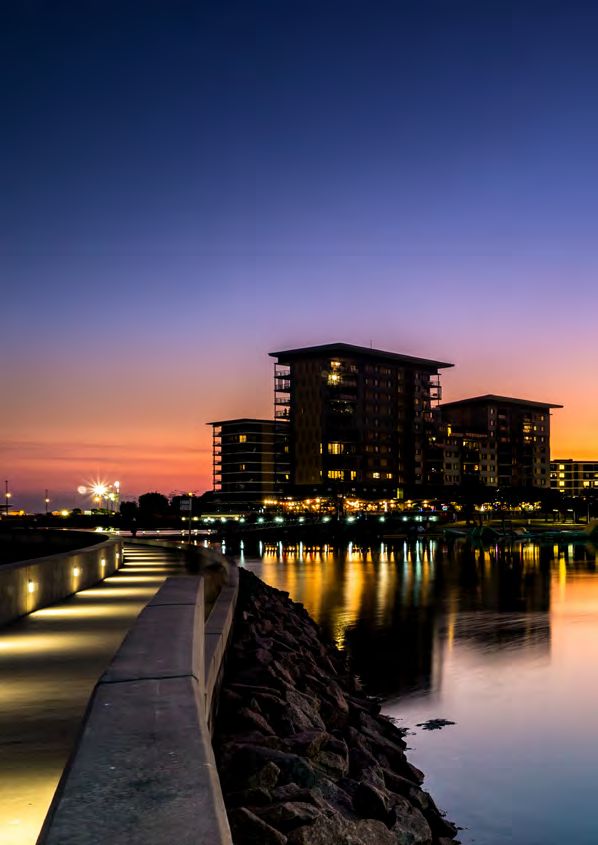
03.   Spotlight

    High-density
    missing the
       mark?

                        The share of new medium and
                        high-density dwellings (units)
                        has increased across Australia’s
                        capital cities to meet the demand
                        for affordable homes. But is this a
                        positive outcome for the residential
                        property market and housing
                        affordability?
                        Units and particularly new apartment
                        developments are largely catered for and
                        built with investors in mind. Developers
                        are reliant on pre-sales (who are usually
                        investors) to obtain the finance to
                        commence construction. In contrast,
                        owner occupiers, who actually account
                        for the majority of buyers, have typically
                        favoured properties that they can readily
                        move into.

                        However, units have a significantly
                        longer gestation period than houses.
                        The Australian Bureau of Statistics reports
                        that an apartment building on average
                        takes 84 weeks to build, which is almost
                        three times longer than a house. A typical
                        high-rise apartment building can take well
                        over two years to complete, with the total
                        development period being even longer
                        when the pre-selling period is accounted for.

                        Consequently, units are less able than
                        houses to meet rapid changes in demand,
                        particularly owner occupier demand, due
                        to the longer gap between the rise in
                        demand and the new supply coming onto
                        the market. The lag can drive up prices
                        as an undersupply will persist longer. This
                        price volatility also attracts speculative
                        investments for capital gains rather than for
                        long term occupation of housing. In turn,
                        this speculative demand fuels new supply to
                        hit the market simultaneously as the market
                        peaks, ultimately resulting in excess stock
                        and downward price pressures.

6
Evidence of the price volatility created      Average construction period for different dwelling types
by an increased reliance on units can be
                                              (Weeks)
seen in a comparison of the Sydney and
Adelaide residential property markets         80
                                                                                                                      84
performance over the past 20 years.                                                                                  weeks
Average house rent and price growth           60
                                                                                     52% faster
(relative to incomes) in Sydney, where over                  65% faster           than apartments
                                                          than apartments
60% of new supply comprises of units,         40
has been greater than in Adelaide, where                                               40
                                                                                      weeks
units have accounted for only 27% of new      20               29
                                                              weeks
supply. Volatility in Sydney has also been
higher, with price growth varying 9.4%         0
around the average compared to 7.3%                           HOUSES              TOWNHOUSES                     APARTMENTS
for Adelaide.

Consequently, the trend of increasing
medium and high-density development           Level of unit development versus long term* house price
is at odds with providing more affordable     and house rental growth Sydney and Adelaide
housing for owner occupiers. Unless more
houses are provided to the market, or                                                               SYDNEY               ADELAIDE
timely delivery models for medium and
high-density dwellings are developed, then     Units as % of completions                                61%                      27%
the mismatch in the timing of demand
versus supply is expected to persist.          Average increase in house prices
                                                                                                       2.7%                     2.2%
                                               above income growth (p.a.)
Continued price volatility could become
even more evident in the next few years        Average increase in house rents
                                                                                                       0.2%                    -0.5%
as more onerous lending conditions have        above income growth (p.a.)
forced many potential investors out of the
market. The outcome will likely be a delay     Volatility in house price growth
                                                                                                       9.4%                     7.3%
in the supply of new units, potentially        (standard deviation)
causing accelerated price growth and
reduced housing affordability.                *20 years to June 2019

                                                                                            The QBE Australian Housing Outlook 2019–2022   7
04.                State and Territory
                                               overview

                     States at
                     a glance

                                            NSW                               VIC                            QLD                              WA
                   Population
            at December 2018           8,046,070                        6,526,413                       5,052,827                       2,606,338
             Five-year growth                7.9%                           11.9%                            7.8%                             4.2%
       ANNUAL MOVEMENT
        YEAR TO JUNE 2019
                    FHB loans               -2.3%                            -7.5%                          -13.2%                           -9.8%
               Non-FHB loans               -18.1%                          -14.8%                           -13.2%                          -10.5%
        Investor loans (value)             -28.7%                          -24.2%                           -19.6%                          -26.9%

                                         Sydney                       Melbourne                          Brisbane                           Perth
                Median house
            price at June 2019         $983,000                         $770,900                        $548,600                         $519,000
           Annual movement
               (year to June)              -12.8%                           -11.4%                           -2.8%                           -3.4%
      Forecast median house
     price growth 2019–2022                  5.8%                            5.1%                           20.3%                            6.0%

            Median unit price
                at June 2019           $722,000                         $549,000                        $421,400                        $360,900
           Annual movement
               (year to June)               -8.0%                           -0.2%                            -5.8%                           -8.9%
        Forecast median unit
     price growth 2019–2022                 -0.3%                            3.8%                            3.2%                             5.3%

    Vacancy rates (at Mar 2019)              3.6%                            2.1%                            2.2%                             2.4%
    Annual rental movement
              (to June 2019)                 0.3%                             1.7%                           0.3%                            -3.7%

                 Affordability 1           30.9%                            30.2%                           20.3%                            16.8%
                                   1   Housing affordability is shown as, mortgage repayments at the prevailing standard variable rate (based on 75% of the
                                       median house price), as a percentage of household disposable income

8
Darwin
Northern
Territory
Queensland
Western
Australia
Brisbane
South
Australia
Perth
New South Wales
Sydney
Canberra
Adelaide
Melbourne
ne
Victoria
Tasmania
Hobart
SA TAS ACT NT
Population
1,742,744 531,529 423,811 245,854 at December 2018
3.9% 3.6% 9.7% 1.5% Five-year growth
ANNUAL MOVEMENT
YEAR TO JUNE 2019
8.1% 13.4% -23.8% 23.0% FHB loans
-6.0% 0.1% -10.9% -29.5% Non-FHB loans
-13.4% -6.1% -19.4% -30.0% Investor loans (value)
Adelaide Hobart Canberra Darwin
Median house
$488,200 $499,300 $705,000 $500,000 price at June 2019
Annual movement
-0.8% 2.5% 4.4% 0.0% (year to June)
Forecast median house
12.7% 4.1% 6.4% 7.0% price growth 2019–2022
Median unit price
$382,100 $408,500 $450,000 $325,000 at June 2019
Annual movement
1.4% 3.2% 2.3% -14.9% (year to June)
Forecast median unit
4.7% 2.8% 6.7% 9.2% price growth 2019–2022
1.9% 1.5% 0.6% 7.1% Vacancy rates (at Mar 2019)
Annual rental movement
0.8% 5.9% 3.2% -4.5% (to June 2019)
18.7% 22.3% 13.7% 11.0% Affordability1
The QBE Australian Housing Outlook 2019–2022 904. State and Territory
outlook
State of play
Interest rate cuts and
reduced supply a positive
impetus for prices
House prices across all capital cities are expected to stabilise in 2019/20 after
experiencing slowing growth or declines in the past two years. The combination
of an easing of lending serviceability buffers and lower interest rates is expected to
assist borrowers. Strong population growth and a sharp downturn in new dwelling
completions should result in the dwelling balance across most markets tightening
from 2020/21. This will provide some positive impetus to prices.
New dwelling completions have averaged a record 209,000 per annum in the
five years to 2018/19 with each of these years being higher than any year prior.
The increased supply has helped alleviate some of the demand pressures coming
from strong population growth across most capital city markets. Property prices
are expected to continue to be supported by further employment growth and a
low unemployment rate, as well as cuts to interest rates in 2019. This is expected to
support borrowers and put a floor on prices before assisting price growth as new
supply starts to fall away.
Demand and Supply
Strong population growth will be key to the market navigating the downturn in property
prices. Net overseas migration is forecast to average a net inflow of 243,000 per annum
in the three years to 2021/22 and this is expected to translate to underlying demand for
an additional 204,000 dwellings per annum. At the same time, new dwelling building
approvals fell by 19% in 2018/19 and dwelling completions are subsequently forecast to
fall to 163,500 dwellings by 2020/21, which is well below underlying demand. This could
mean some oversupplied markets will tip back into undersupply by 2021/22 creating
the potential for a recovery in prices. However, the pace of recovery may be limited.
While the interest rate serviceability threshold for most borrowers has been reduced,
lenders are expected to maintain their more conservative approach towards assessing
borrower income and expenses. There is also the possibility of interest rate rises by
2021/22 as the economy begins to gather momentum.
City outlook
The strongest outlook for property prices is forecast for Brisbane, where a decade
of modest price increases has left the market relatively affordable. An oversupply in
the market is negatively impacting prices, but it is predicted that a combination of
rising population growth and rapidly falling supply will see this situation turn. With the
Queensland economy also forecast to strengthen, residential price growth is forecast
to steadily accelerate through to 2021/22. In both Canberra and Adelaide, with
conditions predicted to remain steady, the recent moderate price growth is forecast
to continue, although the Canberra median house price is expected to be influenced
in the short term by the timing of the introduction of the first home buyer stamp duty
exemption from 1 July 2019.
The worst appears to have passed for the Sydney and Melbourne markets, but
upside over the next three years remains limited. Despite some easing in the
assessment of mortgage serviceability by lenders, more rigorous assessments of
income and expenses in loan applications are predicted to continue to impact growth
in credit and therefore the rate of property price growth. After strong rises over the
past four years, price growth in Hobart is now slowing due to affordability constraints.
The Perth and Darwin residential markets are forecast to remain weak in the short
term, but by 2021/22, an upturn in property prices is projected to emerge as their
dwelling oversupplies are absorbed and the improved affordability provides a trigger
for price growth as economic conditions begin to strengthen.
10Median prices by capital city quarter ended June 2019
Houses
Sydney Melbourne Brisbane Perth Adelaide Hobart Canberra Darwin
$'000 % Var $’000 % Var $’000 % Var $’000 % Var $’000 % Var $’000 % Var $’000 % Var $’000 % Var
Forecast growth (%)
2019-2022 5.8 5.1 20.3 6.0 12.7 4.1 6.4 7.0
Forecast
2022 1,040.0 2.5 810.0 3.2 660.0 9.1 550.0 4.8 550.0 4.8 520.0 1.0 750.0 2.7 535.0 3.9
2021 1,015.0 2.0 785.0 1.7 605.0 6.1 525.0 1.9 525.0 4.0 515.0 1.0 730.0 2.8 515.0 2.0
2020 995.0 1.2 772.0 0.1 570.0 3.9 515.0 -0.8 505.0 3.4 510.0 2.1 710.0 0.7 505.0 1.0
Prior years
2019 983.0 -12.8 770.9 -11.4 548.6 -2.8 519.0 -3.4 488.2 -0.8 499.3 2.5 705.0 4.4 500.0 0.0
2018 1,126.6 -5.7 870.3 0.3 564.3 1.8 537.3 -0.1 492.1 2.6 487.0 11.0 675.0 0.6 500.0 -7.4
2017 1,194.9 14.1 867.6 15.9 554.3 2.7 537.9 -3.8 479.6 3.6 438.5 9.7 671.0 8.2 540.0 -6.3
2016 1,047.3 2.5 748.8 7.3 539.7 5.2 559.4 -3.9 462.8 3.8 399.6 11.0 620.0 8.2 576.0 -5.6
2015 1,022.2 24.1 697.7 15.6 512.8 4.3 582.2 -2.6 446.0 2.5 360.0 0.2 572.8 4.1 610.0 -1.7
2014 824.0 17.3 603.6 10.5 491.6 6.3 597.8 4.9 435.1 6.2 359.1 6.4 550.0 1.9 620.8 1.4
2013 702.4 8.2 546.3 3.4 462.5 4.0 569.8 10.7 409.8 0.5 337.4 -1.8 540.0 5.9 612.0 7.4
2012 649.1 -0.4 528.4 -5.3 444.6 -2.9 514.7 -1.6 407.6 -3.0 343.6 -2.0 510.0 -1.9 570.0 10.7
2011 651.6 -0.4 558.2 -3.5 457.7 -5.7 522.9 -3.9 420.2 -2.0 350.5 -2.1 520.0 3.9 515.0 -7.3
2010 654.5 15.1 578.4 24.8 485.3 9.1 544.3 9.3 428.7 11.5 358.0 9.2 500.5 11.0 555.3 18.2
2009 568.6 1.2 463.5 0.1 444.8 -3.2 498.0 -1.9 384.6 -2.6 327.9 3.0 451.0 -3.9 469.9 11.0
2008 561.8 1.0 463.1 11.1 459.3 13.1 507.8 -1.8 394.8 18.3 318.3 4.6 469.5 6.1 423.3 7.2
2007 556.4 2.7 416.9 11.2 406.1 16.0 517.0 9.8 333.7 9.6 304.2 6.1 442.5 13.5 395.0 12.9
2006 541.7 -0.9 374.7 7.5 350.2 7.0 470.8 48.7 304.6 7.6 286.8 13.2 390.0 6.0 350.0 25.1
2005 546.6 0.9 348.6 4.0 327.2 2.1 316.6 13.8 283.0 6.3 253.4 6.6 368.0 -1.9 279.8 9.7
2004 541.9 6.7 335.0 7.0 320.5 29.1 278.2 15.6 266.2 17.3 237.8 59.9 375.0 13.7 255.0 23.8
2003 507.8 15.7 313.0 9.8 248.3 27.4 240.7 16.3 226.9 24.5 148.7 25.7 330.0 29.4 206.0 3.0
2002 438.7 20.8 285.1 18.7 194.9 17.9 207.0 12.1 182.3 17.2 118.3 4.8 255.1 21.5 200.0 7.0
Units
Sydney Melbourne Brisbane Perth Adelaide Hobart Canberra Darwin
$'000 % Var $’000 % Var $’000 % Var $’000 % Var $’000 % Var $’000 % Var $’000 % Var $’000 % Var
Forecast growth (%)
2019-2022 -0.3 3.8 3.2 5.3 4.7 2.8 6.7 9.2
Forecast
2022 720.0 2.9 570.0 3.6 435.0 3.6 380.0 4.1 400.0 2.6 420.0 1.2 480.0 2.1 355.0 4.4
2021 700.0 0.0 550.0 0.9 420.0 1.2 365.0 1.4 390.0 1.3 415.0 1.2 470.0 2.2 340.0 3.0
2020 700.0 -3.0 545.0 -0.7 415.0 -1.5 360.0 -0.3 385.0 0.8 410.0 0.4 460.0 2.2 330.0 1.5
Prior years
2019 722.0 -8.0 549.0 -0.2 421.4 -5.8 360.9 -8.9 382.1 1.4 408.5 3.2 450.0 2.3 325.0 -14.9
2018 784.9 -4.3 550.2 -1.0 447.3 2.6 396.1 -1.0 376.9 3.6 396.0 19.0 439.9 -2.2 382.0 -18.7
2017 820.4 10.5 555.9 6.1 435.8 1.5 399.9 -3.1 363.8 7.0 332.8 -0.9 450.0 3.1 470.0 -6.0
2016 742.4 2.8 524.0 3.2 429.1 -0.6 412.6 -4.7 340.0 2.1 335.7 11.5 436.5 2.7 500.2 4.2
2015 722.1 15.5 508.0 4.9 431.8 4.3 432.9 -3.5 332.9 -2.1 301.1 -6.0 425.0 4.2 480.0 -1.0
2014 624.9 13.2 484.1 6.1 413.9 4.9 448.6 3.1 340.0 4.2 320.2 3.4 408.0 -0.5 485.0 4.5
2013 552.2 6.6 456.3 2.5 394.6 1.0 435.3 6.4 326.5 2.4 309.6 4.6 410.0 -2.4 464.0 6.7
2012 517.9 4.3 445.3 -3.2 390.7 -0.3 409.1 1.8 318.9 -4.4 295.8 1.3 420.0 0.0 435.0 2.4
2011 496.4 2.2 460.1 0.0 391.9 -2.6 401.8 -3.0 333.5 -0.8 291.9 -0.4 420.0 1.2 425.0 -2.9
2010 485.6 15.7 460.3 18.3 402.2 6.8 414.3 7.7 336.3 12.1 293.1 7.1 415.0 10.7 437.6 15.1
2009 419.9 3.0 388.9 4.4 376.5 -2.9 384.5 -0.9 300.0 2.3 273.7 4.9 375.0 7.1 380.1 15.5
2008 407.5 -0.1 372.6 7.7 387.8 11.4 388.0 0.9 293.2 15.7 261.0 7.6 350.0 -1.4 329.0 17.8
2007 408.2 1.6 345.9 12.7 348.2 13.2 384.5 11.3 253.5 10.2 242.6 -3.0 355.0 9.2 279.3 4.4
2006 401.7 0.8 307.0 6.2 307.7 10.2 345.6 34.2 229.9 5.5 250.3 14.0 325.0 4.2 267.5 32.1
2005 398.3 1.2 289.2 1.6 279.3 9.1 257.5 15.6 217.8 6.6 219.5 6.2 312.0 4.0 202.5 6.6
2004 393.7 3.4 284.5 1.3 256.0 20.6 222.8 6.0 204.3 11.9 206.7 45.0 300.0 15.4 190.0 20.9
2003 380.7 3.8 280.8 6.0 212.2 10.1 210.1 19.9 182.5 30.0 142.6 26.5 260.0 20.4 157.1 2.8
2002 366.9 14.2 264.9 19.0 192.7 4.0 175.2 16.4 140.4 10.9 112.7 10.4 216.0 39.4 152.8 7.8
The QBE Australian Housing Outlook 2019–2022 1104. New South Wales
outlook
A positive Sydney house market
Sydney’s median house price fell
prospect for a second consecutive year in
2018/19, with the median house price
at $983,000 at June quarter 2019.
This is 13% below the same quarter
Recovery underway as new from 2018 and 18% below the peak of
$1,194,900 at June quarter 2017.
serviceability threshold A combination of factors has driven the
encourages owner occupiers downturn in Sydney residential prices,
back into the market including the record number of new
dwelling completions which are eroding the
dwelling deficiency in Sydney. Consequently,
the vacancy rate has increased, reducing
the upward pressure on rent and property
prices. Tightened bank lending policy,
particularly toward investors who were
a key driver of the Sydney upturn to the
2017 market peak, has also reduced the
borrowing capacity of purchasers.
The decline in Sydney house prices in
2018/19 has mostly impacted Sydney’s inner
and middle ring suburbs. In these areas the
median house price has fallen by 16.5% and
14.0% respectively. The outer ring suburbs
median price fell by 8.5%. The tightening of
lending criteria, particularly when assessing
income and expenses to determine the
ability to service a loan, appears to have had
a significant impact on the more expensive
end of the housing market (i.e. the inner
and middle ring suburbs) than the more
affordable outer ring suburbs of Sydney.
The influx of new dwellings in the market are
contributing to a rise in vacancy rate, which
has increased from 2.2% in March quarter
2018 to 3.6% in March quarter 2019. This is
the highest level of vacancy rates seen since
December quarter 2004. Vacancy rates
were highest in inner Sydney (3.7%) and
outer Sydney (3.5%) with the lowest being
in middle Sydney (3.1%); where vacancy
rates have trended downwards despite high
supply volumes. Rental growth in Sydney
has slowed to 0.3% in 2018/19 after having
increased by 2.2% the year prior.
Investors
Investors led the downturn in the Sydney
residential market, being most impacted by
APRA guidelines to adopt more conservative
lending practices. Higher interest rates
and greater scrutiny of loan applications
has reduced investors’ borrowing capacity
compared to owner occupiers, causing
the value of loans to investors to fall by 41%
between 2016/17 and 2018/19. Low yields
and limited price growth forecast in 2019/20
means investors will remain discouraged.
12Owner occupiers flattened out in 2018/19, declining by 2%. Sydney unit market
Total owner occupier loans in New South Loans to upgraders and downsizers in New
Wales fell by 15% in 2018/19 after a small South Wales fell by 4% in 2017/18 and 18%
in 2018/19 with many potential upgraders In recent years, the pipeline of
positive result in 2017/18. First home buyer
expected to delay their transaction until dwelling completions in Sydney has
loans surged by 74% in 2017/18 as this buyer
the environment for selling their existing been weighted toward apartments
group took advantage of the introduction
home improves. and it is expected that the recent rise
of stamp duty concessions, but activity
in vacancy rates has been mainly in
this sector. Price declines for units
in Sydney have been slightly lower
Outlook than for houses, with a 12% fall in the
New dwelling completions are expected to have peaked in 2018/19 and rental median price from its June 2017 peak
growth is likely to remain weak while vacancy rates are elevated. However, the to $722,000 at June 2019. While the
easing of a selection of restrictions placed by APRA on lending practices could unit market has been impacted by
somewhat offset these negative factors and this is likely to encourage more weaker investor demand, the more
purchasers back into the market. Consequently, house prices are estimated to affordable cost of apartments has
be at, or close to, bottom in 2019 with the median house price forecast to rise to meant that the stamp duty exemption
$995,000 (+1.2%) in the year to June 2020. for first home buyers (on purchases
up to $650,000) has provided some
New supply is due to fall away sharply from 2020 due to current projects being support to the unit sector.
completed and new dwelling building approvals falling. With population growth in
Sydney to remain strong, vacancy rates are likely to tighten rapidly in 2020/21 and
2021/22. This will place upward pressure on rent and ultimately property prices.
Outlook
However, the legacy of conservative lending practices by institutions, coupled
with a tightening in interest rate policy toward the end of this forecast period, will The relaxing of the serviceability
restrict growth in borrowing capacity and therefore the rate of property price threshold for borrowers by APRA is
growth. Sydney’s median house price is forecast to rise a cumulative 6% in the next expected to have a positive impact
three years, taking the median to $1,040,000 by June 2022. Despite the rise, the on lending for owner occupiers
median house price at June 2022 is forecast to still be below the June 2017 peak. more than investors; who currently
pay an interest rate premium. With
the unit market more exposed to
investor purchasers, a further 3%
median unit price decline is forecast
New South Wales: dwelling prices for 2019/20 before unit prices
Percentage points (%)
($’000) FORECAST show signs of recovering from
1,280 Sydney house price 2020/21. This recovery is predicted
2018: -6 2020: +1
as vacancy rates begin to tighten
2019: -13 2021: +2
2022: +2 and attract investors back into the
market. Sydney’s median unit price
Sydney real is expected to reach $720,000 by
house price
June 2022 — roughly on par with the
2018: -8 2020: 0
640 2019: -14 2021: 0 June 2019 level.
2022: 0
Sydney unit price
2018: -4 2020: -3
2019: -8 2021: 0
2022: +3
320
Sydney real unit price
2018: -6 2020: -5
2019: -10 2021: -2
2022: 0
Wollongong
160
house price
2018: 0 2020: 0
2019: -11 2021: +2
2022: +3
Newcastle
house price
2018: +4 2020: +3
80 2019: -6 2021: +3
99 00 01 02 03 04 05 06 07 08 09 10 11 12 13 14 15 16 17 18 19 20 21 22 2022: +4
* Real house/unit prices in 2017 dollars
The QBE Australian Housing Outlook 2019–2022 1304. New South Wales
outlook
New South Wales and Sydney regions
New South Wales
2
1
Sydney
regions
Singleton Lake
Cessnock Macquarie
Lithgow Central Coast
Bathurst Hawkesbury
Hornsby
Blue Mountains Northern
Blacktown Beaches
Penrith Ryde North
Sydney
Oberon Liverpool Randwick
Sutherland
Campbelltown Shire
Wollondilly
Wollongong
Wingecarribee
Sydney median house price annual % change Regional New South Wales
Property prices in Wollongong
and Newcastle are likely being
Inner Middle Outer Median
supported by first home buyer
demand with the median house
price in these regions at, or under,
-16.5% -14.0% -8.5% -12.8% the $650,000 first home buyer
stamp duty concession threshold.
14Regional New South Wales centres
2 Newcastle and the Hunter region
Newcastle is slightly more
discrete from the Sydney Price
market, compared to growth
Wollongong. Situated further
from Sydney means Newcastle
is less connected to Sydney’s
employment market and
therefore residential prices in the
-6.2%
region are more indicative of local
economic conditions. Vacancy
rates
Local economic conditions have
continued improving, following a
2.1%
prolonged period of stagnation as a
result of declining investment in the coal
industry of the region. The unemployment
rate has fallen to 4.7% at May 2019, which
1 Wollongong region is its lowest level in more than five years Forecast
and down from a peak of 8.0% in May house price
Wollongong has strong economic links to Sydney, with 2015. There has also been an uptick in
the 2016 Census identifying more than 26% of full-time population growth over this period.
working residents of the Wollongong LGA commute to
Sydney for work. Nonetheless, Wollongong maintains its
own diversified economy. The city has seen strong and
The softer economic conditions coupled
with an uptick in supply meant Newcastle
10.7%
saw more modest price growth than
consistent population growth since 2012. Sydney over the upturn in the five years Unemploy-
A large driver of this population growth has been residents seeking to June 2018, averaging 8.1% per annum. ment
more affordable properties than are available in Sydney. This includes Affordability is comparatively better and
both first home buyers and upgraders seeking a more affordable consequently Newcastle’s median house
4.7%
larger home. Wollongong also attracts retiree downsizers. price has fallen by a more modest 6% in
2018/19, compared to a reduction of 13%
The downturn in median house price in Wollongong has followed in Sydney.
that of Sydney, with weaker Sydney property prices making it more
difficult to trade up/down to a Wollongong house. Wollongong’s
median house price peaked in March quarter 2018. House prices
began to turn down in June quarter 2018, which has accelerated to a Outlook
decline of 11% in 2018/19.
The local economy in Newcastle is likely to continue
to strengthen as the city cements itself as a logistics
Outlook hub in the region. Major projects such as the Newcastle
light rail and expansion of Newcastle University at
Wollongong’s affordability advantage over Sydney should Honeysuckle will provide a boost which will feed
help to support property prices and ensure it has a more through to population growth and housing demand.
moderate downturn than Sydney. As with Sydney, the New dwelling supply in Newcastle looks to have peaked,
improved lending environment should see prices stabilise in although vacancy rates appear to remain relatively tight
2019/20. However, vacancy rates in Wollongong have edged at 2.1% in March 2019.
upward to 2.8% at March 2019 as new supply has increased.
The unemployment rate was above that of Sydney at 4.7% Over the forecast period to June 2022, Newcastle is
in May 2019, although this is still low and reflects a healthy expected to see annual average price growth of 3% with
local economy. The region is expected to continue to price growth accelerating through the later end of the
experience robust population growth as population from period. This will represent a cumulative increase of 11%
Sydney continues to move south. Modest price growth is with the median house price expected to reach a new
forecast over 2020/21 and 2021/22, with the median house high of $630,000 by June 2022.
price in Wollongong rising by 6% over the next three years
to $685,000 at June 2022.
The QBE Australian Housing Outlook 2019–2022 1504. Victoria
outlook
New Melbourne house market
heights The median house price in
Melbourne eased to $770,900 in
June 2019. This represents the sixth
consecutive quarter of price declines
Migration set to benefit economy, and a 14.1% decline from the peak in
December quarter 2017. This decline
but a surge in unit supply may follows a cumulative 70% rise over
dampen price growth the five-and-a-half years to December
2017. The median unit price on the
other hand is estimated to be down
just 3% in the same period, reflecting
the lower unit price growth in the
lead up to the peak, and therefore
lower subsequent decline. The
downturn in the market has come as
rising supply has eased the upward
pressure on property prices and a
tightening in lending serviceability
assessments has reduced the
borrowing capacity of investors and
owner occupiers, causing many to
retreat from the market.
Buyer activity
Investor activity underpinned the upswing
in the Melbourne market to 2017, as price
growth and low vacancy rates coupled with
a low interest rate environment attracted
investors. However, investor lending has
since dropped strongly. The value of
investor loans in 2018/19 was down by
33% from its peak 12-month period in 2017.
Higher interest rates for investors and tighter
criteria in assessing loans have reduced the
borrowing capacity of investors while the
recent falls in residential prices have also
caused investors to retreat.
The number of loans to upgraders and
downsizers has also fallen, down 15% in
2018/19. The decline in house prices in
Melbourne has made it less attractive to sell
an existing dwelling and trade up or down.
First home buyers have shown stronger
willingness to enter the market with the
introduction of Victorian Government stamp
duty concessions. First home buyer activity
increased by 36% in 2017/18 and has remained
relatively high, being only 7% lower in 2018/19.
The downturn in house prices in 2018/19 has
been relatively even across metropolitan
Melbourne. The total Melbourne median
house price fell by 11.4% in 2018/19, ranging
from a 9.6% decline in outer ring suburbs,
to a 12.8% decline in middle ring suburbs.
However, price declines from their peak
have been largest in inner (-20.3%) and
middle (-17.2%) suburbs, relative to outer
Melbourne (-9.7%).
16Demand and supply Strong population growth saw demand for Melbourne unit market
Victoria has seen burgeoning population new dwellings surge, creating a significant
growth in recent years. Despite accounting supply response. Dwelling completions
averaged 65,800 per annum in the three The median unit price in Melbourne
for only 26% of the nation’s population at
years to June 2019, compared to just of $549,000 at June 2019 is down just
June 2019, Victoria has accounted for 34%
43,200 dwellings per annum in the 3% on its peak in December 2017. This
of national population growth over the prior
preceding two decades. A significant portion comes as the median unit price saw
five years. This translates to growth of 141,300
of this growth has been in the multi-unit a moderate price growth of 26.5%
persons per annum, or average annual growth
dwelling sector and any downward pressure through the five-and-a-half-year
of 2.3%, and compares with 1.6% per annum
coming from the high level of supply is period preceding the peak, compared
growth nationally. Rises in both net interstate
expected to be more prevalent for units to that of houses.
and overseas migration inflows have driven
this increase. than for houses.
Supply
The rise in dwelling supply in Melbourne
has been underpinned by a surge in unit
Outlook construction. For the first time on record
(in 2015/16), commencements for attached
Despite some easing in lending serviceability assessment thresholds in 2019,
dwellings were greater than for detached
price growth in 2019/20 is still expected to be hampered by the rise in dwelling
houses. While unit commencements in
completions and an uptick in vacancy rates. However, population growth in
Melbourne have fallen since peaking in
Melbourne is expected to remain strong and new dwelling completions are
2016/17, supply is anticipated to remain
expected to drop off sharply from 2020/21, reflecting the current fall in building
elevated. The decline in investor demand
approvals. Vacancy rates in Melbourne are expected to rapidly tighten as the
has hit the new unit market, which is more
modest undersupply of dwellings begins to swell again. This is forecast to drive
favoured by investors, harder than the
the recovery of price growth in the next cycle, although the continued reduced
house market. This is likely to curtail the next
availability of credit will result in a much more subdued rate of growth than was
pick up in unit supply and will constrain new
seen in the previous upturn. In aggregate, Melbourne’s median house price is
unit commencements in the next cycle.
projected to rise by a total of 5% over three years to $810,000 as at June 2022.
Outlook
Percentage points (%)
Victoria: dwelling prices The median unit price is expected
Melbourne
house price to remain relatively flat over
($’000)
FORECAST 2018: 0 2020: 0 2019/20 (-1%) before the supply
1,280
2019: -11 2021: +2 of recently completed unit stock
2022: +3
is absorbed. Unit prices are
Melbourne real
forecast to show modest growth
house price in 2020/21 and 2021/22 as rental
2018: -2 2020: -1 growth returns, yields begin to
2019: -13 2021: 0
2022: +1 pick up and investors return to the
640 market. Over the forecast period
Melbourne unit price it is projected the median unit
2018: -1 2020: -1 price growth will increase by an
2019: 0 2021: +1
2022: +4
aggregate 4% to reach $570,000
by June 2022.
Melbourne real
unit price
320
2018: -3 2020: -2
2019: -2 2021: -1
2022: +1
Geelong house price
2018: +13 2020: 0
2019: -4 2021: +1
160 2022: +3
Bendigo house price
2018: +3 2020: +2
2019: +2 2021: +3
2022: +3
Ballarat house price
80
99 00 01 02 03 04 05 06 07 08 09 10 11 12 13 14 15 16 17 18 19 20 21 22 2018: +7 2020: +3
2019: +8 2021: +2
2022: +2
* Real house/unit prices in 2017 dollars
The QBE Australian Housing Outlook 2019–2022 1704. Victoria
outlook
Victoria and Melbourne regions
Victoria
3
1
2
Melbourne
Regions
regions
Mitchell
Whittlesea
Macedon Ranges Nilumbik
Murrindindi
Hume
Whittlesea Manningham
Hume
Moreland Nilumbik
Yarra Yarra
Melton Ranges
Yarra
Moreland
Melbourne Ranges
Melton Melbourne Port
Knox
Wyndham Hobsons Phillip
Bay Port
Hobsons Phillip Bayside
Cardinia
Bay Baw
Baw
Frankston
Wyndham Frankston
Mornington
Peninsula Mornington
Peninsular
Bass Coast
Melbourne median house price annual % change Regional Victoria
Prices have held up better in Geelong
and Ballarat over the past two years
Inner Middle Outer Median
while Melbourne’s median house price
has declined. Demand appears to be
fuelled by a combination of population
-10.6% -12.8% -9.6% -11.4% escaping Melbourne’s higher property
prices, and first home buyer incentives
attracting population into these more
affordable centres.
18Regional Victoria centres
1 Ballarat
Ballarat has enjoyed solid median house
price growth over the past three years,
Price averaging around 7.8% per annum. Ballarat
growth benefits from its proximity to Melbourne
with the city offering a viable commuting
option to Melbourne via road and rail.
7.6% Growing demand is likely to have come from
first home buyers from Melbourne taking
advantage of the stamp duty concessions on
offer. The local economy is also reasonably
Vacancy strong as evidenced by a relatively low
rates unemployment rate (4.6% at March quarter
2019) while tight vacancy rates (1.1% at May
2019) are also likely to have supported
1.1% investor demand and property prices.
Outlook: Ballarat will benefit
2 Geelong
from a number of employment-
Forecast generating projects in the short
Geelong has met the challenge of rising unemployment due to the
house price loss of car manufacturing in the area in late 2016 thanks to solid local
term. This includes significant new
employment growth in the service sector. Nevertheless, after rising
projects such as the $60 million
by 12.5% in 2017/18, the median house price in Geelong fell by 4% in
7.6%
Ballarat GovHub office development
2018/19 with the market slowing down in line with the downturn in
and the $25 million Ballarat Sports
the Greater Melbourne market.
and Events Centre. Commuters are
expected to continue to be attracted In comparison with the decline in Melbourne house and unit prices,
to this affordable market, although Geelong’s housing demand has been buoyed by population flows
Unemploy- the downturn in Melbourne house from Melbourne, which in turn has supported prices and mitigated
ment prices is projected to influence the magnitude of decline in the median house price.
Ballarat prices, with its median
house price forecast to rise a
4.6% cumulative 8% to reach $425,000 at Outlook: Employment conditions in Geelong are likely
June 2022. to stay relatively buoyant with a number of new projects
underway including the commencement of a $65 million
office tower in the CBD, a number of educational sector
projects and the commencement of the $650 million
New Lara Maximum Security Prison expected in 2019/20.
3 Bendigo Geelong’s affordability advantage over Melbourne is
expected to continue to draw population from Melbourne,
particularly with first home buyers taking advantage
Median house price growth in Bendigo in the three years to June
of the stamp duty concessions for dwellings under the
2019 was below that of Geelong and Ballarat at 2.9% per annum. This
$600,000 threshold. However, with Melbourne house
reflects Bendigo’s greater distance from Melbourne making it less
prices becoming more affordable, the impetus to Geelong
viable for commuters, although local employment growth appears
property prices is likely to be reduced, and total growth in
to be relatively solid and reflected in an unemployment rate of 4.3%
Geelong’s median house price to June 2022 is projected
at March quarter 2019. Median house price growth in Bendigo in
to be like that of Melbourne at 4%, taking its median house
2018/19 was similar to the average of the prior three years, at 2.4%.
price to $540,000 at June 2022.
Outlook: In the absence of any major infrastructure
projects to help drive the economy, median house price
growth is likely to remain relatively modest over the
forecast period. By June 2022, the median house price is
projected to increase by 7% to reach $395,000. At 2.3% per
annum, this is similar to the average rate of growth seen
over the prior three years.
The QBE Australian Housing Outlook 2019–2022 1904. Queensland
outlook
Opportunity Brisbane house market
Brisbane’s residential market did not
abounds see the same magnitude of residential
price growth over the last cycle
compared to Sydney and Melbourne.
With affordability less strained, the
market for detached dwellings has
Tourism is boosting economy seen a more moderate downturn than
and affordability remains the other two east coast capital cities.
advantageous Median house prices
The median house price in Brisbane
declined by 2.8% over the 12 months
to June 2019 after an extended period
of mild growth that averaged 4.1% per
annum in the five years leading up to
June 2018. Rising new dwelling supply,
particularly apartments, as well as a tighter
lending environment, have been the chief
contributors to this softer price growth.
The Brisbane market is estimated to be
in oversupply although this is likely to
predominantly be in the unit sector given
the high level of recent unit supply. The
detached housing market is estimated to be
in relative balance with the unit oversupply
reflected in the higher vacancy rate in
the inner suburbs where there is a higher
concentration of apartments, compared with
middle and outer Brisbane suburbs. House
prices have also fallen much more sharply
in inner Brisbane (down 9.6% in 2018/19)
than in the middle (-1.3%) and outer (-3.8%)
ring suburbs of the city. Greater scrutiny
over household income and expenses in
assessing loan applications has likely to have
had more impact on larger loan applications,
which in turn has influenced house prices in
more expensive suburbs.
Demand and supply
Brisbane (and South East Queensland in
general) has led the economic recovery
in Queensland as the state emerges from
the downturn in mining investment, being
driven by growth in non-mining sectors.
Improved employment growth has
buoyed population growth since 2015, with
Queensland attracting stronger net inflows
from other states and territories.
Dwelling supply in Brisbane peaked over
2016/17. This was underpinned by a surge in
supply of units, mainly in the inner city. Supply
eased slightly in 2017/18 with the decline in
new dwelling completions now accelerating.
With underlying demand expected to remain
strong and new supply falling away rapidly,
the Brisbane market is forecast to move back
towards an undersupply.
20Brisbane unit market
Outlook
The Brisbane unit market has
The Queensland and Brisbane economies are forecast to continue to improve.
undergone a surge in supply over the
The lower Australian dollar is boosting the local tourism and education sectors
five years to June 2018. Annual high-
and a number of large building and infrastructure projects, including the Queens
density dwelling completions over
Wharf precinct and Cross River Rail, are underway. Brisbane continues to maintain
this period were nearly 500% higher
a significant affordability advantage over other east coast capital cities, and as
than the average of the preceding
employment prospects improve, demand from home buyers who are priced out of
two decades. Such a sharp increase
these cities is expected to increase. After a modest rise in 2019/20, median house
in supply pushed this market into
price growth is forecast to accelerate from 2020/21 as the dwelling undersupply is
oversupply which has crimped
absorbed. Median house price growth is forecast to average 6.4% per annum over
rents in Inner Brisbane (where the
the next three years, taking the median house price to $660,000 in June 2022.
bulk of unit supply has occurred). In
turn, Brisbane’s median unit price
Percentage points (%)
fell by 6% in 2018/19. It’s likely that
Brisbane and Gold Coast: dwelling prices attractive rents in the unit market
Brisbane house price
2018: +2 2020: +4
are also leading to those who would
($’000) 2019: -3 2021: +6 be willing to enter the market as first
FORECAST 2022: +9
1,280 home buyers prolonging the period
Brisbane real they remain as tenants, and delay
house price
purchasing their own unit.
2018: 0 2020: +2
640
2019: -4 2021: +4
2022: +6
Brisbane unit price
2018: +3 2020: -2
Outlook
320 2019: -6 2021: +1 Challenges will remain for the
2022: +4
Brisbane unit market given the
Brisbane real weakened lending environment
unit price
160 2018: +1 2020: -3 for investors and the excess supply
2019: -7 2021: -1 of units. A further decline in the
2022: +1
median unit price of 2% is forecast
Gold Coast in 2019/20. Modest price growth is
80 house price
2018: +2 2020: +1
expected to return through 2020/21
99 00 01 02 03 04 05 06 07 08 09 10 11 12 13 14 15 16 17 18 19 20 21 22
2019: -4 2021: +3 and 2021/22 as unit completions
2022: +5 slump and the oversupply of unit
Gold Coast unit price stock dissipates. Nonetheless, any
Regional Queensland: dwelling prices 2018: -1 2020: 0 recovery is likely to remain modest
2019: -1 2021: +1
until investors return to the market
($’000) 2022: +1
FORECAST in larger numbers, with Brisbane’s
1,280 Sunshine Coast
house price median unit price forecast to be up
2018: +7 2020: 0 by a total of 3% in the next three
2019: -2 2021: +3 years to $435,000 by June 2022.
640 2022: +4
Townsville
house price
2018: 0 2020: +2
320 2019: -2 2021: +3
2022: +5
Cairns house price
160 2018: -1 2020: +3
2019: 0 2021: +2
2022: +2
80 Toowoomba
house price
99 00 01 02 03 04 05 06 07 08 09 10 11 12 13 14 15 16 17 18 19 20 21 22
2018: -3 2020: +1
2019: 0 2021: +3
2022: +4
* Real house/unit prices in 2017 dollars
The QBE Australian Housing Outlook 2019–2022 2104. Queensland
outlook
Queensland and Brisbane regions
Sunshine
Coast
Moreton
Bay
Somerset
Brisbane
Redland
Ipswich
Logan Gold
5 Coast
4 Scenic Rim
Brisbane
regions
Queensland 3
2
1
Brisbane median house price annual % change Regional Queensland
Gold Coast and Sunshine Coast, and to
some extent Toowoomba, are influenced
Inner Middle Outer Median
by Brisbane’s residential market, although
house price growth in Gold Coast and
Sunshine Coast has outpaced Brisbane in
-9.6% -1.3% -3.8% -2.8% the past five years.
The northern Queensland centres of
Townsville and Cairns have seen different
residential market outcomes in recent years.
22Regional Queensland centres
1 Gold Coast
Despite the end of the Commonwealth Games and
the related boom in infrastructure projects, the local Price
economy on the Gold Coast has been buoyed by growth
growth in the tourism sector and new building projects
including the Gold Coast Airport expansion and a new
Star Casino Hotel. This has driven robust employment
growth across the city and the local unemployment rate
of 4.8% at April 2019 was well below the state average.
-3.7%
The median house price on the Gold Coast saw solid growth,
averaging 5.5% per annum over the six years to June 2018,
although house prices fell by 3.7% in 2018/19. The median unit price Vacancy
on the Gold Coast also tracked lower, down by 1.2% in 2018/19. rates
Outlook: The supply of dwellings on the Gold Coast has
spiked in recent years and although supply has eased
slightly through 2018/19, completions remain at an elevated
1.8%
level. The Gold Coast attracts significant population from
other parts of Australia and continued sizeable population
growth will ensure underlying demand remains strong. Forecast
Rental vacancy rates were tight at 1.8% in March quarter
house price
2019, though have shown recent signs of drifting upwards.
2 Toowoomba
The region has a steady supply of infrastructure projects
and the local tourism industry will continue to remain a
cost competitive holiday destination, so these economic
8.8% Toowoomba is a key logistics hub for
the agricultural centres in the Darling
drivers will maintain the momentum in growth. House
Downs. It also benefits from its location on
price growth to 2022 is expected to remain positive, albeit
the Melbourne to Brisbane freight route.
at a slower rate than the previous upturn at an average
Unemploy- The local economy is solid with the local
rate of 2.9% per annum. This will take the median house ment unemployment rate sitting at a healthy 4.8%.
price to $680,000 by June 2022. Given the greater rise
The median house price has seen sporadic
in the supply of units, unit prices are projected to show
growth in recent years, after an earlier spurt
4.8%
slower growth, averaging 0.8% per annum to take the
of growth where the median house price rose
median unit price to $435,000 over the same period.
24% in the three years to June 2015. In the
year to June 2019, house prices grew by just
0.2%, taking the median to $385,000.
Outlook: In the medium-term
the Inland Rail project will cement
Toowoomba’s position as a key
logistics hub in the region, while in
the short-term the completion of the
Second Range Crossing project will
make Toowoomba more accessible.
Outside of this, there are few key
infrastructure projects to drive the
growth outlook for Toowoomba and
the median house price is forecast
to average 2.5% growth per annum
in the three years to June 2022.
The QBE Australian Housing Outlook 2019–2022 2304. Queensland
outlook
Regional Queensland centres continued
3 Sunshine Coast
Population growth on the Sunshine Coast has continued to be strong as it benefits from
Australia’s ageing population. While also attracting a younger family demographic, the
region also sees population moving from Brisbane and the southern states in retirement.
The tourism industry on the Sunshine Coast is less developed than on the Gold Coast and
hasn’t seen the same level of growth as the Gold Coast. However, the region has benefited
economically from strong residential construction activity and several large infrastructure
projects. Slowing markets elsewhere have reduced the trade down potential to the Sunshine
Coast and this has weighed on price growth, with the median house price falling by 2.2% in
the year to June 2019.
Outlook: The Sunshine Coast has and will continue to benefit from internal
migration which will ensure a steady source of demand. House prices are
forecast to grow by a total of 7% over the three years to June 2022, taking the
median house price to $635,000.
4 Townsville
The Townsville residential market has experienced
an extended period of weakness as a result of anaemic
economic activity in the region. The decline in mining
investment coupled with cuts to defence and public
administration jobs and the lack of an economic driver
saw the unemployment rate in the region balloon to
peak at 9.4% at May 2018. The median house price of
$313,800 as at June 2019 is 19% lower than its peak in
December 2009.
However, Townsville appears to be slowly turning a corner after
a significant period of depressed economic activity. Townsville’s
vacancy rate tightened from a peak of 7.1% in 2016 to around 4%
over 2018. Subsequent cyclone activity caused flood damaged rental
properties to be temporarily removed from the market, causing the
5 Cairns vacancy rate to fall to 1.5% at March 2019, but this is likely to increase
again as these dwellings return to the market. The unemployment
Cairns hasn’t experienced the same level of economic weakness rate has also improved markedly, falling to 7.1% in May 2019. However,
compared to Townsville. Without as much exposure to the resource much of the improvement has been the result of a decline in work
sector, the city didn’t experience the same type of boom and force participation and the rate remains significantly higher than the
therefore not the same type of bust. Meanwhile tourism in the region state and national average.
has been strong in recent years, benefiting from a lower Australian
dollar. This has helped to insulate the region from the downturn in
the resources sector. Population growth has also been solid, and the Outlook: It is expected the worst is now over for the
Cairns vacancy rate has been low at 1.3% in March quarter 2019. The Townsville residential market with residential prices
median house price was flat in 2018/19, with the median house price having troughed. Without a huge amount of economic
largely unchanged since 2015. stimulus, price growth is projected to be fairly modest
until momentum in the economy builds up. The Townsville
Stadium project will contribute to the economy, while the
Outlook: While Cairns’ local industries will continue to city may benefit from recent rises in commodity prices. and
benefit from a weak dollar, there appears to be little else consequent increases in exploration and investment. The
outside tourism driving the economy. Residential price significant residential price decline also means that house
growth is forecast to be limited in the next three years with prices in Townsville are already at a low base. The median
a cumulative rise of 8% taking the median house price to house price is forecast to climb to $345,000 by June 2022,
$440,000 by June 2022. with a cumulative rise of 10% over the three years.
24Queensland regional mining centres
The median house price in Gladstone and Mackay increased
by 32% and 17% respectively during the mining investment
boom. The median house price in both regions is now below
Outlook
its level prior to this growth period, being down by 46% It’s worth noting that with the limited sales
in Gladstone and 22% in Mackay in June 2019 from its volumes in Isaac in recent quarters, residential
previous peak. price growth has been patchy, and it’s difficult
to gauge any marked recovery. Nonetheless, it’s
In contrast the Isaac region, which comprises the smaller towns of
anticipated that the Isaac region has bottomed
Dysart and Moranbah, saw a much greater upturn with a 97% rise in its
out. The median house price climbed to $181,000
median house price between December 2007 and March 2012. This
in June quarter 2019; more than 51% higher than
surge was then followed by a large decline, where the median house
the bottom of the market, but less than a third of
price fell by 82% by September 2017.
its peak price. Residential price growth has also
Gladstone has experienced a large increase in the local unemployment improved in Mackay in line with a strengthening
rate to 7.3% at March 2019. Mackay also saw a large uptick in the local economy.
unemployment rate, peaking at 8.4% in December 2015 before
In these two regions it appears that firstly an
tightening markedly to 4.4% in March 2019. This rate is also significantly
over-correction in house prices has taken place
lower than the state average. The Isaac Region, having a much higher
as owners looked to get out of the market at
proportion of residents as transient workers, saw only a 1% increase in
any price, and secondly that some speculative
the unemployment rate to 2%. The mild rise in the unemployment rate
investors are now entering this market. In contrast,
does not reflect a strong employment market, but rather the transient
with a sluggish local economy it appears the
workers leaving as jobs dry up. In comparison, Gladstone and Mackay
market in Gladstone is yet to bottom out with the
have a greater percentage of permanent residents who are less able to
median house price having fallen to $258,000 as
leave when employment prospects decline, causing the unemployment
at June 2019.
rate to rise.
Median house prices and unemployment rates
MEDIAN HOUSE PRICE ($) UNEMPLOYMENT
SALES IN PRIOR YEAR % CHANGE RATE (%)
PEAK
START OF JUNE 2019 START TO JUNE MAR MAR
REGION UPTURN PEAK TROUGH QTR TO PEAK 2019 2013 2019
Median house price ($) 335k 660k 120k 181k
Isaac Region Sales in prior year 440 659 329 189 97% -73% 1.1 1.6
(MORANBAH, DYSART)
Date Dec-07 Mar-12 Sep-17 Jun-19
Median house price ($) 365k 480k 258k 258k
Gladstone Region Sales in prior year 906 1,531 829 829 32% -46% 4.3 7.3
Date Mar-09 Dec-11 Jun-19 Jun-19
Median house price ($) 381k 446k 318k 349k
Mackay Region Sales in prior year 3,832 3,251 1,721 2,152 17% -22% 3.1 4.4
Date Sep-07 Sep-12 Sep-17 Jun-19
Median house price ($) 427k 568k 549k 549k
Greater Brisbane 33% -3% 5.7 6.2
Date Dec-08 Sep-18 Jun-19 Jun-19
2504. Western Australia
outlook
Baby steps
Minimal growth forecast
following continued challenges
after mining investment boom
26Perth house market Perth unit market
Median house prices resultant downturn in the economy caused The significant temporary population
After appearing to stabilise in 2017/18, the the unemployment rate to rise (to a peak that made up much of the mining
downturn in Perth house prices continued of 7.5% in March 2017), which in turn saw sector workforce in Perth helped
in 2018/19, with a further 3% decline in the population growth slow dramatically as to drive rental demand and growth
median house price coming through. The workers attracted by the earlier boom time in the unit market. As employment
most recent annual reduction in Perth’s economic conditions returned to their state began to fall and workers began
median house price represents the fifth or country of origin. to return home, tenant demand
successive year of house price falls, which
dried up with vacancy rates rising
New dwelling construction was also peaking
have totalled 13% between June 2014 and
and rents falling. The unit market
as population growth fell away, causing an
June 2019.
was more affected in the downturn
oversupply to develop in 2016. Both overseas
than the housing market due to the
and interstate migration are now improving
transient nature of this temporary
Demand and supply but not yet by enough to make major inroads
population and demand from this
The downturn in the Perth market has into the oversupply. In addition to the decline
segment being more likely to favour
largely been the effect of a collapse in in residential prices, rents at June 2019 are
units. Perth’s median unit price fell by
resource sector investment since 2013. The also down by 22% on their June 2014 peak.
9% in 2018/19 and has experienced
a total 20% decline since peaking
in December 2014. More recently,
Outlook the tougher lending environment
for investors is also having a greater
There are signs now that the worst is over for the Perth market. After peaking at impact on unit prices than on houses.
7.3% at June 2017, Perth’s vacancy rate improved to 2.4% in March 2019. Tenants
are perhaps being attracted by significantly more affordable rents after major rent
declines since 2014.
Outlook
The outlook for the state economy is also more positive. Rises in commodity prices
are encouraging mining investment, which should improve employment growth. The weaker demand from investors
Lower interest rates and the lower mortgage serviceability rate should also have a will continue to be felt in the unit
positive effect, although the weaker fundamentals of the Perth market, particularly market. Meanwhile, unit dwelling
Perth’s significant dwelling surplus, may dampen the upside. After a marginal completions are on track to remain
decline in 2019/20, house price growth is forecast to emerge from 2020/21 as the elevated in the short term relative to
excess dwelling stock is reduced and positive impetus returns to price growth. By historical averages. Consequently,
June 2022, the median house price is expected to reach $550,000 (6% higher than median unit price growth is forecast
June 2019 levels). to be marginally lower than that of
detached houses. After a marginal
decline in 2019/20, a limited rise
is forecast for 2020/21 before unit
Perth: dwelling prices price growth picks up to take the
median unit price to $380,000 by
($’000)
FORECAST
Percentage points (%) June 2022, or a 5% increase on June
1,280 Perth house price 2019 levels.
2018: 0 2020: -1
2019: -3 2021: +2
2022: +5
640 Perth real
house price
2018: -2 2020: -2
2019: -5 2021: 0
2022: +2
320
Perth unit price
2018: -1 2020: 0
2019: -9 2021: +1
2022: +4
160
Perth real unit price
2018: -3 2020: -2
2019: -10 2021: -1
2022: +2
80
99 00 01 02 03 04 05 06 07 08 09 10 11 12 13 14 15 16 17 18 19 20 21 22
* Real house/unit prices in 2017 dollars
The QBE Australian Housing Outlook 2019–2022 27You can also read