Qualitative analysis of visual risk communication on twitter during the Covid-19 pandemic
←
→
Page content transcription
If your browser does not render page correctly, please read the page content below
Sleigh et al. BMC Public Health    (2021) 21:810
https://doi.org/10.1186/s12889-021-10851-4

 RESEARCH                                                                                                                                          Open Access

Qualitative analysis of visual risk
communication on twitter during the
Covid-19 pandemic
Joanna Sleigh*, Julia Amann, Manuel Schneider and Effy Vayena

  Abstract
  Background: The Covid-19 pandemic is characterized by uncertainty and constant change, forcing governments
  and health authorities to ramp up risk communication efforts. Consequently, visuality and social media platforms
  like Twitter have come to play a vital role in disseminating prevention messages widely. Yet to date, only little is
  known about what characterizes visual risk communication during the Covid-19 pandemic. To address this gap in
  the literature, this study’s objective was to determine how visual risk communication was used on Twitter to
  promote the World Health Organisations (WHO) recommended preventative behaviours and how this
  communication changed over time.
  Methods: We sourced Twitter’s 500 most retweeted Covid-19 messages for each month from January–October
  2020 using Crowdbreaks. For inclusion, tweets had to have visuals, be in English, come from verified accounts, and
  contain one of the keywords ‘covid19’, ‘coronavirus’, ‘corona’, or ‘covid’. Following a retrospective approach, we
  then performed a qualitative content analysis of the 616 tweets meeting inclusion criteria.
  Results: Our results show communication dynamics changed over the course of the pandemic. At the start, most
  retweeted preventative messages came from the media and health and government institutions, but overall,
  personal accounts with many followers (51.3%) predominated, and their tweets had the highest spread (10.0%, i.e.,
  retweet count divided by followers). Messages used mostly photographs and images were found to be rich with
  information. 78.1% of Tweets contained 1–2 preventative messages, whereby ‘stay home’ and ‘wear a mask’
  frequented most. Although more tweets used health loss framing, health gain messages spread more.
  Conclusion: Our findings can inform the didactics of future crisis communication. The results underscore the value
  of engaging individuals, particularly influencers, as advocates to spread health risk messages and promote solidarity.
  Further, our findings on the visual characteristic of the most retweeted tweets highlight factors that health and
  government organisations should consider when creating visual health messages for Twitter. However, that more
  tweets used the emotive medium of photographs often combined with health loss framing raises concerns about
  persuasive tactics. More research is needed to understand the implications of framing and its impact on public
  perceptions and behaviours.
  Keywords: Twitter, Public health, Risk communication, Visuals, Pandemic, Covid-19

* Correspondence: joanna.sleigh@hest.ethz.ch
Department of Health Science and Technology, ETH, Zürich, Switzerland

                                       © The Author(s). 2021 Open Access This article is licensed under a Creative Commons Attribution 4.0 International License,
                                       which permits use, sharing, adaptation, distribution and reproduction in any medium or format, as long as you give
                                       appropriate credit to the original author(s) and the source, provide a link to the Creative Commons licence, and indicate if
                                       changes were made. The images or other third party material in this article are included in the article's Creative Commons
                                       licence, unless indicated otherwise in a credit line to the material. If material is not included in the article's Creative Commons
                                       licence and your intended use is not permitted by statutory regulation or exceeds the permitted use, you will need to obtain
                                       permission directly from the copyright holder. To view a copy of this licence, visit http://creativecommons.org/licenses/by/4.0/.
                                       The Creative Commons Public Domain Dedication waiver (http://creativecommons.org/publicdomain/zero/1.0/) applies to the
                                       data made available in this article, unless otherwise stated in a credit line to the data.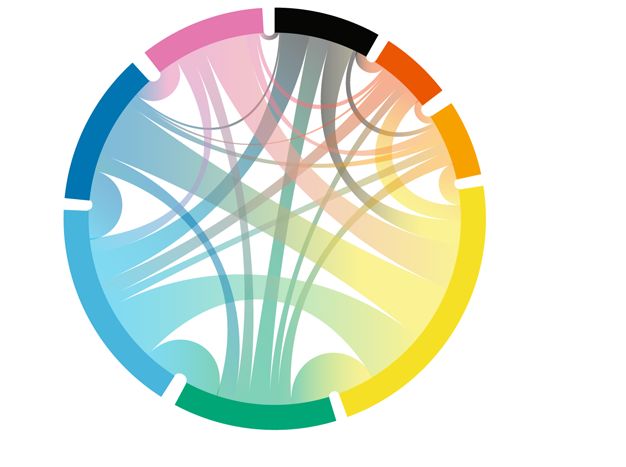
Sleigh et al. BMC Public Health   (2021) 21:810                                                               Page 2 of 12

Background                                                   in the nearly instantaneous spread of unverifiable health
The coronavirus pandemic has offered public health           information, as occurred during the Ebola and Zika
professionals a real-world case study on visual risk com-    outbreaks [12], and now during the Covid-19 pandemic
munication through social media platforms like Twitter.      [17]. Detecting health misinformation and acting to stop
In the wake of the pandemic, amid toilet-paper buying        its spread is a critical challenge for public health author-
frenzies, government-ordered city shutdowns, and re-         ities, as hazardous or misleading recommendations (like
quests from mayors that citizens stay home, visual health    drinking bleach) place individual health at risk. Content
risk messages have proliferated online. From health offi-    may also misrepresent statistics, thereby failing in truth-
cials and pop-stars co-producing YouTube videos [1, 2]       fulness, sincerity, and correctness, which can lead to
to animals explaining health measures on TikTok [3],         misunderstanding and erode trust [18, 19]. Moreover,
health risk communication has become fully submerged         such content saturation may promote dubious moral
in the image-driven, de-centralised, peer-to-peer, cross-    communication strategies, such as using shock tactics to
cultural melting pot of social media. Among the array of     attract attention or the sacrifice of privacy through the
social media platforms, Twitter has played a prominent       graphic portrayal of an individual’s story [20].
role by allowing everyone, from public officials to citi-       Despite the undeniable role of visual communication
zens, to easily share and consume visual and multimedia      on social media, to date, only little is known about the
infection prevention and control messages.                   characteristics of visual risk communication on Twitter
   In online environments, such as Twitter, visuality can    during the Covid-19 pandemic. Recognizing the import-
help to communicate health and risk messages. Graphics       ance of Twitter and visual communication in a global
(when accurate and truthful) can improve public under-       health crisis, this study investigates the characteristics of
standing of qualitative and quantitative health risk         Covid-19 risk communication visuals posted on the plat-
information [4]. In doing so, they then foster autonomy      form between January and October 2020. Focusing on
by enabling viewers to make their own health decisions       the tweets with the most retweets for each month, we
and facilitating shared-medical decisions and behaviour      follow a retrospective approach to study tweets with
change [5, 6]. Visuals can also help to engage ‘hard to      visuals that contain Covid-19 prevention messages. This
reach’ audiences, such as those with low literacy levels,    study’s overall objective was to determine how visual
thereby promoting social equity as an ethical imperative     communication was used on Twitter to promote the
of public health [7]. Moreover, visuals can prompt action    World Health Organisations (WHO) recommended
by their persuasive and emotional impact [8–10], with        preventative behaviours and how this communication
colour hues affecting an individual’s psychological react-   changed over time. To this end, we use qualitative
ance to health recommendations [11]. Ultimately, their       content analysis [21] to identify:
ability to affect viewers renders them powerful tools to
foster public adoption of health officials’ recommenda-        1. To what extent were health and government
tions [12]. When new infectious diseases break out,               organisations present amongst the most retweeted
visuals can help risk-reducing messages stand out in the          tweets;
seas of information on social media. In this way, they         2. What were the predominant graphic types and
can help reach and be understood by a majority of the             visual properties used [22];
population, promoting solidarity and reducing stigma-          3. Which Covid-19 preventative measures featured the
tisation of risk groups [13].                                     most [23];
   As one of the most used and well-established social         4. How health gain or loss framing was present and
media platforms, with a history of use during public              whether tone changed over time [24].
emergencies, natural disasters and epidemics, Twitter
holds great potential for strategic and cost-effective         By providing empirical data on these four aspects of
visual health risk communication. Not only as it allows      visual health communication, this study makes a timely
public health authorities and government agencies to         contribution to health communication and public health
reach millions of people and communities, but Twitter        research and holds important implications for practice.
also enables research, monitoring and evaluation of          Specifically, by determining whose health risk messages
health communication campaigns. However, like all            were retweeted most often and what form these took,
social media channels, along with this vast potential,       this study provides valuable insights into current practices
Twitter faces corresponding challenges and ethical           of visual risk communication on Twitter. Furthermore, it
concerns [14]. With this platform, the lay public join       pinpoints some of the potential ethical issues that different
journalists and topic experts as mass media and content      types of messages and formats raise, thereby drawing at-
producers, and with few filtering mechanisms, content        tention to the ethics of visual risk communication, a topic
goes viral at accelerated speeds [15, 16]. This can result   which has received comparatively little attention (outside
Sleigh et al. BMC Public Health (2021) 21:810 Page 3 of 12
discussions of fake news) during the ongoing Covid-19 in the coding interface through the Twitter Embed
pandemic. API. A second researcher (JA) performed an intermit-
tent reliability check on 10% of the tweets (n = 62)
Methods halfway through coding. Group discussions among
Data collection three researchers (JS, JA, MS) resolved intermittent
Data extraction coding disagreements. We then analysed how the
Using the platform Crowdbreaks,1 we sourced the tweet retweets were distributed for each theme and how
IDs of the most retweeted tweets (based on retweet theme items spread. The former provided insight as
counts at the time of request) that contained at least one to tweet engagements and interactions. For the latter,
of the keywords ‘covid19’, ‘coronavirus’, ‘corona’, and we calculated this by the tweet’s retweet number
‘covid’ [25]. The tweet objects (such as tweet text, pub- divided by the user’s followers at the time of posting.
lishing date, media URLs) were then received using the In this way, the spread took into account that the
tweet IDs from the Twitter-API. We selected the 500 number of followers impacts the total number of
most retweeted tweets with visuals per month to see retweets.
trends over time and ensure uniform distribution. The
total dataset consisted of 5031 tweets. Where no tweet Results
location was available as meta-data from Twitter, we Stakeholders / tweeters
added it manually when possible using content-based The 616 tweets analysed came from 351 verified Twitter
identification [26]. accounts. The majority of these users were individuals
(n = 209, 59.5%), meaning the personal accounts of citi-
Inclusion and exclusion criteria zens, activists, politicians, and journalists. This group
To be included in our analysis, tweets needed to a) include had the highest spread (10.0%), as indicated by Fig. 2,
a visual (image or video), b) be in English (both image and and accounted for 51.3% of tweets in our sample. The
tweet text), and c) promote a WHO recommended Covid- media (n = 90, 25.6%) accounted for 27.4% of tweets,
19 health preventative measure (as grouped in Table 1). By and health and government organisations (n = 40,
limiting our scope to the WHO publicised recommenda- 11.3%) had 16.4% of tweets. A possible explanation for
tions, as an internationally recognised authoritative source the predominance of personal accounts could be that
of Covid-19 risk communication, we sought to focus on there is a higher fraction of individuals than official or-
the main preventative measures relevant to all countries. ganisational accounts on Twitter. Simultaneously, some
We excluded tweets that did not primarily focus on pre- users authored more than one tweet in the sample (n =
ventative Covid-19 measures, or that promoted alternative, 89, 25.4%). While the user with the highest number of
non-WHO recommended preventative measures; for tweets (n = 28) was the WHO, most accounts with mul-
example, drinking bleach. Ambiguous cases were discussed tiple tweets belonged to the media (36 accounts) and in-
within the research team to determine inclusion within the dividuals (35 accounts).
final sample. Upon applying these criteria, we included 616 As Table 2 shows, each stakeholder group had a con-
tweets in our analysis. siderable number of followers (the average always in the
tens of thousands) and the total number of followers
Qualitative content analysis was much higher than the total number of users they
We performed a qualitative content analysis following themselves were following. This indicates that tweets
an iterative process [21]. Starting from a preliminary code- came mainly from established Twitter accounts who
book informed by prior research and typologies [22, 24] were ‘influencers’. However, each stakeholder group’s
and WHO guidelines [23], two researchers (JS, JA) coded average number of followers and their standard devia-
a random sample of 40 tweets not pertaining to the study tions indicate a high variability between accounts. This
sample to test and refine the codebook. The revised code- shows that not all the retweeted tweets with images in
book was then applied to a subset of 60 tweets by two re- our sample came from ‘influencers.’
searchers (JS, JA) independently to establish intercoder The tweets came from 35 different countries. The
reliability [27, 28]. The second round of coding resulted in majority of these from the USA (n = 267, ~ 43%) and
minor revisions to the codebook using review and discus- India (n = 108, ~ 17.5%). Following were the UK (n = 64,
sion. One researcher (JS) then applied the final version of ~ 10%), Switzerland (n = 32, ~ 5%), Philippines (n = 27,
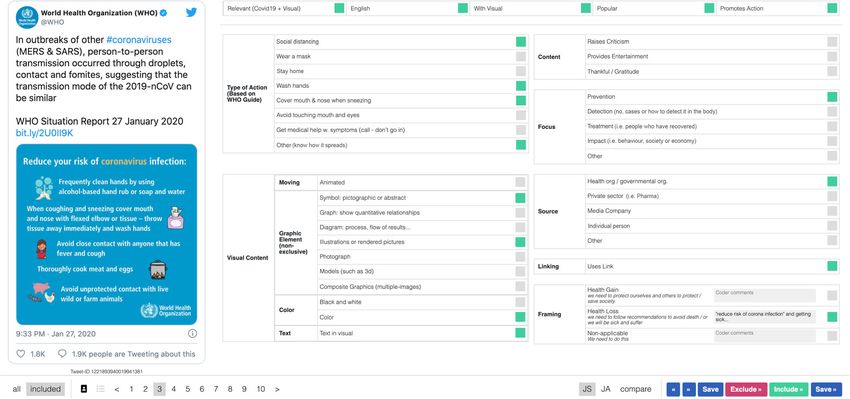
the codebook (Table 1) to the 616 tweets that met our in- ~ 4%), and China (n = 21, ~ 3%). Eleven tweets had un-
clusion criteria using a custom interface shown in Fig. 1. known locations. The fact that other English-speaking
This interface allowed us to see the original tweet directly regions, notably Australia and New Zealand, were not
represented in our sample may be because these regions
1
Crowdbreaks.org were less affected by the pandemic.Sleigh et al. BMC Public Health (2021) 21:810 Page 4 of 12
Table 1 Codebook used for qualitative analysis
Top-level Detail Example
Source Health or governmental The WHO, or Victoria Government
(Identified inductively) organisation
Private sector Pharma Company
Media CNN, ABC News
Individual person Citizen, politician, academic, or artist
Other University
Graphic Type (Saunders, 1994) Symbols A pictographic or logo
Graphs Used to show quantitative relationships
Diagrams Parts, a process, a general scheme, and/or the flow of results
Illustrations or rendered pictures Drawn pictures, realistic or abstract, including background illustrations
Photographs Still (i.e. photograph) or moving (such as gif or video)
Models Such as 3d renderings or computer models
Composite graphics Multiple images
Other Visual Attributes Colour Anything with more than white and black
Animated Video, Gif or animation
Link Link / URL A URL is in the tweet text or in the visual
Content Focus Raises criticism Government or political criticism, or criticism of someone’s behaviour
(Identified inductively)
Provides entertainment Shows something funny, or emotive
Thankful / gratitude Thanks doctors for saving patients
Covid-19 Focus Detection Relates measures to detection of cases or how it impacts the body
(Identified inductively)
Treatment Mentions people recovering
Impact Discusses impacts to behaviour, the economy, or society
Other How it spreads
Type of Action (WHO guidelines) Social distance Keeping distance with people and avoiding crowded places
Wear a mask Protecting yourself and other by wearing a mask
Stay home Working, studying or remaining at home if feeling unwell / quarantine
Wash hands Regularly and thoroughly washing hands with soap and water
Cover mouth & nose when Or using a tissue and disposing it immediately
sneezing
Avoid touching mouth and eyes Particularly with unwashed hands
Get medical help w. symptoms (but call - don’t go in)
Other Cooking meat or eggs / basic hygiene / know the symptoms / get
tested
Framing (Tversky & Kahneman, Health gain We need to protect ourselves and others to protect / save society
1992)
Health loss We need to follow measures to avoid sickness, suffering and death
Non-applicable We just need to do this
Graphic types and visual properties content cross-pollination. For example, media reposted
Identified using Saunders typology [22], most tweets from TikTok or the sharing of WHO branded videos
(55%) in our sample used a combination of two to five and content.
graphic types (see Fig. 3). This was often the case with In tweets with only one graphic type, photographs pre-
animated visuals, which accounted for 42.4% (n = 261) dominated (n = 181), while graphs (n = 17), diagrams
of all tweets. Figure 3 shows that photographs (either (n = 5), and models (n = 2) were least used. The fact that
still or moving) were frequently combined with symbols 64.4% of tweets (n = 397) included in our sample fea-
(like institutional logos) (n = 177, 44.6%), and symbols tured photographs and this graphic type had one of the
were the most combined graphic type overall. This could highest spreads (7.5%) highlights their instrumental role
also have resulted either from branded content or as a form of risk communication with great potential toSleigh et al. BMC Public Health (2021) 21:810 Page 5 of 12 Fig. 1 Custom Interface used for qualitative coding Fig. 2 The average spread per category per topic. The bar chart shows the average spread. Colour represents each topic category. The vertical lines depict the confidence intervals (0.95)
Sleigh et al. BMC Public Health (2021) 21:810 Page 6 of 12
Table 2 Per stakeholder summary of the Covid-19 tweets with image dataset
Total Total Total Average Standard Total Average Standard Total % Sample
Accounts Following Followers Followers Deviation Retweets Retweets Deviation Tweets
Followers Retweets
Health or Gov 40 33′571 69′946’927 1′748’673 3′571’745 321′076 3179 5′588 101 16.40%
Individuals 209 1′882’736 325′278’634 1′556’357 4′528’980 2′171’560 6872 25′138 316 51.30%
Media 90 182′548 447′279’154 4′969’768 9′902’178 649′205 3841 6′110 169 27.40%
Other 3 11′240 14′098’198 1′566’466 3′049’140 89′488 3729 3′961 24 3.90%
Private Sector 9 641 30′578’973 10′192’991 11′209’315 137′184 22,864 12′602 6 1.00%
Total 351 2′110’736 887′181’886 2′527’584 6′493’767 3′368’513 5468 18′614 616 100%
attract attention and be shared. Notably, although dia- present in combination with the topic of ‘detection’
grams were not frequently used (n = 21), this graphic (tweets which referred to the numbers of Covid-19 in-
type had the highest spread (7.6%). In 2.6% of tweets, no fections and how to detect the virus from symptoms).
graphic type was recorded as these tweets used screen- Our analysis further revealed that most preventative
shots or text saved in a JPG or PNG format, which did messages were communicated singularly (55.5%), whereby
not fit the coding categories [22]. The other characteris- ‘stay home’ (42.4%) and ‘wear a mask’ (33.0%) frequented
tics measured showed tweet visuals to be rich in infor- most, with the former having the highest average spread
mation: 96.9% used colour (n = 597), 68.0% (n = 419) overall (9.4%, Fig. 2). A possible explanation for this may
included text within the image, and 25.8% (n = 159) in- be the WHO’s social media #WearAMask challenge and
cluded a URL either in the image or the text. The inclu- #StayHealthyAtHome challenges. However, when com-
sion of text within the image may indicate that visuals bined (i.e., mentioning two or more preventative mea-
served to compensate for character limitations (Twitter sures), as was the case with the remaining 44.5% of the
has a limit of 280 characters per Tweet), or alternatively, tweets, the preventative measures ‘social distancing’ and
that visuals helped emphasise messages communicated ‘wash hands’ frequented more. As an example, one tweet
with text. showed citizens at wash stations which were meters apart.
The fact that 78.1% of tweets included one or two pre-
Covid-19 content over time ventative measures suggests that in our sample less may
In complementation to messages of ‘prevention’, our have been more when it comes to visual risk communica-
analysis identified the presence of other Covid-19 tion. In other words, tweets containing one or two simple
themes, specifically ‘detection’, ‘treatment’, ‘impact’ and messages may have attracted more attention and thus
‘other’. These themes’ average spread is shown in Fig. 2. more retweets, a finding which has important implications
Overall, Covid-19’s ‘impact’ (tweets communicating how for risk communication but needs further research to con-
the pandemic was impacting society) was most often firm. Figure 4 presents these results in more detail.
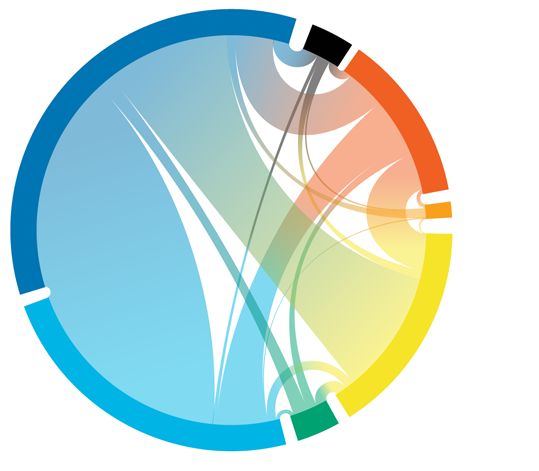
Fig. 3 Graphic types used in the most retweeted tweets. The bar chart shows how many graphic types were combined per tweet. The pie chart
illustrates how graphic types were used singularly. The chord diagram shows how graphic types were combinedSleigh et al. BMC Public Health (2021) 21:810 Page 7 of 12 Fig. 4 Covid-19 preventative measures communicated and when. The bar chart depicts the number of measures communicated per tweet. The pie chart shows the distribution of measures when communicated singularly. The chord diagram shows how preventative measures were combined. The steam graph shows which measures were communicated and when: set on a central axis, the a-axis shows time and the vertical area represents the number of tweets. Each colour represents a different preventive measure Risk framing & tone over time realisation of the limited beds in intensive care. How- Of the 616 tweets analysed from January 1 to October ever, as shown by Fig. 2, the spread of tweets with health 15, 2020, 69.6% used risk framing to communicate pre- gain messages (6.6%) along with tweets with no framing ventative measures. Meaning, they either framed mes- (9.2%) was considerably higher than the spread of tweets sages according to health loss, where the emphasis was with health loss framing (3.3%). This suggests that al- on sickness and suffering, or used health gain framing though health loss framing was more common in the that emphasised protecting and retaining good health. most retweeted tweets, those without framing or with Five percent of tweets used a combination of both. Fig- positive framing spread more. ure 5 shows that most analysed tweets (37.0%) used Then in terms of tone, 48.9% (n = 301) of tweets were health loss framing, particularly around the spikes at the coded showing critique, entertainment or gratitude, and end of January and again in August. A possible explan- 1.5% of tweets combined tones. Critical tweets were ation is that on January 30th the WHO’s Director- most common overall (n = 202, 32.8%) and appeared General officially declared Covid-19 as a public health from June onwards. These were often expressions of emergency of international concern, their highest level disagreement regarding the lack of compliance with of alarm. The stark rise in cases could have influenced preventive measures. For example, critiques of other the spike in August (as Covid-19 becomes the third lead- citizens not wearing masks or of political figures not ing cause of death in the US) and an international abiding by regulations. Another example was Indian
Sleigh et al. BMC Public Health   (2021) 21:810                                                                                    Page 8 of 12

 Fig. 5 Tone, framing and stakeholders in the most retweeted tweets. The pie graphs depict the percentage of each category. Steam graphs, as
 stacked area graphs displaced around a central axis, depict the categories present per tweet over time. Each colour represents a different
 category. The x-axis represents time, the area represents the number of tweets

students protesting against exams as preventative mea-                    Discussion
sures could not be followed, and infection could harm                     With 340 million registered users, 166 million daily active
families. In contrast, many tweets in our sample around                   users, and 500 million tweets per day [29], Twitter consti-
the first half of the year, as shown in Fig. 5, had enter-                tutes one of the world’s most widespread communication
taining tones (overall n = 68, 11.0%). These tweets                       platforms, especially in a public health crisis. Although so-
showed, for example, humorous instances of quarantine,                    cial media can help with rapid knowledge dissemination
like a couple pretending to holiday by fishing on their                   in a pandemic [30], no media is a passive vehicle for com-
television screen. Lastly, there were also thankful tweets                munication. Like on other social media platforms, where
(n = 40, 6.5%) that communicated gratitude for fellow                     concise, emotive and immersive content spreads like fire,
citizens following preventive measures. Interestingly, as                 we have seen Twitter become a “fertile ground for the
shown by Fig. 2, tweets with tones of gratitude had the                   spread of false information, particularly regarding the on-
highest average spread (13.6%).                                           going coronavirus disease” [31]. Recognising its role in
Sleigh et al. BMC Public Health   (2021) 21:810                                                                 Page 9 of 12

misinformation propagation, in March 2020, Twitter in-           strategies to ensure maximal adherence and societal
troduced warning labels for tweets containing potentially        safety [42, 43]. Indeed, prospect theory proposes that
harmful or misleading information relating to Covid-19           loss-framed messages have more success when outcomes
and linked verified information [32].                            are riskier and more uncertain (like in a pandemic with
   Nonetheless, Twitter has played a pivotal part in             high infectious rates and unclear solutions), while gain-
health risk communication during the Covid-19 health             framed messages are more persuasive when outcomes
crisis [33–35]. Various world leaders have utilised the          are clearer and more apparent [24, 44–46]. In the Twit-
platform to inform, boost morale and prompt political            tersphere, “fear for the unknown nature of the corona-
discussion [36]. Given such uptake, it is not surprising         virus” underscored most Covid-19 conversations [37].
that health measures trended in the Twittersphere                This ethical crossroads should be approached with great
[37–39]. This study documents several health risk                discretion.
measures communicated, often in combination. Most                   The study results also show that the most retweeted
frequently were the measures ‘stay home’ and ‘wear a             Covid-19 risk communication with visuals took the
mask’ — messages focused on actions at the individ-              format of photographs, often with logos and text. One
ual level. Concerning the latter, it should be noted             possible reason for this predominance of photos is that
that throughout 2020 the WHO iteratively updated                 they have evidential power by documenting reality.
their recommendations about mask wearing and even                Studies on the role of photographic images also
ran social media challenges, such as the #WearAMask              emphasise their multiple roles, including dramatizing
and #StayHealthyAtHomes challenges. These updates                experience to increase communicative impact [47]. In
and efforts could have contributed to the popularity             other words, they have emotive and rhetorical power
of this topic in the tweets analysed.                            and provide easy and quick content for viewers to di-
   Messages targeting individual agency and responsibil-         gest [48–50]. In the context of health communication,
ity for controlling health raise the ethical issue of            research shows visual aids and animated graphics
culpability [40, 41]. As Guttman explains [7], messages          positively influence attention, comprehension, recall
that appeal to personal responsibility have pervaded             and behavioural adherence [51, 52].
public health communications for decades and can have               Despite the potential of photographs in health com-
unintended adverse effects. For example, the tweets              munication, some question using their vividness and
shaming citizens for not complying by staying home or            strong emotional appeal (as common persuasive market-
wearing a mask could have prompted feelings in non-              ing tactics) to attract attention and convey information
abiders of guilt, shame or frustration. However, these in-       about risk [20]. An overtly aesthetic or dramatic ap-
dividuals may not have had a choice, needing to go work          proach can force the audience’s attention to particular
to support their family, or not being able to wear a mask        messages or content to persuade them. However, this
for health reasons.                                              may have unintended impacts. For instance, one of the
   Ethical consideration must also be given to the message       analysed tweets included a video of a conventionally
framing, specifically regarding the potential for persuasive     attractive young woman wearing tight clothing and
and paternalistic communication styles, which can create a       handing out masks to men. Although this video tailored
barrier and lead to erosion of trust. On the other hand,         to male viewers successfully drew attention to mask-
more educational approaches provide only information to          wearing, it also reinforced negative stereotypes and
enhance rational decision-making, but research shows they        societal gender/power imbalances.
are not always effective [42]. In this study, most tweets used      Still, images transcend literacy and language require-
health loss or gain framing to persuade adherence to pub-        ments and so can help promote understanding, accessi-
lic health measures. Meaning, they presented Covid-19            bility and fairness [7]. Notably, the use of images
preventative measures by emphasising their health-               alongside text is most effective, as was the case in most
protective capacities, or the negative consequences result-      tweets (68%) in this study. Indeed, combining visual and
ing from non-adherence. Out of these two, ‘health gain’          linguistic signification increases health communication
messages spread more (calculated by retweets divided by a        effectiveness [53]. Ultimately, when sensitive to ethical
user’s number of followers), but ‘health loss’ was the most      concerns, visual aids can be “among the most highly
frequent (in terms of number of tweets in our sample).           effective, transparent, fast, memorable, and ethically de-
Appeals to fear using vivid images or describing damages         sirable means of risk communication” [54].
to health echoes earlier public health campaigns, such as           Our analysis of the tweet sources also provides insight
smoking or HIV. This approach came under ethical cri-            into the role of governments and media outlets’ in
tique for causing unnecessary fear and stigmatisation [7].       sharing visual health risk communication on Twitter.
   However, a public health crisis may justify negative          Concerning the former, research has shown that a
emotional appeals or paternalistic communication                 higher intensity of government communication via social
Sleigh et al. BMC Public Health   (2021) 21:810                                                                   Page 10 of 12

media positively influences citizens’ adherence to pre-          English per month means the exclusion of other poten-
ventive measures [55]. Previous crisis-related research          tially relevant tweets. Moreover, when interpreting our
indicates that health organisations rely more often on           findings, it is important to consider that our analysis pre-
traditional media than social media when framing a               sents a snapshot of the retweet counts (as retweet and fol-
health crisis [56, 57]. In the context of Covid-19, recent       lower counts were collected at two points in time) and
research shows that the tweets of politicians generated          does not account for the potential impact of country-
the most attention, while those of celebrities attracted         specific events. As well, due to Twitter’s collection limit (a
the most engagement overall, thereby indicating the              1% threshold of the entire tweet-volume on Twitter at a
value of personal versus official communication channels         given moment) for a short period between mid-March
[58]. Our study results echo this, revealing that individ-       and mid-April the collection using Crowdbreaks was lim-
ual voices (‘influencers’ with many followers) predomi-          ited to a random subsample of all tweets of interest. How-
nated and had their tweets had the highest spread.               ever, given the volume of tweets collected the sample is
   However, health/government institutions and the media         representative and suitable to answer the research ques-
also had a significant presence but only at the start. As Fig.   tions. This approach’s strength was that it thus revealed
5 illustrates, at the onset of the pandemic, most tweets         the extent to which preventative measures appeared
came from the media (indicated by blue) and health and           amongst the tweets with the most retweets. However, by
government organisations (indicated by pink). These stake-       only including English language tweets, this study’s results
holders’ tweets then tapered out into an even distribution.      may not reflect global trends as they are biased towards
This pattern could reflect citizens’ desire for official guid-   the West. As well, duplicate images were not documented.
ance at the outset of the pandemic when everything was in        Another limitation lies in the fact that we limited our ana-
a state of uncertainty. The shift towards individual voices      lysis to tweets promoting WHO preventative behaviours;
from March onwards aligns with the stay-at-home man-             this may have led us to miss other types of preventive
dates when individual social media use generally increased       messages. However, we deemed this a reasonable strategy
[39]. The prominence of individual voices highlights the         for verifying the legitimacy and effectiveness of preventive
importance of citizens (particularly influencers) sharing        behaviours being promoted on Twitter, as was the study’s
health messages among their networks, enabling health            focus. Further, although all tweets analysed in this study
messages to reach broader segments of the population and         came from verified accounts, it was beyond this study’s
promoting solidarity and inclusiveness.                          scope to verify Tweet locations’ accuracy and to identify
   Finally, the high number of tweets with tones of critique     the potential presence of bots.
shows how Twitter, even in the context of health-risk
communication, gets used as a platform for communicat-           Conclusion
ing protest. In September and October, the spikes in crit-       To our knowledge, this study is the first to analyse the
ical tweets in our sample came from US tweets, often with        characteristics, trends, and ethics of Covid-19 visual risk
political undertones (unsurprising in the lead up to the US      communication on Twitter. This study’s results show
election), alongside Indian students protesting against          that the most retweeted WHO recommended Covid-19
exams. For the latter, authorities were allowing exams des-      health measures with visuals between January to October
pite social distancing and staying home being officially         2020 came from personal accounts. This outcome high-
recommended to prevent infections and the spread of              lights the need for health organisations and governments
Covid-19 [59]. Since the Arab Spring and Occupy Wall             to engage individuals, particularly influencers, as messen-
Street movements, Twitter has developed a reputation as          gers and advocates, for they enable health messages to
a platform for protests because it amplifies individual          reach broader segments of the population, promoting
voices, and the mass of critical tweets in this study reflects   solidarity and inclusiveness.
this. That most tweets used photographs also fits as pho-           What characterised the most retweeted tweets with
tos can help build social movements and networks [60,            visuals was that they were rich in information: commu-
61], visuals fortify propaganda during conflicts [62] and        nicating one to two preventive measures, mostly using
images can foster advocacy, as we have also seen with cli-       colour, often animated, and mostly including text and
mate change movements [63, 64]. Ultimately, this high-           URLs in the image. Further, they often used the visual
lights how critical tones about potential damages to health      format of photographs combined with symbols and
ignite activity on Twitter and that citizens play a crucial      employed either a health loss or gain framing. Although
role in information distribution.                                health gain messages spread more, the predominance of
                                                                 health loss framing combined with photographs as an
Limitations                                                      emotive form raises concerns about persuasive tactics
This study has some limitations. To start, we recognise          being used to exploit public uncertainty in the midst of a
that filtering for only the top 500 Covid-19 tweets in           pandemic. However, a public health emergency may justify
Sleigh et al. BMC Public Health (2021) 21:810 Page 11 of 12
health and government authorities using such tactics, due Consent for publication
to the need for rapid knowledge dissemination and wide- Informed consent was determined not to be required, and this was
approved by The Ethics Commission of the Swiss Federal Institute of
spread adherence to measures. Technology (ETH Zurich).
Future research is needed to evaluate the behaviour
changing efficacy of loss-framed versus gain-framed Competing interests
messages with visuals in the context of the Covid-19 The authors declare that they have no competing interests.
pandemic and across different social media platforms. Received: 31 January 2021 Accepted: 9 April 2021
Future research could also investigate the reasons why
these tweets engaged so many Twitter users, specifically
to explore if it was due to their content or rather simply References
1. Herman T. K-pop stars AleXa, Dreamcatcher & IN2IT team up with UNESCO
because of the influence and number of users followers. for 'be the future' Covid-19 song. Forbes. 2020. https://www.forbes.com/
As well, research could investigate in more detail how sites/tamarherman/2020/05/05/k-pop-stars-alexa-dreamcatcher--in2it-team-
preventative measures spread across different social up-with-unesco-for-be-the-future-covid-19-song/. Accessed 15 Jan 2021.
2. Seymat T, Gaubert J. Vietnamese COVID-19 video goes viral as prevention
media platforms and community networks. message proves popular; EuroNews. 2020. https://www.euronews.com/202
0/03/06/coronavirus-vietnamese-covid-19-video-goes-viral-as-prevention-
Abbreviations message-proves-popular. Accessed 15 Jan 2021.
WHO: The World Health Organisation; JPEG: Joint Photographic Experts 3. Paul K. 'It's corona time': TikTok helps teens cope with coronavirus
Group; PNG: Portable Network Graphics pandemic. The Guardian. 2020. https://www.theguardian.com/world/2020/
mar/12/coronavirus-outbreak-tik-tok-memes. Accessed 15 Jan 2021.
4. Shinm H. Epidemic and risk communication: an analysis of strategic and
Supplementary Information graphic characteristics of infographics [dissertation]Iowa State University;
The online version contains supplementary material available at https://doi. 2016. p. 8–9.
org/10.1186/s12889-021-10851-4. 5. Ancker JS, Senathirajah Y, Kukafka R, Starren JB. Design features of graphs in
health risk communication: a systematic review. J Am Med Inform Assoc.
2006;13(6):608–18. https://doi.org/10.1197/jamia.M2115.
Additional file 1: Tables S1, S2A-F, S3.A-C, S4.A-B, S5.A-D, S6.A-B,
6. Wakefield MA, Loken B, Hornik RC. Use of mass media campaigns to
S7.A-B, S8. Data showing: tweet locations; spread; graphic types; Covid-
change health behaviour. Lancet. 2010;376(9748):1261–71. https://doi.org/1
19 topics; Covid-19 measures and; tweet framing; tweet tones;
0.1016/S0140-6736(10)60809-4.
stakeholders.
7. Guttman N. Ethical issues in health promotion and communication
Additional file 2: Table S9. Data from qualitative coding. Twitter interventions. In: Oxford research encyclopedia of communication; 2017.
usernames and all other identifiable information has been removed. https://doi.org/10.1093/acrefore/9780190228613.013.118.
8. Joffe H. The power of visual material: persuasion, emotion and identification.
Diogenes. 2008;55(1):84–93. https://doi.org/10.1177/0392192107087919.
Acknowledgements 9. Avgerinou MD, Pettersson R. Toward a cohesive theory of visual
The authors would like to thank Martin Müller for his help sourcing the data, literacy. J Visual Literacy. 2011;30(2):1–19. https://doi.org/10.1080/23
and Shannon Hubbs for her proof-reading of the article. 796529.2011.11674687.
10. Burri RV. Visual power in action: digital images and the shaping of medical
Authors’ contributions practices. Sci Cult. 2013;22(3):367–87. https://doi.org/10.1080/09505431.2013.
JS, JA, MS, and EV participated in the conception and design of the study. JS 768223.
and JA carried out the qualitative coding, MS built the coding interface and 11. Armstrong K, Richards AS, Boyd KJ. Red-hot reactance: color cues moderate
data processing pipeline. JS drafted the manuscript with substantial revisions the freedom threatening characteristics of health PSAs. Health Commun.
by JA, MS and EV. The author(s) read and approved the final manuscript. 2019;36(6):663–70. https://doi.org/10.1080/10410236.2019.1700885.
12. Guidry JPD, Jin Y, Orr CA, Messner M, Meganck S. Ebola on Instagram and
Funding twitter: how health organizations address the health crisis in their social
No funding was received for this study. media engagement. Public Relat Rev. 2017;43(3):477–86. https://doi.org/10.1
016/j.pubrev.2017.04.009.
13. Beauchamp DE. The health of the republic: epidemics, medicine, and
Availability of data and materials moralism as challenges to democracy; 1988.
The full data that support the findings of this study are available from 14. Mheidly N, Fares J. Leveraging media and health communication strategies
Twitter, but restrictions apply to the availability of these data, which were to overcome the COVID-19 infodemic. J Public Health Policy. 2020;41:410–
used under license for the current study, and so are not publicly available. 20. https://doi.org/10.1057/s41271-020-00247-w.
Data are however available from the authors upon reasonable request and 15. Castells M. Communication power: OUP Oxford; 2013.
with permission of Twitter. The authors declare that all other data supporting 16. Chadwick A. The “social media” maneuver. Soc Media Soc. 2015;1(1):1–2.
the findings of this study, including the identifiers of the analysed tweets, are 17. Kouzy R, Abi Jaoude J, Kraitem A, El Alam M, Karam B, Adib E, et al.
available within the article and its supplementary information files (see Coronavirus goes viral: quantifying the COVID-19 misinformation epidemic
Additional files). on twitter; 2020. Cureus
18. Doan S. Misrepresenting COVID-19: lying with charts during the second
Declarations Golden age of data design. J Bus Tech Commun. 2021;35(1):73–9. https://
doi.org/10.1177/1050651920958392.
Ethics approval and consent to partcipate 19. McIntyre N, Barr C. How UK government misrepresented Covid projections -
The data used in this study is published under Twitter’s terms of service. explained. The Guardian. 2020. https://www.theguardian.com/world/2020/
Data distribution is described in the terms of services including Twitter’s nov/06/how-uk-government-misrepresented-covid-projections-lockdown-
privacy policy. Following the Swiss Federal Institute of Technology’s (ETH explained. Accessed 15 Jan 2021.
Zurich) guidelines for research integrity (RSETHZ 414) this study made use of 20. Guttman N. Public health communication interventions: values and ethical
this publicly available secondary data. The research study was approved by dilemmas. Sage; 2000.
The Ethics Commission of the Swiss Federal Institute of Technology (ETH 21. Lee JL, DeCamp M, Dredze M, Chisolm MS, Berger ZD. What are health-
Zurich) (project number: 2020-N-83). related users tweeting? A qualitative content analysis of health-related usersSleigh et al. BMC Public Health (2021) 21:810 Page 12 of 12
and their messages on twitter. J Med Internet Res. 2014;16(10):e237. https:// 44. Toll BA, O'Malley SS, Katulak NA, Wu R, Dubin JA, Latimer A, et al.
doi.org/10.2196/jmir.3765. Comparing gain-and loss-framed messages for smoking cessation with
22. Saunders A. Graphics and how they communicate. In: Moore D, Dwyer F, sustained-release bupropion: a randomized controlled trial. Psychol Addict
editors. Visual literacy: a spectrum of visual learning. Englewood Cliffs: Behav. 2007;21(4):534–44. https://doi.org/10.1037/0893-164X.21.4.534.
Educational Technology Publications; 1994. p. 183–92. 45. Ruggeri K, Alí S, Berge ML, Bertoldo G, Bjørndal LD, Cortijos-Bernabeu A,
23. Organisation WH. WHO COVID-19 transmission and protective measures et al. Replicating patterns of prospect theory for decision under risk. Nat
2020 [Available from: https://www.who.int/westernpacific/emergencies/ Hum Behav. 2020;4(6):622–33. https://doi.org/10.1038/s41562-020-0886-x.
covid-19/information/transmission-protective-measures 46. Abood DA, Coster DC, Mullis AK, Black DR. Evaluation of a “loss-framed”
24. Tversky A, Kahneman D. Advances in prospect theory: cumulative minimal intervention to increase mammography utilization among
representation of uncertainty. J Risk Uncertain. 1992;5(4):297–323. https:// medically un-and under-insured women. Cancer Detect Prev. 2002;26(5):
doi.org/10.1007/BF00122574. 394–400. https://doi.org/10.1016/S0361-090X(02)00120-4.
25. Müller MM, Salathé M. Crowdbreaks: tracking health trends using public 47. Hand M. Ubiquitous photography. Cambridge, UK and Malden: Polity; 2012.
social media data and crowdsourcing. Front Public Health. 2019;7:81. 48. McCloud S. Understanding comics: the invisible art. New York: Morrow; 1994.
https://doi.org/10.3389/fpubh.2019.00081. 49. Goldstein CS. Capturing the German eye: American visual propaganda in
26. Cheng Z, Caverlee J, Lee K. You are where you tweet: a content-based occupied Germany. Chicago: University of Chicago Press; 2009. https://doi.
approach to geo-locating twitter users. In: Proceedings of the 19th org/10.7208/chicago/9780226301716.001.0001.
ACM international conference on information and knowledge 50. Seo H, Kinsey DF. Meaning of democracy around the world: a thematic and
management; 2010. structural analysis of videos defining democracy. Vis Commun Q. 2012;19(2):
27. Hayes AF, Krippendorff K. Answering the call for a standard reliability 94–107. https://doi.org/10.1080/15551393.2012.682890.
measure for coding data. Commun Methods Meas. 2007;1(1):77–89. https:// 51. King AJ. A content analysis of visual cancer information: prevalence and use
doi.org/10.1080/19312450709336664. of photographs and illustrations in printed health materials. Health
28. Krippendorff K. Agreement and information in the reliability of coding. Commun Commun. 2015;30(7):722–31. https://doi.org/10.1080/10410236.2013.878778.
Methods Meas. 2011;5(2):93–112. https://doi.org/10.1080/19312458.2011.568376. 52. Sontag JM, Barnes SR. The visual framing of graphics when used in
29. Inc. T. 2020 Twitter announces first quarter 2020 results 2020. preventative health digital news packages: exploring the use of a narrative
30. Chan AK, Nickson C, Rudolph J, Lee A, Joynt G. Social media for rapid structure as the message infrastructure. J Visual Commun Med. 2017;40(3):
knowledge dissemination: early experience from the COVID-19 pandemic. 109–19. https://doi.org/10.1080/17453054.2017.1366824.
Anaesthesia. 2020;75(12):1579–82. https://doi.org/10.1111/anae.15057. 53. Houts PS, Doak CC, Doak LG, Loscalzo MJ. The role of pictures in improving
31. Al-Rakhami MS, Al-Amri AM. Lies kill, facts save: detecting COVID-19 health communication: a review of research on attention, comprehension,
misinformation in twitter. IEEE Access. 2020;8:155961–70. https://doi.org/1 recall, and adherence. Patient Educ Couns. 2006;61(2):173–90. https://doi.
0.1109/ACCESS.2020.3019600. org/10.1016/j.pec.2005.05.004.
32. Roy Y, Pickles N. Twitter Blog [Internet]: Twitter. 2020. Available from: 54. Garcia-Retamero R, Cokely ET. Effective communication of risks to young
https://blog.twitter.com/en_us/topics/product/2020/updating-our-approach- adults: using message framing and visual aids to increase condom use and
to-misleading-information.html STD screening. J Exp Psychol Appl. 2011;17(3):270–87. https://doi.org/10.103
33. Raamkumar AS, Tan SG, Wee HL. Measuring the outreach efforts of public 7/a0023677.
health authorities and the public response on Facebook during the COVID- 55. Al-Hasan A, Yim D, Khuntia J. Citizens’ adherence to COVID-19 mitigation
19 pandemic in early 2020: cross-country comparison. J Med Internet Res. recommendations by the government: a 3-country comparative evaluation
2020;22(5):e19334. https://doi.org/10.2196/19334. using web-based cross-sectional survey data. J Med Internet Res. 2020;22(8):
34. Liao Q, Yuan J, Dong M, Yang L, Fielding R, Lam WWT. Public e20634. https://doi.org/10.2196/20634.
engagement and government responsiveness in the communications 56. Liu BF, Kim S. How organizations framed the 2009 H1N1 pandemic via social
about COVID-19 during the early epidemic stage in China: and traditional media: implications for US health communicators. Public Relat
infodemiology study on social media data. J Med Internet Res. 2020; Rev. 2011;37(3):233–44. https://doi.org/10.1016/j.pubrev.2011.03.005.
22(5):e18796. https://doi.org/10.2196/18796. 57. Alonso-Cañadas J, Galán-Valdivieso F, Saraite-Sariene L, Caba-Pérez C.
Committed to health: key factors to improve users’ online engagement
35. Dyer J, Kolic B. Public risk perception and emotion on twitter during the
through Facebook. Int J Environ Res Public Health. 2020;17(6):1814. https://
Covid-19 pandemic. Appl Netw Sci. 2020;5(1):1–32.
doi.org/10.3390/ijerph17061814.
36. Rufai SR, Bunce C. World leaders’ usage of twitter in response to the COVID-
58. Kamiński M, Szymańska C, Nowak JK. Whose tweets on COVID-19 gain the
19 pandemic: a content analysis. J Public Health. 2020;42(3):510–6. https://
Most attention: celebrities, political, or scientific authorities? Cyberpsychol
doi.org/10.1093/pubmed/fdaa049.
Behav Soc Netw. 2021;24(2):123–8. https://doi.org/10.1089/cyber.2020.0336.
37. Xue J, Chen J, Chen C, Zheng C, Li S, Zhu T. Public discourse and sentiment
59. Roy B, Roy A. Conducting examinations in India: emergency, contention
during the COVID 19 pandemic: using latent Dirichlet allocation for topic
and challenges of students amidst covid-19 pandemic. Child Youth Serv
modeling on twitter. PLoS One. 2020;15(9):e0239441. https://doi.org/10.13
Rev. 2020;120:105768.
71/journal.pone.0239441.
60. Gaby S, Caren N. Occupy online: how cute old men and Malcolm X
38. Doogan C, Buntine W, Linger H, Brunt S. Public perceptions and attitudes
recruited 400,000 US users to OWS on Facebook. Soc Mov Stud. 2012;11(3–
toward COVID-19 nonpharmaceutical interventions across six countries: a
4):367–74. https://doi.org/10.1080/14742837.2012.708858.
topic modeling analysis of twitter data. J Med Internet Res. 2020;22(9):
61. Akdag Salah AA, Scharnhorst A, Ten Bosch O, Doorn P, Manovich L, Salah AA,
e21419. https://doi.org/10.2196/21419.
et al. Significance of visual interfaces in institutional and user-generated
39. Valdez D, Ten Thij M, Bathina K, Rutter LA, Bollen J. Social media
databases with category structures. In: Proceedings of the second international
insights into US mental health during the COVID-19 pandemic:
ACM workshop on personalized access to cultural heritage; 2012.
longitudinal analysis of twitter data. J Med Internet Res. 2020;22(12):
62. Seo H. Visual propaganda in the age of social media: an empirical analysis
e21418. https://doi.org/10.2196/21418.
of twitter images during the 2012 Israeli–Hamas conflict. Vis Commun Q.
40. Guttman N, Ressler WH. On being responsible: ethical issues in appeals to
2014;21(3):150–61. https://doi.org/10.1080/15551393.2014.955501.
personal responsibility in health campaigns. J Health Commun. 2001;6(2):
63. Hopke JE, Hestres LE. Visualizing the Paris climate talks on twitter: media
117–36. https://doi.org/10.1080/10810730116864.
and climate stakeholder visual social media during COP21. Soc Media Soc.
41. Coleman R, Hatley ML. Ethical health communication: a content analysis of 2018;4(3):1–15. https://doi.org/10.1177/2056305118782687.
predominant frames and primes in public service announcements. J Mass 64. Lehman B, Thompson J, Davis S, Carlson JM. Affective images of climate
Media Ethics. 2014;29(2):91–107. https://doi.org/10.1080/08900523.2014.893773. change. Front Psychol. 2019;10:960. https://doi.org/10.3389/fpsyg.2019.00960.
42. Bester JC. Vaccine refusal and trust: the trouble with coercion and
education and suggestions for a cure. J Bioethical Inquiry. 2015;12(4):555–9.
https://doi.org/10.1007/s11673-015-9673-1. Publisher’s Note
43. Resnik DB. Ethical dilemmas in communicating medical information to the Springer Nature remains neutral with regard to jurisdictional claims in
public. Health Policy. 2001;55(2):129–49. https://doi.org/10.1016/S0168-851 published maps and institutional affiliations.
0(00)00121-4.You can also read