Quantification of methane sources in the Athabasca Oil Sands Region of Alberta by aircraft mass balance
←
→
Page content transcription
If your browser does not render page correctly, please read the page content below
Atmos. Chem. Phys., 18, 7361–7378, 2018
https://doi.org/10.5194/acp-18-7361-2018
© Author(s) 2018. This work is distributed under
the Creative Commons Attribution 4.0 License.

Quantification of methane sources in the Athabasca Oil Sands
Region of Alberta by aircraft mass balance
Sabour Baray1 , Andrea Darlington2 , Mark Gordon3 , Katherine L. Hayden2 , Amy Leithead2 , Shao-Meng Li2 ,
Peter S. K. Liu2 , Richard L. Mittermeier2 , Samar G. Moussa2 , Jason O’Brien2 , Ralph Staebler2 , Mengistu Wolde4 ,
Doug Worthy5 , and Robert McLaren1
1 Centre for Atmospheric Chemistry, York University, Toronto, Canada
2 Air Quality Research Division, Environment and Climate Change Canada, Toronto, Canada
3 Earth and Space Science and Engineering, York University, Toronto, Canada
4 National Research Council of Canada, Ottawa, Canada
5 Climate Research Division, Environment and Climate Change Canada, Toronto, Canada

Correspondence: Robert McLaren (rmclaren@yorku.ca) and Katherine L. Hayden (katherine.hayden@canada.ca)

Received: 5 October 2017 – Discussion started: 1 November 2017
Revised: 7 April 2018 – Accepted: 27 April 2018 – Published: 28 May 2018

Abstract. Aircraft-based measurements of methane (CH4 )         rate from all facilities in the AOSR is 48 ± 8 % higher than
and other air pollutants in the Athabasca Oil Sands Region      that extracted for 2013 from the Canadian Greenhouse Gas
(AOSR) were made during a summer intensive field cam-           Reporting Program, a legislated facility-reported emissions
paign between 13 August and 7 September 2013 in support of      inventory, converted to hourly units. The measured emissions
the Joint Canada–Alberta Implementation Plan for Oil Sands      correspond to an emissions rate of 0.17 ± 0.01 Tg CH4 yr−1
Monitoring. Chemical signatures were used to identify CH4       if the emissions are assumed as temporally constant, which
sources from tailings ponds (BTEX VOCs), open pit surface       is an uncertain assumption. The emission rates reported here
mines (NOy and rBC) and elevated plumes from bitumen            are relevant for the summer season. In the future, effort
upgrading facilities (SO2 and NOy ). Emission rates of CH4      should be devoted to measurements in different seasons to
were determined for the five primary surface mining facili-     further our understanding of the seasonal parameters impact-
ties in the region using two mass-balance methods. Emission     ing fugitive emissions of CH4 and to allow for better esti-
rates from source categories within each facility were esti-    mates of annual emissions and year-to-year variability.
mated when plumes from the sources were spatially separa-
ble. Tailings ponds accounted for 45 % of total CH4 emis-
sions measured from the major surface mining facilities in
the region, while emissions from operations in the open pit     1   Introduction
mines accounted for ∼ 50 %. The average open pit surface
mining emission rates ranged from 1.2 to 2.8 t of CH4 h−1       Methane (CH4 ) is a significant greenhouse gas (GHG), sec-
for different facilities in the AOSR. Amongst the 19 tailings   ond in rank to carbon dioxide (CO2 ) in terms of its di-
ponds, Mildred Lake Settling Basin, the oldest pond in the      rect radiative forcing (Montzka et al., 2011; IPCC, 2013).
region, was found to be responsible for the majority of tail-   Controlling emissions of CH4 is an attractive climate con-
ings ponds emissions of CH4 (> 70 %). The sum of mea-           trol strategy because of its shorter atmospheric lifetime (τ ∼
sured emission rates of CH4 from the five major facilities,     9 years) and larger global warming potential (GWP) com-
19.2 ± 1.1 t CH4 h−1 , was similar to a single mass-balance     pared to CO2 (IPCC, 2013). Emissions of CH4 include bio-
determination of CH4 from all major sources in the AOSR         genic (animal husbandry, landfills, wetlands, agriculture),
determined from a single flight downwind of the facilities,     pyrogenic (biomass burning) and thermogenic sources (fossil
23.7 ± 3.7 t CH4 h−1 . The measured hourly CH4 emission         fuel reservoirs). The most important sink of CH4 is reaction
                                                                with the hydroxyl radical (OH) in the troposphere (Vaghjiani

Published by Copernicus Publications on behalf of the European Geosciences Union.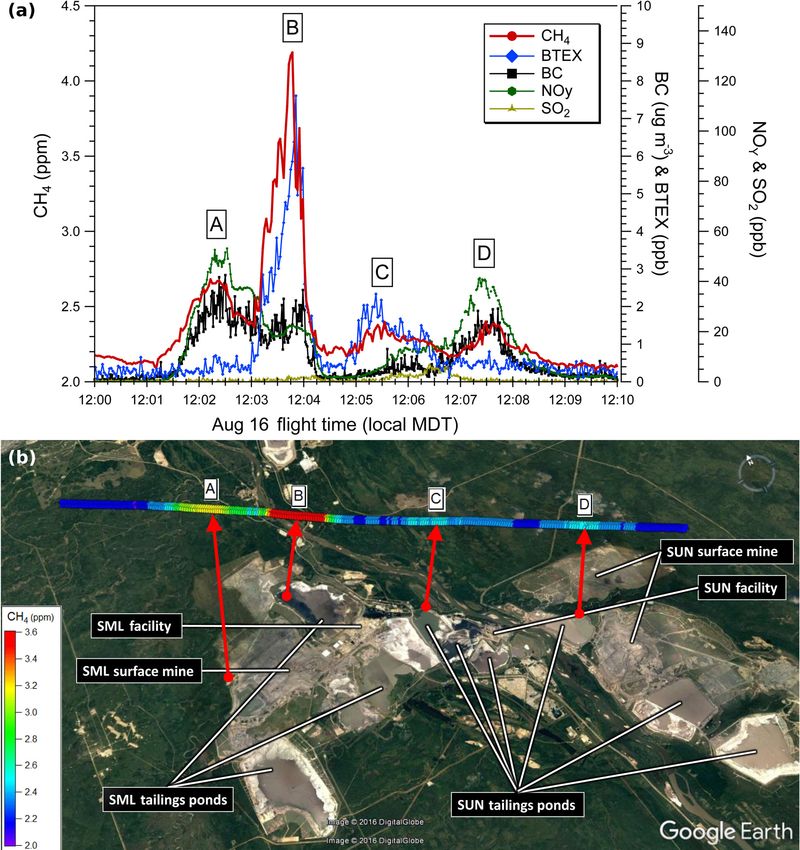
7362                                S. Baray et al.: Quantification of methane sources in the Athabasca Oil Sands Region

and Ravishankara, 1991), which produces formaldehyde              et al., 2013, 2015, 2016; Lavoie et al., 2015). Other studies
(HCHO) that is subsequently photolyzed or oxidized to yield       have used top-down satellite measurements to quantify the
CO and eventually CO2 . In addition to climate implications,      emission of CH4 in oil and gas regions (Schneising et al.,
CH4 also has air quality implications through its role in NOx -   2014; Kort et al., 2014). As such, top-down measurements of
catalyzed ozone formation in the troposphere, especially in       methane emissions and comparison with bottom-up invento-
areas with large sources of CH4 . Of recent interest are win-     ries can make a significant contribution to our understanding
tertime rapid ozone formation events (OFEs) seen in regions       of the sources of CH4 .
of intense oil and gas extraction (Pinto, 2009; Schnell et al.,      In this study we quantify total emission rates of CH4 from
2009) that are associated with snow coverage (Edwards et          facilities in the Athabasca Oil Sands Region (AOSR) of Al-
al., 2013), shallow boundary layers (Schnell et al., 2016),       berta in the summer of 2013. Alberta has large deposits of
high levels of ozone precursors and enhanced photolysis of        oil sands, an unconventional viscous mixture of bitumen,
HCHO and other carbonyls under radical-limited conditions         sand, silt, clay, water and trapped gases (Stringham, 2012).
(Edwards et al., 2014).                                           Canada has proven reserves of 1.69 × 10¹¹ barrels of oil
   The growth of the atmospheric burden of CH4 increased in       (2.7 × 10¹³ L), the third largest in the world, 97 % of which
the post-industrial revolution, slowed in the 1980s and 1990s     are located in the oil sands (Orbach, 2012). Approximately
(Worthy et al., 2009) and paused between 1990 and 2007,           82 % of the oil sands are located in the AOSR north of Fort
but has increased again starting in 2007, with an atmospheric     McMurray with 20 % located in near-surface deposits (depth
growth rate of ∼ 0.4 % yr−1 from 2007–2014 in the North-          < 100 m) that can be mined using open pit techniques and the
ern Hemisphere (Hausmann et al., 2016). Satellite observa-        remainder located in deeper deposits requiring underground
tions have suggested a 30 % increase in CH4 emissions in          in situ extraction. In both cases the oil must be separated from
the USA during 2002–2014 (Turner et al., 2016). The 2009–         sand, requiring the use of hot water or steam froth treatment,
2014 trend in CH4 mixing ratios and tropospheric columns          and organic solvent diluents (naphtha or paraffin) are used
of ethane was attributed to oil and gas production in the USA     to help separate water and solids and/or to decrease the bitu-
(Helmig et al., 2016) and recent increases in tropospheric        men viscosity. For surface mining processes, once the bitu-
columns of ethane and methane have suggested the global oil       men is separated, process water containing unrecovered or-
and gas sector to be partially responsible (Hausmann et al.,      ganic diluents is recycled but some is discharged in large
2016). Contrasting this, a recent study suggests that North       tailings ponds open to the atmosphere for further remedi-
American CH4 emissions have been flat from 2000–2012              ation. Oil extraction in the AOSR is unique in that unlike
(Bruhwiler et al., 2017) and there is still ambiguity in the      other oil and gas regions, CH4 is not the primary economic
source versus sink role for the recent increase in atmospheric    commodity being extracted, but is an unintended by-product.
CH4 (Turner et al., 2017). The above uncertainties underline      In particular, a significant fraction of the CH4 is not associ-
a need for better quantification of anthropogenic emissions       ated with fossil fuel reserves, but is emitted from the tailings
of CH4 to the atmosphere and motivate the current study.          ponds (Small et al., 2015). The factors giving rise to the re-
   Emission inventories can quantify the contributions of spe-    lease of CH4 from these ponds are complex but include the
cific sources to the atmosphere. However, bottom-up inven-        organic and inorganic chemical composition of the ponds,
tories benefit from top-down measurements and validation          the diversity and types of microbial communities, especially
(Fujita et al., 1992) due to the difficulty in identifying all    methanogens, and the age of the ponds. It is reported that
possible points of emission and quantifying all emissions in      it took 20 and 15 years for the largest ponds at Syncrude
a large complex source (e.g., a city or a facility). Top-down     and Suncor, respectively, to show evidence of methane bub-
measurements of various types have long been used in the          bling from the surface (Small et al., 2015). Additional fugi-
validation of emission inventories and emission models in-        tive CH4 is associated with the gaseous component of the
cluding comparison of surface-based pollutant profiles and        oil sand along with other gases (Strausz and Elizabeth, 2003;
ratios (Fujita et al., 1992, 1995; Jiang et al., 1997), source-   Johnson et al., 2016) that are released during overburden re-
receptor methods (Scheff and Wadden, 1993; Fujita et al.,         moval, open pit mining and/or subsequent processing.
1995; McLaren et al., 1996), aircraft-based flux measure-            In the summer of 2013, an intensive ambient air measure-
ments (Mays et al., 2009), measurement–modeling hybrid            ment campaign took place in the AOSR with both ground
methods (Allen et al., 2004; Shephard et al., 2015) and satel-    and airborne components in support of the Joint Oil Sands
lite measurements (McLinden et al., 2012, 2014; Turner et         Monitoring (JOSM) Plan (JOSM, 2012). The airborne mea-
al., 2016; Kort et al., 2014; Jacob et al., 2016). Multiple       surements were conducted to address four objectives: (i) to
studies have suggested the underestimation of CH4 emis-           measure and quantify air emissions from the oil sands mining
sions from natural gas infrastructure (Brandt et al., 2014;       facilities, (ii) to study the downwind physical and chemical
Hendrick et al., 2016). Several recent aircraft studies using     transformation of pollutants emitted, (iii) to provide spatio-
mass-balance approaches have quantified CH4 emissions in          temporal measurements of pollutants suitable for intercom-
oil and gas regions and compared these to inventory emission      parison with simultaneous satellite nadir overpasses in the
rates and/or leakage rates (Karion et al., 2013, 2015; Peischl    region, and (iv) to support air quality model prediction ca-

Atmos. Chem. Phys., 18, 7361–7378, 2018                                            www.atmos-chem-phys.net/18/7361/2018/
S. Baray et al.: Quantification of methane sources in the Athabasca Oil Sands Region                                        7363

pabilities. In this paper, we report CH4 emissions from in-       entific model 43i-TLE) with a detection limit of 0.7 ppb (1 s).
dustrial facilities in the AOSR based on the airborne cam-        Ambient air was drawn in through filtered 6.35 mm (1/400 ) di-
paign. We applied the top-down emission rate retrieval al-        ameter PFA tubing taken from a rear-facing inlet located on
gorithm (TERRA) mass-balance approach (Gordon et al.,             the roof toward the rear of the aircraft. Measurements of NO,
2015) to determine total CH4 emissions rates from each of         NO2 , NOy and SO2 were made downstream of a constant
the major industrial facilities and a second mass-balance ap-     pressure inlet system maintained at 770 mmHg with a total
proach using downwind flight tracks to spatially separate         flow rate of 5 L min−1 . In-flight zero and background deter-
CH4 emissions from different sources in each facility. Emis-      minations were made several times throughout each flight
sions rates of CH4 are determined for the five major facilities   and the analyzers were calibrated multiple times during the
in the region: Syncrude Mildred Lake (SML), Suncor Energy         study against National Institute and Standards Technology
OSG (SUN), Canadian Natural Resources Limited Horizon             (NIST) certified reference gases.
(CNRL), Shell Albian Muskeg River and Jackpine (SAJ) and             Refractory black carbon mass (rBC) was measured with
Syncrude Aurora (SAU). These results are the first source-        a Droplet Measurement Technologies (DMT) single-particle
attributed emissions estimates for the facilities in the AOSR     soot photometer (SP2). Ambient air was subsampled from
obtained by identifying and characterizing plume origins ac-      the main aerosol flow that was brought into the main cabin
cording to the signatures of chemical tracer species.             with a forward-facing shrouded diffuser isokinetic aerosol in-
                                                                  let (Cheng et al., 2018). Benzene, toluene, ethylbenzene and
                                                                  xylenes (BTEX) were measured by a proton transfer reaction
2     Experimental design                                         time-of-flight mass spectrometer (PTRMS) from the main
                                                                  gas inlet. Further technical details are provided elsewhere
2.1    Instrumentation                                            (Li et al., 2017). The delay time of each instrument was de-
                                                                  termined experimentally and through calculations based on
An array of instruments for the measurement of trace gases,       sample flow rates and inlet volumes. Total delays are con-
aerosols, meteorological and aircraft state parameters were       tributed to by the response time of the instruments (1–3 s)
installed aboard the National Research Council of Canada          and the volume of sampling tubing. Data were adjusted to
Convair 580 research aircraft. Measurements of CH4 , CO2 ,        account for the total delay times of 2–6 s to spatially and tem-
CO and H2 O were made using a cavity ring-down spec-              porally synchronize the different measurements (Picarro de-
trometer (Picarro G2401-m) at an interpolated rate of ap-         lay time 6 s). The average speed of the aircraft was 90 m s−1
proximately 0.5 Hz with a flow rate of ∼ 435 sccm min−1 .         during the research flights, thus providing a spatial resolution
The precision of the CH4 measurement was 2 ppb, and the           of 90–270 m based upon the internal response time of each
uncertainty of the measurement at background (∼ 1.9 ppm)          measurement.
was 3.3 ppb (at 2 s). The instrument was calibrated six times
before, during and after the project using two standard ref-      2.2   Aircraft flights
erence gases traceable to NOAA GMD standards. Methane
mixing ratios are reported throughout as dry mole fractions       In total, there were 22 flights with 84 hours of measurements
in the paper. Necessary parameters for emissions estima-          in the AOSR between 13 August and 7 September 2013.
tion included temperature (T ) measured a using Rosemount         The flights were designed for three purposes: measurement
probe, dew-point temperature (Td ) measured with an Ed-           of pollutant emissions from facilities (Gordon et al., 2015; Li
getech hygrometer and pressure (P ) measured with a Digi-         et al., 2017), measurement of pollutant transformation down-
quartz sensor. The three-component wind speed (Ux , Uy , Uz )     wind of the AOSR (Liggio et al., 2016) and comparison with
was derived from a Rosemount 858 probe, GPS and Hon-              satellite overpasses (Shephard et al., 2015). A total of 13
eywell HG1700 inertial measurement unit. The uncertain-           flights were dedicated to quantifying facility emissions with
ties of horizontal and vertical winds on the aircraft are 0.6     a minimum of two flights for each of the SML, SUN, CNRL,
and 0.4 m s−1 , respectively (Williams and Marcotte, 2000).       SAJ and SAU facilities. CH4 above background was not de-
Geospatial information (latitude, longitude, ellipsoid height     tected during the 2013 flights targeting the Imperial Kearl
altitude) was measured by GPS.                                    Lake (IKL) facility, which was not in full production mode
   Nitrogen oxides (NO, NO2 and NOy ) were measured with          at the time (but has since expanded significantly), or from the
a modified trace level chemiluminescent analyzer (Thermo          Suncor Firebag in situ operation. We did detect CH4 above
Scientific model 42i-TL). A molybdenum converter (325 ◦ C)        background suspected to originate from the Suncor MacKay
was used to convert NOy species to NO and an NO2 -specific        River operation (west of SML). We were not able to quantify
converter (Droplet Measurement Technologies) was used to          this source separately; however, emissions from this source
convert NO2 to NO. Detection limits for NO, NO2 and NOy           are included in one measurement of the total emissions from
were determined to be 0.08 ppb (1 s), 0.20 ppb (2 s) and          all mining facilities in the AOSR using a wide downwind
0.09 ppb (1 s), respectively. Sulfur dioxide (SO2 ) was mea-      screen (see Sect. 3.4 and Fig. 7). Several other flights are
sured with a pulsed UV fluorescence analyzer (Thermo Sci-         not included in the analysis due to unfavorable meteorologi-

www.atmos-chem-phys.net/18/7361/2018/                                              Atmos. Chem. Phys., 18, 7361–7378, 2018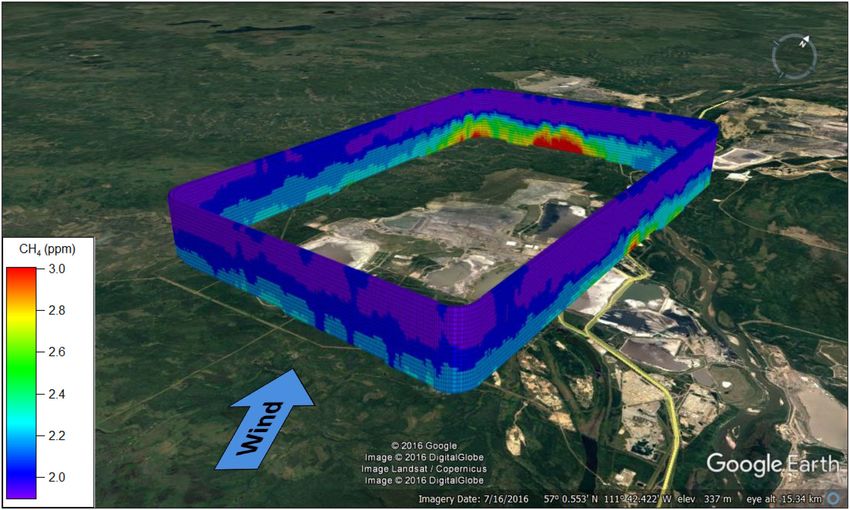
7364                                  S. Baray et al.: Quantification of methane sources in the Athabasca Oil Sands Region

Figure 1. Flight tracks from flights capturing emissions from SML (14 and 16 August), SUN (16 and 29 August), CNRL (20 August,
2 September), SAJ (21 August, 6 September not shown) and SAU (29 August, 6 September not shown). SML and SAU are shown in blue,
SUN in pink, CNRL in yellow and SAJ in dark orange.

cal conditions, including wind shear problems or insufficient       cal profiles designed to determine the height of the planetary
numbers of transects. In total, seven flights were found to         boundary layer (PBL) and to compare with ground-based
be suitable for identifying and quantifying emissions of CH4        measurements.
from the facilities. Figure 1 displays several of the flight
tracks over and downwind of the target facilities north of the      2.3   Mass-balance approaches for determining CH4
Fort McMurray airport.                                                    emissions
   The flight patterns designed for the quantification of emis-
sions rates were of two types: (i) screen flights, wherein the      Following the TERRA methodology (Gordon et al., 2015),
aircraft flew transects perpendicular to the plume downwind         the time-resolved measurements were interpolated using co-
of one or more facilities, and (ii) box flights, wherein the air-   variance kriging to produce a 40 m (horizontal, s) by 20 m
craft flew transects at multiple heights around a single target     (vertical, z) contiguous screen of CH4 mixing ratios. Within
facility in a box-type pattern (Gordon et al., 2015; Li et al.,     TERRA, the CH4 mixing ratios are extrapolated from the
2017). The transects were performed at heights from 150 to          lowest transect (∼ 150 m a.g.l.) to the surface using a con-
1370 m above ground level (a.g.l.), complemented by verti-          stant, linear or half-Gaussian extrapolation depending on the
                                                                    type of source and the boundary layer conditions at the time.

Atmos. Chem. Phys., 18, 7361–7378, 2018                                              www.atmos-chem-phys.net/18/7361/2018/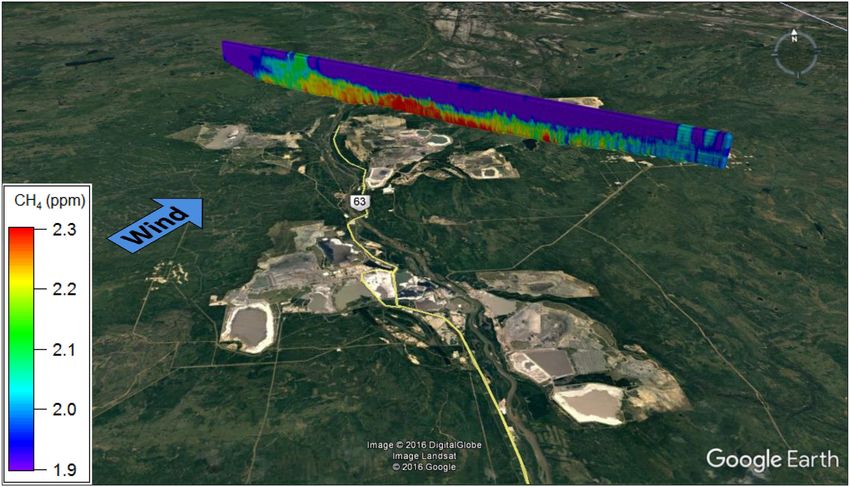
S. Baray et al.: Quantification of methane sources in the Athabasca Oil Sands Region                                           7365

Uncertainty estimates (see section in the Supplement) are in-       (background) and outgoing (background + source) fluxes are
cluded according to the various types of surface extrapolation      determined as a part of the horizontal flux terms (ECH and
applied. Interpolated matrices were constructed for measure-        ECHT ). Vertical fluxes through the box top, normally ignored
ments of air pressure (Pair ) and temperature (Tair ) in order to   in the conventional mass-balance approaches (Eq. 1), are es-
determine the air mass balance within the box and to con-           timated according to the conservation of air mass within the
vert mixing ratios to mass densities. Spatially equivalent in-      box volume and the mixing ratio at the top edge of the box.
terpolations of wind velocity perpendicular to aircraft motion      ECM is estimated according to the time derivative of the ideal
(U> ) were created from the vector components of wind speed         gas law based on measured changes in pressure and temper-
and direction measurements.                                         ature over the flight time (see Gordon et al., 2015, for a full
   Emissions rates were determined according to the two dif-        discussion).
ferent mass-balance approaches for screen and/or box flight            The advantage of the box approach (Eq. 2) over the screen
patterns. Horizontal tracks at multiple altitudes flown per-        approach is a more precise estimate of total emissions by ac-
pendicular to the general wind direction produce a virtual          counting for incoming and outgoing fluxes and meteorologi-
screen downwind of the target that is intercepted by emission       cal effects within a volume. However, this flight pattern takes
plumes from the facilities. Fluxes of CH4 moving through            more time to completely surround a target facility. The ad-
each 40 × 20 m (s × z) pixel can be determined from the in-         vantage of the screen approach (Eq. 1) is the computation of
terpolated matrices and integrated for a dimensional s by z         CH4 fluxes per pixel, which can thus be used to spatially in-
target area according to Eq. (1):                                   tegrate individual emission plumes of arbitrary shapes when
            sn ,zt
                                                                    the sources can be spatially resolved. Studies applying air-
                                                                    craft mass-balance methods have used single-height transect
            ZZ
EScreen =            ([CH4 ] − [CH4 ]B ) × U> dsdz,          (1)    (Karion et al., 2013; Peischl et al., 2016), single screens
            s1 ,zb                                                  (Cambaliza et al., 2014; Walter et al., 2012), spiral (Wratt
                                                                    et al., 2001; Gatti et al., 2014) and full box flight paths (Gor-
where ([CH4 ]−[CH4 ]B ) is the enhanced mixing ratio of CH4
                                                                    don et al., 2015) for the purpose of determining emissions
above background, U> is the horizontal wind velocity per-
                                                                    rates and characterizing meteorological conditions. The air-
pendicular to the screen (e.g., U × sin θ , θ = angle between
                                                                    craft flights presented contained various segments of tracks
wind vector and airplane vector), s1 and sn are the horizon-
                                                                    that allowed applications of all the above methods. In this
tal integration limits along the screen transect, and zb and
                                                                    work we apply a systematic approach deriving information
zt are the bottom and top vertical integration limits. Back-
                                                                    from each of these techniques for a comprehensive top-down
ground mixing ratios of CH4 were determined from the out-
                                                                    characterization of CH4 sources and emissions in the region.
side edges of the screens away from plume sources. Because
                                                                    Single-height transects are used to determine source chem-
[CH4 ]B varies with height, a vertically variant background
                                                                    ical signatures by identifying CH4 enhancements and their
profile was subtracted from each vertical measurement col-
                                                                    associations with other trace gas species. Vertical profiles are
umn, an approach used in other mass-balance determinations
                                                                    used to determine the PBL height throughout flights. Single
(Cambaliza et al., 2014; Karion et al., 2013). Example verti-
                                                                    screens are used to determine CH4 emissions rates (Eq. 1)
cal profiles of [CH4 ]B (z) for each day are included in Fig. S1
                                                                    for facilities and their individual sources when plumes are
in the Supplement. The simple mass-balance approach rep-
                                                                    spatially resolved. Box flights are used to determine total
resented by Eq. (1) can be applied to individual downwind
                                                                    CH4 emissions from facilities at a lower uncertainty (Eq. 2)
screens from other flight paths (i.e., box flights) to determine
                                                                    and source-specific emissions are determined where possible
CH4 emissions from specific sources within a facility.
                                                                    (Eq. 1).
   The second mass-balance method used in this paper is to
                                                                       The summertime emission rates measured in this study are
apply the full box-model TERRA (Gordon et al., 2015) to
                                                                    reported in units of tonnes of CH4 per hour, an appropriate
compute total emissions from all sources within a box, which
                                                                    unit given the duration of the flights (i.e., a few hours). We
is made up of multiple (4–6) screens forming a polygon en-
                                                                    do not attempt to derive annual emissions as the assumptions
compassing a facility. This more rigorous mass-balance ap-
                                                                    needed to do so are highly uncertain without measurements
proach used for calculating total emissions from a facility is
                                                                    in other seasons for a volatile species such as CH4 . However,
represented by Eq. (2):
                                                                    we do make a first-order comparison to emission inventories
EBox = ECH + ECHT + ECV + ECVT + ECM ,                       (2)    and other studies that report emissions on an annual basis by
                                                                    downscaling the annual emissions to hourly emission rates
where EBox , the total emissions rate from all sources within       using an assumption of a constant temporal factor through-
a box, is the sum of the horizontal advective and turbu-            out the entire year. This is appropriate for emission inven-
lent fluxes (ECH and ECHT ), vertical advective and turbulent       tories that are based upon the measurement of emissions or
fluxes (ECV and ECVT ), and the change in CH4 mass within           emission factors in summer that then upscale their emission
the box volume (ECM ). Because the box includes screens             rates of CH4 to annual emissions using a constant temporal
that are downwind, upwind and lateral to sources, incoming          factor assumption (e.g., GOA, 2014). However, the assump-

www.atmos-chem-phys.net/18/7361/2018/                                                Atmos. Chem. Phys., 18, 7361–7378, 2018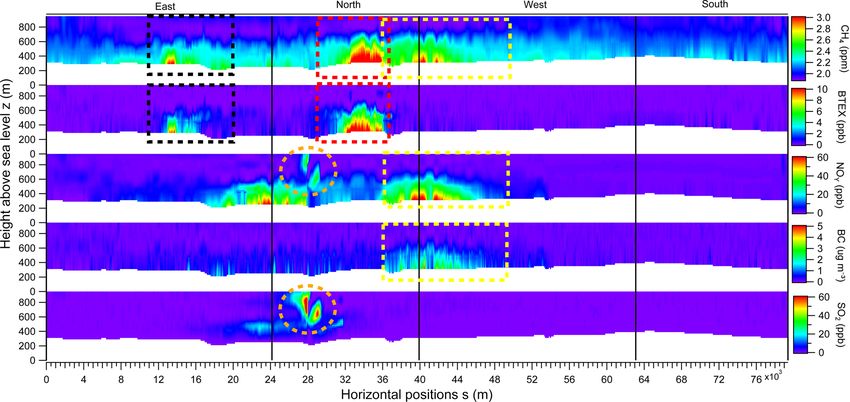
7366                                 S. Baray et al.: Quantification of methane sources in the Athabasca Oil Sands Region

tion of a constant temporal factor is far from being validated     wind directions were from ∼ 140–180◦ (SE) compared to the
and further measurements in different months are needed to         flight level winds, ∼ 220◦ (SW). The low-level surface winds
understand the potential for seasonal variability of fugitive      are likely channeled by the river valley, which runs in a SE to
emissions of CH4 .                                                 NW direction. Thus, the trajectories of air masses originating
   Previous work shows that the box approach has a demon-          at the surface and mixing upwards have a clockwise rotation,
strated uncertainty of 25–27 % for total emissions of CH4          a very local effect, placing the actual plume sources further
from a facility in the AOSR (Gordon et al., 2015). Uncer-          east than the linear tracks show in Fig. 2. Plume A shows
tainty due to the extrapolation of CH4 mixing ratios from the      a maximum mixing ratio of 2.68 ppm CH4 , which is an en-
lowest height measurements to the surface was estimated to         hancement of ∼ 0.58 ppm above a background of ∼ 2.1 ppm
be 15 and 26 % in that study. In contrast, screen approaches       on this day in this region. This enhanced CH4 is associated
used in other studies have estimated uncertainty in the range      with values of 2.3 µg m3 rBC and 47 ppb NOy . The simple
of 30–50 % (Cambaliza et al., 2014) with the main sources          linear wind back trajectory places the origin of the air mass
of error attributed to the reliability of plume characteriza-      near the western edge of open pit surface mining activity
tion and the stability of meteorological conditions. In this       ∼ 100 min earlier, although as mentioned the actual source
study, uncertainties in both the box and screen estimates are      is likely slightly east of that location due to the clockwise
reduced through (i) a high number of transects over a wide         rotation of the plumes. The combination of rBC and NOy
vertical range to accurately characterize vertical structure in    is indicative of exhaust from heavy hauler diesel trucks that
the PBL, (ii) reliable measurements of background CH4 (or          operate in open pit mines. However, significant CH4 emis-
incoming fluxes for boxes), (iii) measurements of the PBL          sions are not expected from the truck exhaust, as emissions
height to account for meteorological variance and (iv) mea-        factors of CH4 from off-road gasoline and diesel combus-
surements within time periods of minimal PBL change. In            tion indicate that the CH4 / CO2 emission ratio would be 1
addition, the enhancement of CH4 in the plumes downwind            to 2 orders of magnitude lower (Environment Canada, 2015)
of the facilities and the high precision of the Picarro instru-    than the 1CH4 / 1CO2 observed in this plume (0.58 ppm
ment minimize uncertainties in plume characterization and          CH4 / 16.1 ppm CO2 ). The disturbance of the oil sands at the
background CH4 . The overall uncertainty for computed CH4          mine faces by the trucks is a well-known source of CH4 with
emission rates for an individual determination was estimated       minor emissions of CO2 and other VOCs (Strausz and Eliz-
to be less than 30 % (see the Supplement for a complete eval-      abeth, 2003) as well as intermediate volatility organic com-
uation and discussion of uncertainties).                           pounds (Tokarek et al., 2018). Thus, Plume A is interpreted
                                                                   to be a combination of heavy truck exhaust, indicated by the
                                                                   presence of rBC and NOy , that spatially overlaps the mine
3     Results and discussion                                       face source of CH4 . Plume D shows a similar chemical pro-
                                                                   file with a maximum CH4 of 2.40 ppm, ∼ 0.30 ppm above
3.1    Identification of sources of CH4                            background, associated with elevated levels of NOy (40 ppb)
                                                                   and rBC (1.5 µg m−3 ). The back trajectory for Plume D is
Two example flights from three different facilities (SML,          in agreement with an origin at one of two locations of open
SUN and CNRL) are presented to demonstrate that CH4                pit mining activity at SUN. The two plumes show a simi-
emissions in the AOSR are mainly from three source types:          lar 1NOy / 1rBC ratio within the range of 15–30 ppb per
open pit mining, tailings ponds and facility activities. Emis-     µg m−3 . We consistently measure this profile of NOy and
sions from the remaining two facilities (SAJ and SAU) were         rBC enhancements from active mines across all five facili-
shown to be primarily open pit mining. Source categories           ties.
were identified by measurements of CH4 , NOy , BTEX and               Plume B (Fig. 2) shows the highest CH4 mixing ratio at
rBC. Figure 2 shows measurements from one low-level tran-          4.19 ppm, which is an enhancement of ∼ 2.09 ppm above
sect of a screen flight on 16 August 2013 (nine transects in       background. The back trajectory from the position of the
total). This transect was flown at a height of approximately       maximum CH4 places the air mass over the western edge of
150 m a.g.l. downwind of the SML and SUN facilities, show-         Mildred Lake Settling Basin (MLSB) tailings pond ∼ 20 min
ing a clear separation of emission sources from the two fa-        earlier. The CH4 enhancement occurs simultaneously with
cilities. Four distinct plumes are visible, labeled A–D, with      a decrease in NOy and rBC and an enhancement of to-
linear air parcel back trajectories indicated by red arrows.       tal BTEX from ∼ 0 ppb to a maximum of 7.6 ppb. Tailings
Back trajectories were determined using the wind speeds and        ponds are known to contain significant quantities of BTEX
wind directions measured on the aircraft at flight level from      compounds due to waste streams of mature fine tailings con-
the positions of maximum CH4 , back extrapolated as a gen-         taining naphtha diluent flowing into the pond (Small et al.,
eral indicator of plume origin. This methodology creates a         2015). This is similar to the chemical profile observed in
western bias in our plume origins. A more careful analysis of      Plume C, with a back trajectory placing the air mass over
surface winds at several meteorological stations in the local      one of several possible SUN facility tailings ponds shown
vicinity at the time of the aircraft transect shows that surface   in Fig. 2 (Ponds 6, 5 and 2–3 in Small et al., 2015). This

Atmos. Chem. Phys., 18, 7361–7378, 2018                                             www.atmos-chem-phys.net/18/7361/2018/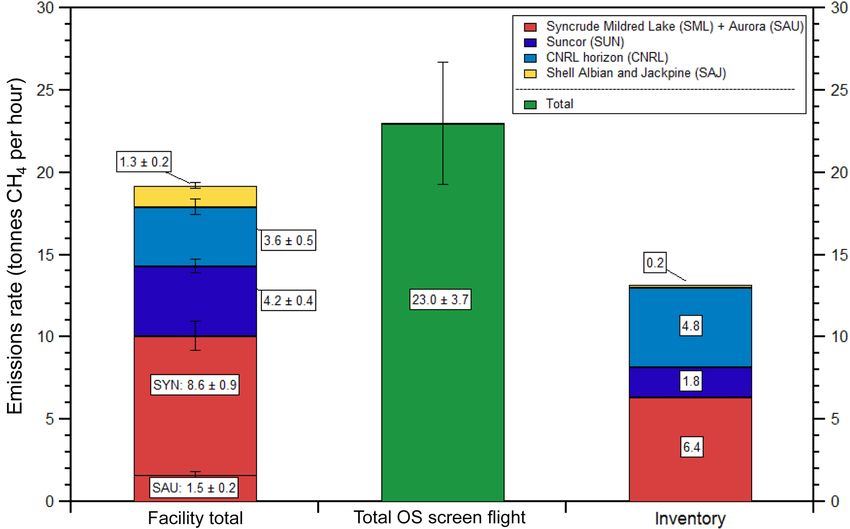
S. Baray et al.: Quantification of methane sources in the Athabasca Oil Sands Region                                                    7367

Figure 2. (a) Aircraft measurements of CH4 (red), BTEX (blue) and rBC (black) from a single transect at 150 m a.g.l. downwind of SML
and SUN on 16 August. Four plumes are labeled: A (SML mine), B (SML tailings), C (SUN tailings) and D (SUN mine). (b) CH4 mixing
ratios along the 150 m a.g.l. transect for the above time series. Each data point is color coded for the CH4 mixing ratio and instantaneous
wind vector measured on the aircraft at that location. Red arrows indicate air parcel back trajectories based on the linear back extrapolation
of the aircraft-measured wind vectors at plume centers, with end points at 100 min (A) and 20 min (B–D).

indicates the presence of CH4 emissions from multiple tail-                 Our observations are qualitatively consistent with pond-
ings ponds. The anaerobic digestion of organic matter in the             specific industry-reported CH4 emission factors, which
tailings pond is the primary mechanism for the production                present SML and SUN Ponds 2–3 (Small et al., 2015) as the
of this biogenic CH4 (Siddique et al., 2012). For Plume C                highest CH4 -emitting tailings ponds in the region. We consis-
the measured mixing ratio enhancements are 0.25 ppm CH4                  tently measured relative enhancements from plumes down-
and 2.3 ppb of BTEX. The lower CH4 enhancement com-                      wind of SML and SUN according to the pattern of Plumes B
pared to Plume B suggests that less CH4 is emitted from                  and C in Fig. 2, demonstrating the feasibility of using BTEX
this pond, in agreement with Small et al. (2015). The peak-              compounds as tracers for the CH4 being emitted from tail-
to-peak CH4 / BTEX ratios from Plume B and Plume C are                   ings ponds. We expect that BTEX would be greatly reduced
∼ 300 and ∼ 100 ppb ppb−1 , respectively. The difference in              from the tailings ponds of those facilities using paraffinic
measured inter-facility CH4 / BTEX ratios could arise from               froth treatment (e.g., SAJ) instead of naphtha. In such cases,
a number of factors including different pond ages, history,              light hydrocarbons could in principle be used as tracers for
depth, methanogenic behavior or the use of different dilu-               the tailings ponds emissions of CH4 . However, we did not
ents in each facility. The in-plume correlations of CH4 with             detect methane plumes above the detection limit that were
the associated tracers (NOy , rBC and BTEX) for each of the              distinct from the open pit mining plumes of CH4 associated
Plumes identified in Fig. 2 are shown in Fig. S2 in the Sup-             with rBC and NOx for any facilities other than SML and
plement.                                                                 SUN.

www.atmos-chem-phys.net/18/7361/2018/                                                       Atmos. Chem. Phys., 18, 7361–7378, 2018
7368 S. Baray et al.: Quantification of methane sources in the Athabasca Oil Sands Region
Elevated plumes from facility stacks are the primary Table 1. Enhancements of 1C2 H6 from canister measurements
sources of SO2 in the AOSR due to the bitumen upgrad- overlapping the CH4 plumes across three flights (14 August, 16 Au-
ing process. Hence, a significant enhancement of SO2 can gust and 2 September). Mean enhanced 1CH4 is shown over the
be used as a tracer for plant or stack CH4 sources. However, course of ∼ 20 s canister sampling times with ethane-to-methane
this is not measured at the height shown in Fig. 2, which ratios (EMRs) computed.
shows a maximum SO2 of only 5 ppb for this transect be-
tween Plumes C and D at 150 m a.g.l. For the same flight Scenario 1C2 H6 1CH4 EMR
(ppb) (ppb) (%)
(Fig. 2), maximum SO2 was 131 ppb for a transect ∼ 350 m
above the ground, with an associated narrow peak of CH4 SML ponds (14 Aug) 3.2 814 0.40
with a maximum mixing ratio of 2.11 ppm. While higher- SML mines (14 Aug) 2.6 365 0.72
altitude SO2 plumes were frequently measured downwind of SUN ponds (16 Aug) 1.2 215 0.56
various facilities over the course of the aircraft campaign, in SUN mines (16 Aug) 1.1 185 0.59
most cases no significant CH4 enhancements were observed CNRL (2 Sep) 1.9 137 1.39
in these plumes. A similar case is discussed in Sect. 3.2 in
which we show the full range of vertical measurements and a
lack of enhanced CH4 in the SO2 plume. Ground-level CH4 mining activity with a secondary undetermined source from
from tailings ponds and open pit mine faces therefore domi- the main plant.
nates the CH4 emissions in the region, with minor contribu- Source profiles of CH4 are further compared to measure-
tions from industrial plants. ments of ethane (C2 H6 ). Source-attribution studies for CH4
We next compare the profiles from SML and SUN to a commonly use higher ethane-to-methane ratios (EMRs) as a
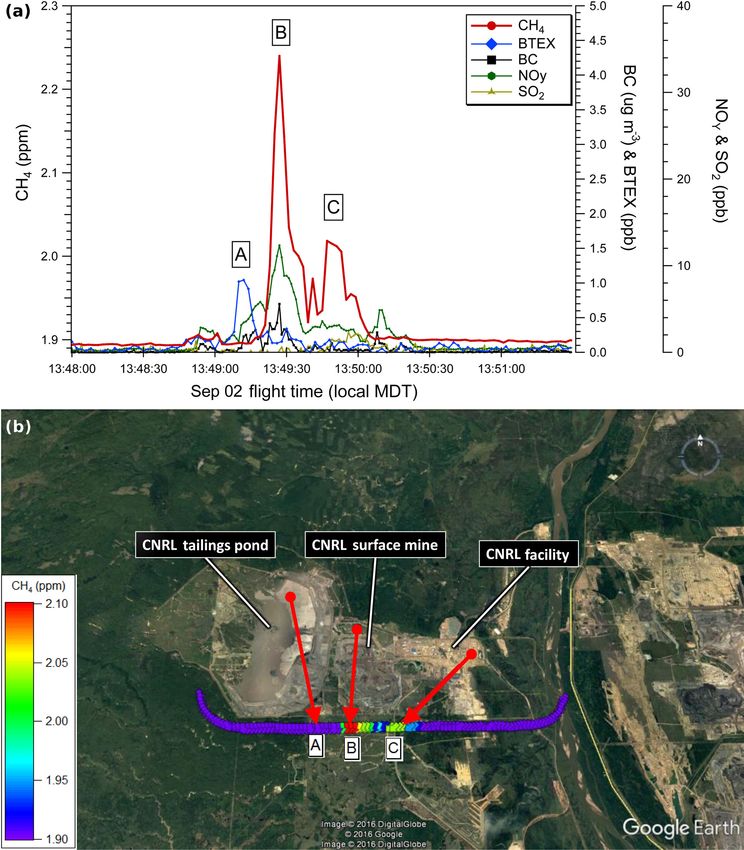
third facility, CNRL Horizon. Figure 3 shows a similar tran- signature for oil and gas emissions on both a regional (Peis-
sect at ∼ 150 m a.g.l. from the 2 September flight in the vicin- chl et al., 2016) and global (Hausmann et al., 2016) scale,
ity of CNRL. The bottom panel of Fig. 3 shows that there while low EMR ratios can be indicative of microbial sources
was considerable wind divergence at this time (see back tra- of methane that do not emit ethane (agriculture, landfills,
jectory arrows for A, B and C). This wind divergence was wetlands, etc.; Smith et al., 2015). C2 H6 , along with other
also present in the next pass of the aircraft on the south side VOCs, was measured from 20 s grab samples collected in
of CNRL at a height of 300 m (not shown). While this diver- 3 L Summa canisters. The VOCs were analyzed offline us-
gence aids in the visualization of source separation, it invokes ing GC-MS and GC-FID methods described elsewhere (Li et
uncertainty in the mass-balance determinations. The emis- al., 2017). Table 1 shows C2 H6 measurements from three dif-
sion rates on 2 September were determined using 10 transects ferent flights (14 August, 16 August and 2 September) when
from a flight much earlier in time than that shown in Fig. 3, canister sampling overlapped the plume descriptions listed
when the winds were more consistent in direction (NNW). previously. In all cases shown, enhancements of C2 H6 above
While Plume A shows a small enhancement of ∼ 1 ppb background (0.8–1.5 ppb) were in the range of only 1–2 ppb,
BTEX downwind of the tailings pond, in contrast to SML normally the highest enhancements for each flight (within
and SUN no significant CH4 was associated with it. This is 1 ppb of 95th percentile). The small emissions rates of ethane
consistent with the pond-specific emission factors presented (EMRs < 1.4 %) across flights contrast with the high EMRs
in Small et al. (2015) that do not list the CNRL tailings pond (i.e., 40–50 %) seen for conventional oil and gas fields in
as a significant source of CH4 . The primary Plume B in- other regions of North America (Peischl et al., 2016; Smith
cluded a CH4 mixing ratio up to 2.24 ppm (an enhancement et al., 2015) and are lower than all the possible EMR source
of ∼ 0.34 ppm above background) associated with 12 ppb scenarios tested in Hausmann et al. (2016). The problems as-
NOy and 0.7 µg m3 rBC downwind of the CNRL mine. Con- sociated with determining EMR ratios from a combination
sistent with the previously described open pit profile and the of continuous CH4 measurements and the discrete canister
back trajectory, we identify Plume B as an open pit mining sampling of ethane from aircraft have been highlighted re-
source of CH4 . A secondary Plume C was measured with a cently, and it was shown that actual EMR ratios determined
maximum CH4 of 2.02 ppm (an enhancement of ∼ 0.12 ppm) in this way can be off by up to a factor of 2 (Smith et al.,
east of the open pit mine. The lack of associated species 2015). Thus, the limited EMR data shown in Table 1 are
does not relate the origin of Plume C to a tailings pond or not intended to be a comprehensive measure of EMR in the
an open pit mine source of CH4 . The plume is downwind of AOSR but simply to support the conclusion that the major
the main CNRL plant and closer in horizontal proximity to sources of methane from the facilities in the AOSR are mi-
SO2 plumes measured during higher-altitude transects. This crobial in nature without a significant co-emission of ethane.
suggests a CH4 source near the main plant that could origi- The low EMRs are consistent with previous measurements
nate from venting or flaring activity, electricity cogeneration in the region (Simpson et al., 2010) and are an indication of
using natural gas or natural gas leakage. Thus, the primary the unique character of unconventional bitumen sources. As
source of CH4 from the CNRL facility is open pit surface such, global estimates of the relative contributions of oil and
gas emissions to decadal increases in atmospheric CH4 that
Atmos. Chem. Phys., 18, 7361–7378, 2018 www.atmos-chem-phys.net/18/7361/2018/S. Baray et al.: Quantification of methane sources in the Athabasca Oil Sands Region 7369
Figure 3. (a) Aircraft measurements of CH4 (red), BTEX (blue) and rBC (black) from a single transect ∼ 150 m a.g.l. downwind of CNRL.
Plume A (CNRL tailings pond), Plume B (CNRL mine) and Plume C CNRL facility. (b) CH4 mixing ratios along the 150 m a.g.l. transect
for the above time series. Each data point is color coded for the CH4 mixing ratio and instantaneous wind vector measured on the aircraft at
that location. Red arrows show back trajectories based on the linear extrapolation of measured wind speed and direction.
are based on C2 H6 and CH4 measurements in the free tro- plume (Plume N) on the northern screen (∼ 6500 m wide) ex-
posphere (Hausmann et al., 2016) would not capture AOSR iting the box, a secondary plume (Plume NW) at the north-
emissions due to the low C2 H6 emissions in this region. west corner (∼ 7000 m wide) exiting the box and a smaller
plume (Plume E) on the eastern screen (∼ 3000 m in width)
3.2 Quantification of CH4 emission rates from sources entering the box from outside the SML facility boundary. The
lowest aircraft transect was at a height of ∼ 150 m a.g.l., with
The source chemical profiles in Sect. 3.1 can be used in com- maximum CH4 mixing ratios of 3.00, 2.60 and 2.63 ppm, re-
bination with the screen mass-balance method (Eq. 1) to iso- spectively, for the three plumes. Mixing ratios of CH4 be-
late and quantify categories of AOSR emissions. As an ex- low 150 m a.g.l. are based on a linear extrapolation of in-
ample, we show the 14 August flight surrounding the SML terpolated pixels to the surface corresponding to maximum
facility, which consisted of a box and screen path flown in surface mixing ratios of 3.48, 3.17 and 3.06 ppm for the pri-
rapid succession. Figure 4 shows an image of the interpolated mary (N), secondary (NW) and tertiary (E) plumes, respec-
aircraft measurements from the box path creating a contigu- tively. Extrapolation to the surface is the primary source of
ous mesh superimposed on a map of the region. Winds were uncertainty for surface sources in this method; however, the
from the south at 186 ± 48◦ over the course of the day. Three uncertainty can vary between flights depending on the mete-
distinct ground-based plumes of CH4 are visible: a primary
www.atmos-chem-phys.net/18/7361/2018/ Atmos. Chem. Phys., 18, 7361–7378, 20187370 S. Baray et al.: Quantification of methane sources in the Athabasca Oil Sands Region Figure 4. Interpolated CH4 mixing ratios for the 14 August box flight surrounding SML. Figure 5. Curtain plots showing interpolated CH4 , BTEX, NOy , rBC and SO2 mixing ratios for the 14 August box flight around SML. The red-dashed box indicates the primary plume on the north screen, the yellow-dashed box indicates the secondary plume on the west screen and the black-dashed box indicates the tertiary incoming plume on the east screen. The orange dashed-circle shows the upgrader plume on the north screen. orological conditions (Gordon et al., 2015). As a part of our dotted boxes in red (N screen), yellow (NW corner) and black uncertainty analysis in the Supplement, we have included an (E screen). The red and yellow boxes show sources originat- uncertainty associated with the differences in emission rates ing from within the SML facility and the black boxes show that arise from the use of linear, constant and half-Gaussian a source originating outside of the SML boundaries and en- extrapolations in the calculations. tering the box from the east. The largest SML CH4 plume Unwrapped curtain plots of CH4 , BTEX, NOy , rBC and is associated with > 10 ppb BTEX and the absence of rBC SO2 from the 14 August box flight (Fig. 4) are shown indi- and SO2 , with some NOy (∼ 20 ppb). This is consistent with vidually in Fig. 5, projecting the 3-D virtual box onto a 2-D the chemical signature associated with tailings pond emis- grid. The same three plumes from Fig. 4 are highlighted by sions discussed previously. The NW plume is associated with Atmos. Chem. Phys., 18, 7361–7378, 2018 www.atmos-chem-phys.net/18/7361/2018/
S. Baray et al.: Quantification of methane sources in the Athabasca Oil Sands Region                                                                                              7371

> 60 ppb of NOy and up to 5 µg m−3 of rBC, with minimal                                                  12                                                                        12

BTEX and SO2 , consistent with the expected chemical sig-                                                                                                       Tailings ponds

                                                                  Emissions rate (tonnes CH4 per hour)
                                                                                                                                                                Mines
nature from open pit surface mining. The smaller plume on                                                10                                                     Facility/other     10
the E screen is associated with elevated BTEX and CH4 and
is likely a plume from one of the SUN tailings ponds as the                                              8                                                                         8
winds indicate the plume is entering the box. The elevated
                                                                                                              6.4 ± 0.8
plume in Fig. 5 (orange circles) with ∼ 100 ppb of SO2 and
                                                                                                         6                                                                         6
∼ 30 ppb of NOy is traced to the SML upgrader activities, but
with no enhancement of CH4 above background on this day.
                                                                                                         4                                                                         4
A second NOy plume is visible at the northeastern corner of                                                                 2.4 ± 0.3
                                                                                                                                        1.0 ± 0.3
the box, not associated with any of the identified CH4 source
                                                                                                         2                                                                         2
types. This NOy plume likely originates from traffic on the                                                   2.8 ± 0.4
                                                                                                                                        2.6 ± 0.7
main highway that passes between the SML and SUN facili-                                                                    1.8 ± 0.2
                                                                                                                                                    1.2 ± 0.2
                                                                                                                                                                      1.4 ± 0.3

ties and/or trucks and other vehicles operating in and around                                            0
                                                                                                               SML           SUN        CNRL          SAJ              SAU
                                                                                                                                                                                   0

the main SML facility.                                                                                                                  Facility
   Boundaries of the plumes from separate sources are esti-
mated using the tracer species listed in Fig. 5 by evaluating    Figure 6. Source-apportioned emissions rates of CH4 determined
where the chemical signatures reached background levels.         by the screen mass-balance method (Eq. 1) for the SML, SUN,
However, the SML tailings pond and open pit mine plumes          CNRL, SAJ and SAU facilities. Emissions rates are the average of
were not completely resolved from one another, overlapping       three mass-balance flights for SML over 2 days, two flights each for
within a range of ∼ 800 m. The uncertainties in the emis-        SUN, SAJ and SAU on separate days and one flight for CNRL.
sion rates due to plume overlap were estimated by contract-
ing and expanding the horizontal integration boundaries (s)
by 800 m on each side (a total of ± 1600 m) as part of the       icant open pit mining emissions of CH4 of 2.8 ± 0.4 and
sensitivity analysis. A vertically varying background profile    1.8 ± 0.2 t h−1 , respectively, and were the only facilities with
([CH4 ]B (z)) is determined using data from the upwind south-    tailings ponds emissions above the detection limit, 6.4 ± 0.8
ern screen, as mentioned previously. Using a spatially identi-   and 2.4 ± 0.3 t h−1 . CNRL had open pit mining emissions
cal screen of perpendicular wind U> (z), the fluxes are deter-   (2.6 ± 0.7 t h−1 ) and significant emissions originating from
mined through each pixel and the total source emission is cal-   the main plant facility (1.0 ± 0.3 t h−1 ). Plumes of CH4 from
culated by integrating the pixels within the plume boundaries    SAJ and SAU were only attributed to open pit emissions of
(Eq. 1). CH4 emissions rates are computed to be 6.4 ± 1.2        1.2 ± 0.2 and 1.4 ± 0.2 t h−1 , respectively.
tonnes per hour (t h−1 ) for the SML main tailings pond and         The plume-targeting screen mass-balance method de-
2.7 ± 0.6 t h−1 for the SML open pit mine source. It is possi-   scribed here is unable to resolve emissions of CH4 from mul-
ble that the CH4 plume from the SML tailings pond includes       tiple sources not characterized by the chemical profiles de-
CH4 emissions from the main SML plant facility (flaring,         scribed in Sect. 3.1 if they cannot also be spatially separated.
venting, natural gas leakage, etc.) that cannot be spatially     Because spatial s and z constraints are manually chosen by
separated from one another due to their proximity; however,      plume boundaries from chemical profiles, minor emissions
we anticipate that the magnitude of these emissions are mi-      may contribute to an overestimation of the emissions from
nor and captured within the error intervals listed.              an individual source when highly coincidental in space such
   This screen-based mass-balance approach for determining       that the sources are not separable. For example, the emis-
specific source emission rates (Eq. 1) is applied to flights     sions from the main plant were identifiable in the case of
with appropriate conditions for plume separation. Mean           CNRL due to the separation and orientation of the plant, the
emissions rates of CH4 from specific sources within the facil-   open pit and the tailings ponds with respect to the winds.
ities SML, SUN, CNRL, SAU and SAJ are shown in Fig. 6.           This was not the case for the other major facilities in the
SML emissions rates are the average of three mass-balance        AOSR where many of the sources were highly coincidental
flights over 2 days (two on 14 August and one on 16 Au-          in space. It is possible and even likely that other major facil-
gust). Two flights on separate days were used for each of the    ities in this study also have CH4 emissions from their main
SUN (16 and 29 August), SAJ (21 August and 6 September)          plants (venting, cogeneration, natural gas leakage, etc.) that
and SAU (29 August, 6 September) facilities. One CNRL            are identified as tailings pond emissions or open pit emis-
flight (2 September) had northerly wind conditions showing       sions due to close proximity and our inability to deconvolute
plume separation on a southern screen. No significant daily      the sources spatially or chemically. However, we expect that
variability is observed as the emissions rates for the same      the total emission rates of CH4 from each facility are still
source agree within error. Duplicate and triplicate estimates    accurate.
for the same source are combined using an error-weighted            Emissions rates from each flight and individual sources
uncertainty (the Supplement). SML and SUN had signif-            (where possible) using the screen mass-balance method are

www.atmos-chem-phys.net/18/7361/2018/                                                                                     Atmos. Chem. Phys., 18, 7361–7378, 2018
7372 S. Baray et al.: Quantification of methane sources in the Athabasca Oil Sands Region
tabulated in the Supplement (Tables S1–S5). We did not mea- amounts of CH4 from ponds in the other three facilities were
sure a detectable tailings pond source of CH4 from CNRL, not detected. This could be related to differences in the chem-
SAJ and SAU. Associated enhancements of rBC and NOy ical composition of the process streams being released into
with CH4 suggest that the CH4 source from SAJ and SAU these ponds, or it could simply be due to these ponds be-
is also predominantly open pit mining. The results using the ing younger in age, with insufficient time for the anaerobic
screen mass-balance approach (Eq. 1) are further verified in methanogenic communities to be established (Small et al.,
Sect. 3.3 using emissions rates for each facility determined 2015). We are unable to differentiate emissions from ponds
from the box approach (Eq. 2). within the same facility due to overlapping chemical profiles
from ponds within close proximity. However, using the ratios
Comparison to fugitive emissions literature of relative pond emissions rates within the same facility pre-
sented in Small et al. (2015), (i.e., MLSB contributes 92 %
Average open pit surface mining emissions from the five fa- to SML emissions, Ponds 2–3 contribute 85 % to SUN), we
cilities are within a range of 1.2–2.8 t h−1 (Fig. 6 and Ta- can infer individual pond emissions from our measurements
bles S1–S5). This shows some consistency in the nature of assuming that the relative contributions are accurate. The
CH4 release from open pit mining activity in the region, with resulting emissions rates are 5.8 ± 0.8 t h−1 for MLSB and
differences that may possibly be attributed to the size of the 2.0 ± 0.3 for Ponds 2–3. This ranks the MLSB tailings pond
surface disturbance taking place and the intensity of the min- as the highest area source of CH4 in the AOSR, followed
ing activity. Methane emissions from open pit mines were by the open pit mines in SML and CNRL, with Ponds 2–
recently estimated using a bottom-up emissions factor ap- 3 in SUN as the fourth highest. Total CH4 from tailings
proach by analyzing the gaseous composition in the overbur- ponds in Small et al. (2015) is estimated to be 30.3 kt of
den and oil sand component of drill core samples (Johnson CH4 per year, with 29.7 kt of CH4 from the SML and SUN
et al., 2016). Emissions factors of CH4 were then scaled up facilities (∼ 98 %). Our total CH4 emission rate determined
according to the total mass of material mined or the total bi- for tailings ponds is 8.8 ± 0.9 t h−1 , which corresponds to
tumen produced. For 2013, Johnson et al. estimate total fugi- 77.1 ± 7.9 kt yr−1 if a constant temporal factor is assumed.
tive mining emissions in the region to be 21.4–46.0 kt of CH4 This is 2.3–2.9 times larger than the emissions inferred from
using total mined material and 33.1–85.0 kt of CH4 using to- the data in Small et al. (2015), despite the uncertainty of ex-
tal mined bitumen. Our top-down approach estimates total trapolation to an annual emissions rate. Our measurements
fugitive emissions from open pit mining to be 9.7 ± 0.9 t h−1 , suggest that more work is needed to reconcile top-down and
corresponding to 84.9 ± 7.9 kt yr−1 CH4 if constant temporal bottom-up CH4 emissions.
emissions are assumed. Agreement with the upper estimates
in Johnson et al. (2016), despite the uncertainty associated 3.3 Emission rates of CH4 from AOSR facilities
with extrapolation to annual emissions, suggests that their
bottom-up emissions factors from gases in core samples may The total emissions rates of CH4 from each facility deter-
reliably predict real-world emissions provided there is accu- mined using the box mass-balance method (TERRA) are
rate characterization of CH4 in the core samples over the tabulated in the Supplement (Tables S1–S5) along with the
entire disturbed area. This is reasonable considering that it determinations using the screen approach. Where multiple
would be expected that degassing of an extremely volatile screen estimates or multiple box estimates were available,
gas such as CH4 from the oil sands material would be quan- uncertainty-weighted (1/σ 2 ) averages were determined for
titative in a short period of time after the ore is exposed or each method for each facility and are summarized in Table 2.
crushed. While the box method is in some cases based on the same
From our 2013 measurements, only two facilities, SML downwind measurements as the screen approach, the two
and SUN, had significant emissions of CH4 from tailings methods have several key differences (described in Sect. 2.3)
ponds. Tailings ponds emissions accounted for ∼ 70 and and are treated as independent estimates. In particular, the
∼ 58 % of total CH4 from SML and SUN, respectively. This box method does not resolve specifically targeted, individual
accounted for ∼ 45 % of total emissions in the AOSR. Re- plumes and instead determines the net outgoing flux from the
cently, bottom-up area-weighted emissions factors of CH4 closed volume surrounding the facility. Thus, consistency be-
from 19 major tailings ponds in the AOSR were provided tween the two estimates is evidence that the primary sources
for the year 2012 (Small et al., 2015). The top three emitting of CH4 from facilities in the AOSR are tailings ponds, open
ponds reported were Mildred Lake Settling Basin (MLSB) pit mines and facility emissions captured by the source char-
and the West In-Pit (WIP) pond within SML and Ponds 2–3 acterization in Sect. 3.1 and 3.2. In general, the total emis-
(P23) within SUN. These tailings ponds account for > 96 % sions from each facility using the screen and box methods
of tailings pond CH4 in the region according to that study. are in agreement within uncertainty, which adds confidence
This is qualitatively consistent with our measurements of to the measured emission rates reported here. In the final
CH4 mainly from SML and SUN. Our method requires CH4 row of Table 2, we calculate a weighted average emission
plumes to be clearly enhanced above background, so trace rate for each facility using all screen and box measurements.
Atmos. Chem. Phys., 18, 7361–7378, 2018 www.atmos-chem-phys.net/18/7361/2018/S. Baray et al.: Quantification of methane sources in the Athabasca Oil Sands Region 7373
The CH4 emission rates from the facilities are 8.6 ± 0.9, 3.5 Comparison to emission inventories
4.2 ± 0.4, 3.6 ± 0.5, 1.3 ± 0.2 and 1.5 ± 0.2 t CH4 h−1 from
the SML, SUN, CNRL, SAJ and SAU facilities, respectively. Emissions of anthropogenic greenhouse gases are estimated
by ECCC in Canada’s GHG Inventory, which forms the ba-
sis for Canada’s annual report to the United Nations Frame-
3.4 Total emissions of CH4 from the AOSR
work Convention on Climate Change, UNFCCC (ECCC,
2016). Currently, industrial facilities that emit more than
The total CH4 emissions from the five mining facilities in 50 kt CO2 eq yr−1 are required to report their emissions an-
the AOSR, obtained by summing the best estimates (i.e., nually to ECCC using the Greenhouse Gas Reporting Pro-
uncertainty-weighted average of multiple measurements; gram (GHGRP), which is Canada’s legislated, publicly ac-
bottom row, Table 2) of the individual facility emission rates, cessible inventory of facility-reported greenhouse gas (GHG)
is given in the final row and column of Table 2. The five- data (ECCC, 2017a). Although the GHGRP inventory data
facility total emission rate of CH4 is 19.2 ± 1.1 t CH4 h−1 . are not necessarily used in Canada’s GHG Inventory, changes
A final independent estimate of total AOSR emissions was are being proposed to expand monitoring requirements in
obtained from a flight on 16 August utilizing an indepen- the GHGRP, including lowering the reporting threshold to
dent transect screen ∼ 75 km wide (16 August Screen B) 10 kt CO2 eq yr−1 in order to enable direct use of the reported
downwind of all major mining facilities in the AOSR (ex- data in Canada’s GHG Inventory (ECCC, 2017b). Emissions
cluding Imperial Kearl Lake and Suncor Firebag operations, of CH4 from all five major oil sands facilities discussed in
but also inclusive of any emissions from the Suncor MacKay this paper are present in the GHGRP Emissions Inventory
River in situ facility). The details of this flight are given on an annual basis. The annual emission rates of CH4 ex-
in the Supplement Table S6. The interpolated screen from tracted from the inventory were downscaled to hourly emis-
the 16 August flight (total OS) is shown in Fig. 7. The sions rates for comparison with our measurements with an
screen was constructed from 10 aircraft horizontal transects assumption of equal seasonal and diurnal profiles 365 days a
from 250–900 m a.g.l. Enhancements of CH4 were measured year and 24 h per day for consistency with upscaling factors
over a wide horizontal subrange of ∼ 60 km of the entire used to generate annual emissions (see Fig. 8). While this
∼ 75 km screen. Winds were perpendicular to the plane from may be questioned, it should be noted that fugitive emissions
the southwest (225◦ ), showing a large flux of CH4 through of CH4 from mine faces and tailings ponds in the invento-
the screen from upwind sources. The highest measured mix- ries are estimated based upon emission factors measured at
ing ratios of CH4 were 2.67 ppm at the ∼ 250 m a.g.l. tran- oil sands facilities during summer months (June–September),
sect. Background CH4 in the region was ∼ 2.00 ppm taken which are then upscaled from hourly emissions to annual
as a vertical profile from the wings of the screen. Using emissions using the same assumption that we used to down-
the screen method (Eq. 1), the emissions rate was deter- scale (365 × 24), as per the recommendation by the govern-
mined to be 23.0 ± 3.7 t CH4 h−1 , which represents the emis- ment of Alberta (GOA, 2014). Specifically, it is noted from
sions from all major facilities within the AOSR domain. This the GOA report that emissions of gaseous species such as
AOSR total is only slightly larger than the previous five- CH4 (and CO2 ) are not temperature dependent (unlike VOCs
facility total emission rate of 19.2 ± 1.1 t h−1 , but not sta- that have temperature-dependent vapor pressures; Li et al.,
tistically so, demonstrating the reproducibility of our mea- 2017). The argument used to justify the use of a constant
sured estimates. It is entirely possible that there are other seasonal temporal factor in the GOA report is that tempera-
minor sources of CH4 included in this larger number from tures at depth in a tailings pond are said to remain relatively
smaller industrial operators in the region, trucks and vehi- constant throughout the year, and thus biogenic gas forma-
cles on the main highway, and wetland emissions. In fact, tion continues in the winter (GOA, 2014). For mine faces,
the Canadian GHGRP inventory (see Sect. 3.5) indicates the GHG component of the oil sand does not change with
that there is an additional 0.13 t CH4 h−1 emitted upwind temperature and is likely released completely in a short pe-
and 0.17 t CH4 h−1 emitted downwind of the aircraft screen riod of time after being mined. Thus, the government rec-
(Fig. 7) from minor industrial facilities within the AOSR ommendation to oil sand facilities in preparing annual emis-
(both numbers downscaled from the facility-reported annual sion estimates of fugitive GHGs is that reduction factors
emissions). The amount of CH4 emitted from vehicles on the should not to be used in extrapolating summertime emis-
highway, however, is expected to be smaller. The fact that sions over the rest of the year (GOA, 2014). Figure 8 shows
the two numbers are not statistically different supports the a comparison of the total measured emission rates of CH4
determination that the majority of the CH4 in the AOSR is from the five industrial facilities (2013), the total measured
emitted from the five major industrial facilities in the region. CH4 emission rate in the AOSR from the single downwind
The two values are combined here using an error-weighted screen on 16 August 2013 and the sum of the facility emis-
uncertainty, resulting in a final AOSR facility emissions esti- sion rates from the Canadian GHGRP Emissions Inventory
mate of 19.6 ± 1.1 t CH4 h−1 measured during a summertime for 2013 expressed in hourly units. The combined facility
period. emissions rate of 19.6 ± 1.1 t h−1 is approximately 48 ± 8 %
www.atmos-chem-phys.net/18/7361/2018/ Atmos. Chem. Phys., 18, 7361–7378, 2018You can also read