Quantifying the Welfare Effects of Reputation in E-Commerce: Evidence from Alibaba's Taobao Marketplace
←
→
Page content transcription
If your browser does not render page correctly, please read the page content below
Quantifying the Welfare Effects of Reputation in
E-Commerce: Evidence from Alibaba’s Taobao Marketplace
                                     Huijie Yu ∗
                           North Carolina State University
                                 Job Market Paper
                                          November 2014

                                              Abstract
            Taobao Marketplace, operated by Alibaba Group, is one of the biggest online
        retailers in the world. This article quantifies the welfare effects of reputation using
        a unique dataset of iPhone5 posted-price transactions from Taobao Marketplace.
        Sellers’ reputation is measured by iPhone5 specific positive feedback ratios. On the
        demand side, I employ a nested logit model and estimate consumers’ willingness
        to pay for reputation. On the supply side, reputation is modeled as an endogenous
        variable and cost parameters are estimated. Good reputation is found to be costly to
        maintain. My results suggest that it costs an average seller 120 USD (2.5 percent of
        the average daily revenue of a seller) more per day to maintain his positive feedback
        ratio at 99.1 rather than 98.6 percent, a half standard deviation difference. Two
        counterfactual analyses are conducted to study the welfare effects of reputation. If
        the slope of the marginal cost of maintaining reputation is reduced by 20 percent,
        then the mean of the iPhone5 positive feedback ratios increases from 99.1 to 99.3
        percent. Both seller profits and social welfare increase significantly. Consumer
        welfare increases slightly, driven by the fact that the quality provision of sellers
        increases. The second counterfactual assumes that Taobao removes its time limit on
        feedback revision. I find that both the average positive feedback ratio and average
        seller profit increase by a small amount. Consumer welfare decreases due to the
        increase in prices, despite the increase in quality provided. Social welfare increases
        by 12 thousand USD per day.

       JEL Codes: D12, D22, D60, L13, L81
       Keywords: E-Commerce, Reputation Mechanisms, Structural Analysis, Welfare
       Analysis

   ∗
    The author thanks Xiaoyong Zheng, Robert Hammond, Stephen Margolis, and Thayer Morrill for
their valuable comments on earlier drafts of this paper. The author also thanks Emily Wang and Ford
Ramsey for their helpful feedback on this research. All errors should be attributed to the author. Any
comments are welcomed at: hyu5@ncsu.edu.

                                                  1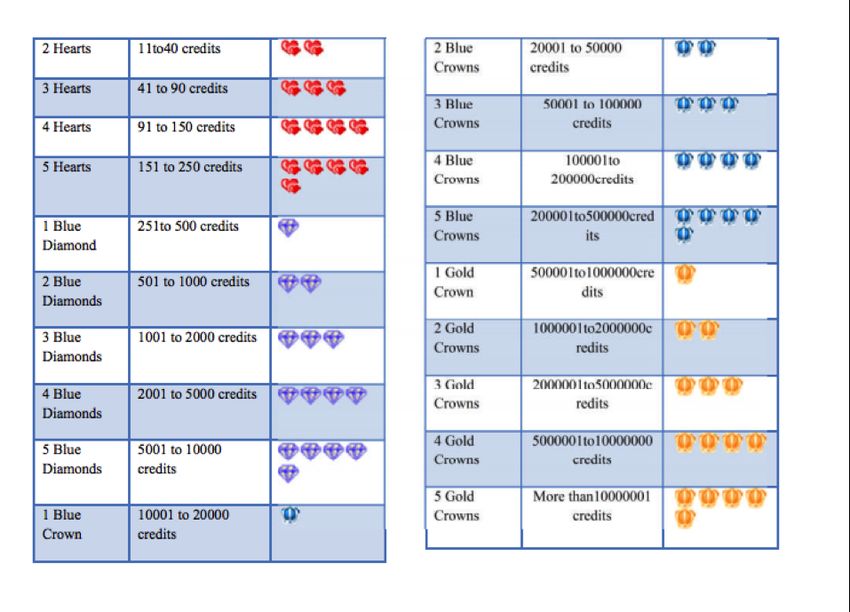
1 Introduction

Reputation mechanisms in Internet commerce have attracted a lot of attention for at least

two important reasons. First, online markets have been growing rapidly and globally.

EBay reported a total revenue of 14.1 billion US Dollars (USD) and a gross merchandise

volume (GMV) of 67.8 billion USD in 2012. Taobao.com, the dominant Internet retailer

in China, had more than 250 million active users in 2012. Its total revenue was higher

than 4.1 billion USD and its GMV was greater than 170 billion USD in the same year.

Second, the Internet provides systematic and formal feedback systems while traditional

markets typically do not.

   Parties to transactions in the online marketplace have asymmetric information about

the goods and services being traded. Buyers do not know the quality of the product

or service provided by the seller until they actually receive it. A buyer may leave good

feedback with respect to a seller if he receives a satisfactory product. On the contrary,

the buyer will be disappointed if he receives a product of bad quality and may choose

to leave bad feedback. Thus, feedback left by consumers is considered a good proxy for

sellers reputation. On the supply side of the market, each seller chooses to provide a

certain quality of service, which directly affects the nature of the feedback they receive

for their products. Sellers are aware of the consequences of providing high or low quality.

If sellers provide high quality, consumers will leave positive feedback and sellers will build

good reputation. Otherwise, consumers will leave negative feedback and sellers will have

bad reputation. In this sense, reputation can be viewed as an endogenous variable that

is chosen by sellers.

   In order to increase economic efficiency, feedback systems in online marketplaces

have been constantly improved. eBay’s classic reputation mechanisms allow buyers and

sellers to mutually evaluate their performance in completed transactions. In order to

reduce seller retaliation and improve market transparency, in May 2007, eBay added a

                                              2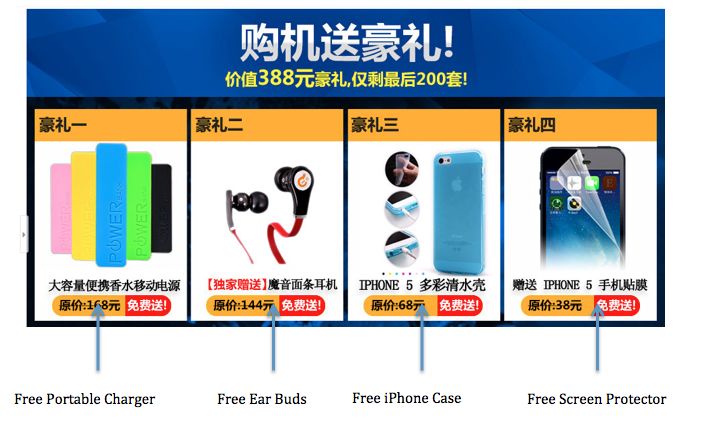
new system, called detailed seller ratings, which allows buyers to unilaterally rate seller

performance. Similarly, Taobao Marketplace added detailed seller ratings to its feedback

systems in 2008. Online marketplaces also provide trainings for sellers to improve their

performance. For example, Taobao University, an affiliation of Taobao Marketplace,

offers courses that cover a wide range of topics to sellers.

   Papers that focus on the effects of online feedback characteristics on transaction

outcomes include Houser and Wooders (2006), Resnick et al. (2006), Jin and Kato

(2006), Lei (2011), Melnik and Alm (2002), Jolivet, Jullien and Postel-Vinay (2014),

and Elfenbein, Fisman and McManus (2012). Although different data are used, the

results of these papers are similar: reputable sellers enjoy better transaction outcomes,

such as higher prices and higher probability of sales. Another literature focuses on “social

learning.” Luca (2011), Cai, Chen and Fang (2009), and Anderson and Magruder (2012)

study how social learning affects individuals’ dining choices. Reinstein and Snyder (2005)

and Moretti (2009) investigate the effects of social learning in the movie industry. Hilger,

Rafert and Vilas-Boas (2011) conduct a field experiment to investigate how consumers

respond to expert opinion labels for wine. Although different methodologies are applied

in these papers, they agree that individuals tend to follow other people’s decisions.

   The idea that better reputation leads to more sales is fairly intuitive, but it induces

an interesting question: why don’t all sellers try to build a good reputation by providing

satisfactory quality to buyers? Few papers have attempted to examine seller behavior

with regard to reputation maintenance. Fan, Ju and Xiao (2013) use Taobao data

to investigate sellers’ activity in managing reputation at different stages. Cabral and

Hortaçsu (2010) find that when a seller’s reputation is high, the incentive to invest in

maintaining reputation is also high. When a perfect record is stained by the first negative

feedback, sellers are less motivated to deliver satisfactory services.

   There are several important questions that are not addressed in the existing litera-

ture. Does the cost of maintaining good reputation differ from the cost of maintaining

                                             3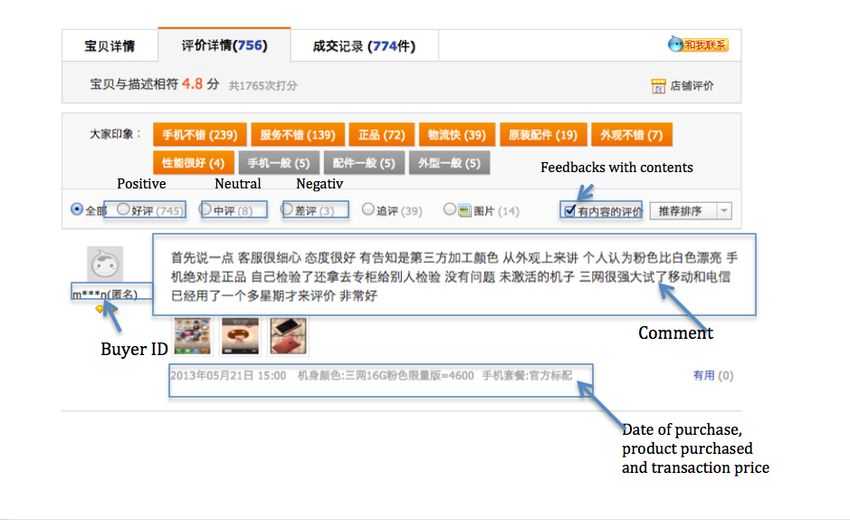
bad reputation? How much is consumers’ willingness to pay (WTP) for reputation and

what are the welfare effects of reputation? Particularly, would profits increase when sell-

ers increase their reputation? Also, would consumers be better off when sellers deliver

better quality but charge higher prices at the same time? To address these questions,

I develop a model where consumers and sellers interact and simultaneously make their

optimal decisions.

   This paper considers the problem of estimating demand and supply in the online

marketplace and studies the welfare effects of reputation. The estimation focuses on

one product, iPhone5, in Taobao Marketplace. On the demand side, consumers make

purchasing decisions based on product characteristics. One of the important product

characteristics is quality. Quality consists of two aspects in this case: quality of the raw

product and quality of services provided by sellers. The former is easy to measure and

does not vary much across sellers due to the nature of the products in my sample. In

contrast, quality of the services provided varies across sellers and is difficult to measure.

For instance, a buyer may enjoy his purchasing experience if the seller is able to solve

problems and communicate effectively. Although quality is not fully revealed in online

marketplaces, feedback left by consumers is an informative proxy for quality. By leaving

feedback ratings and comments, consumers are able to express their thoughts about the

service they receive from the seller, for instance, whether the products are as described,

whether the shipping service is fast, etc. Hence, feedback scores disclose quality and

are an important dimension of product characteristics. My reputation measures include

iPhone5 specific feedback scores and seller specific feedback ratings.

   On the supply side, each seller maximizes profits by choosing optimal prices and

quality provision. Since sellers know that they will receive feedback ratings based on

the quality they provide, sellers indirectly choose optimal reputation. Sellers’ cost of

selling iPhone5s includes two pieces: cost of the input (physical iPhone5s) and cost of

reputation maintenance.

                                             4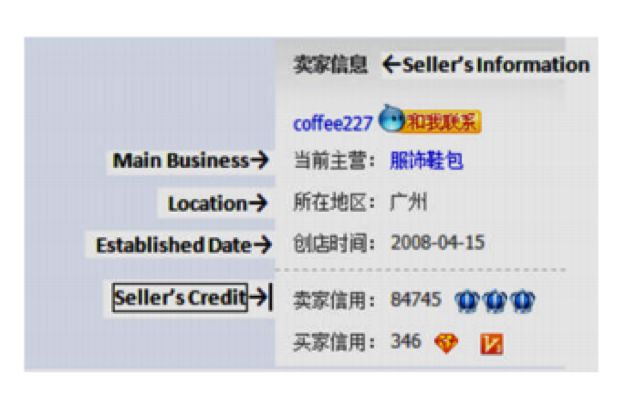
I find compelling empirical evidence in support of the positive relationship between

good reputation and consumer demand: utility from purchasing an iPhone5 increases

when feedback ratings increase, and thus products that have better reputation enjoy

greater market share. Reputation has a positive effect on consumers’ willingness to pay.

For a half standard deviation increase in the iPhone5 specific positive feedback ratio,

consumers’ willingness to pay is 1.5 percent of the price of an iPhone5. Results of supply

estimation show that it would cost an average seller 120 USD per day more to maintain

his reputation at 99.1 rather than 98.6 percent, a half standard deviation difference.

   I conduct two counterfactual analyses to examine the welfare effects of increases in

seller reputation. In the first simulation, the slope of the marginal cost of reputation

maintenance decreases by 20 percent. The results show that the mean of iPhone5 specific

positive ratios increases from 99.1 to 99.3 percent. The average increase in prices equals

19 USD. Seller profits significantly increase, driven by the decrease in cost of reputation

maintenance. Consumer welfare slightly increases due to the increase in seller reputation,

despite the increase in prices. The increase in seller profits exceeds the reduction of cost

of maintaining reputation. Therefore, social welfare increases.

   The second simulation assumes that any negative feedback can be revised. I find

that the mean of iPhone5 specific positive ratios slightly increases. Seller profits slightly

increase due to the increase in prices and quantity sold. Consumer welfare decreases by

a small amount, mainly driven by the increase in product prices. Social welfare as a

whole increases by 12 thousand USD per day.

   My article is distinguished from previous studies in the following ways. It is the first

empirical work that quantifies the effects of reputation on consumer and seller welfare

in the online marketplace. Specifically, it is the first to estimate a structural market

equilibrium model for online products with a focus on reputation of the sellers. My

results will shed light on optimal reputation mechanism design in online marketplaces.

Klein, Lambertz and Stahl (2013) find that an increase in market transparency leads

                                             5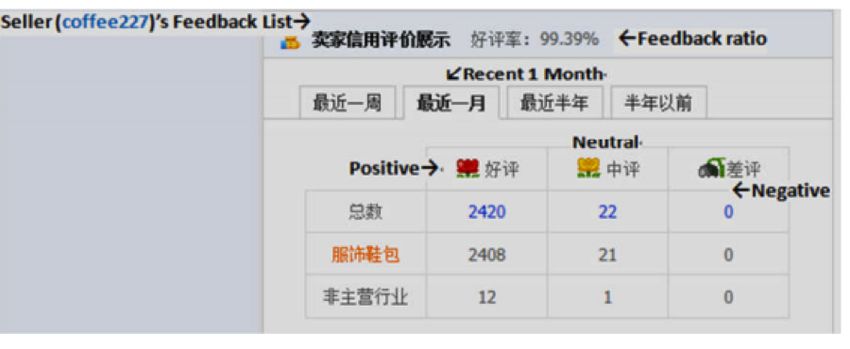
to higher quality provision. Nonetheless, they do not quantify the welfare effects of

reputation. Market equilibrium analysis has been applied in a variety of industries

with product differentiation, from groceries and packaged goods to automobiles. In

general, these models attempt to uncover cost and demand information from market

data. However, there has been comparatively little investigation into the online retail

industry, an industry that has been growing rapidly throughout the world.

   Second, my dataset of iPhone5 posted-price transactions from Taobao Marketplace

is unique. Lei (2011) addresses the importance of controlling for the product specific

dimension of reputation. He constructs a product specific reputation measure for Gmail

invitations by counting the cumulative sales volume of Gmail invitations. Taobao dis-

plays both the numbers and the contents of all positive, neutral, and negative feedback

ratings towards a specific product sold by a specific seller. I calculate a ratio constructed

from the number of positive ratings and the total number of ratings, which should be a

more accurate measure of product specific reputation than cumulative past sales.

   The rest of this paper is structured as follows. Section 2 reviews literature. In

Section 3, I introduce the institutional setup of Taobao. Details of the dataset are

provided in Section 4. In Section 5, I specify a demand-and-supply model. Section

6 reports summary statistics. The main empirical results are presented in Section 7.

Welfare effects are studied in Section 8. Section 9 concludes the paper.

2 Literature Review

There is abundance of empirical literature that studies the phenomenon of reputation in

online marketplaces. These papers mainly focus on the effects of online feedback on price

and sales on eBay.com: Lucking et al. (2007), Houser and Wooders (2006), Resnick et al.

(2006), Jin and Kato (2006), and Melnik and Alm (2002). Lei (2011) uses a collection

of auctions of Gmail invitations on eBay to study the influence of seller reputation on

                                             6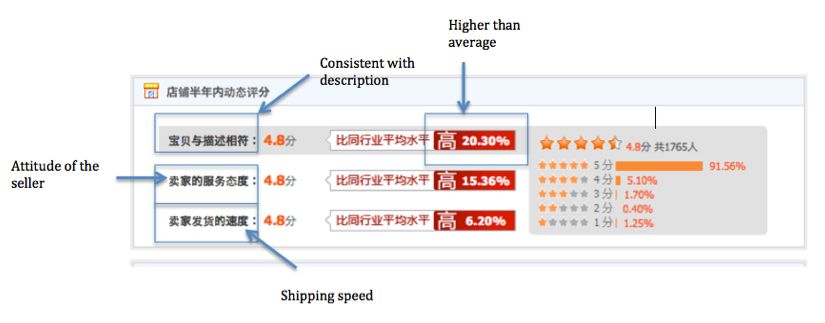
auction outcomes. He finds that sellers who improve their reputation by one quintile

from the lowest experience a 6.2 percent higher probability of sale. He also finds a 6.1

percent increase in valuation after adjusting for truncation bias from failed auctions and

controlling for unobserved seller heterogeneity. Cabral and Hortaçsu (2010) find that,

following the first negative feedback received by a seller, the sales growth rate drops

from positive 5 percent to negative 8 percent.

   There are also papers that study reputation mechanisms in Chinese online market-

places. Cai et al. (2014) show that before the introduction of a centralized feedback

system, sellers on Eachnet.com (an eBay equivalent in China) with a longer successful

selling record enjoyed more repeat business, reached more buyer regions, sold in more

product categories and had a higher sale completion rate. After the introduction of

the centralized feedback system, reputable sellers enjoyed even larger market expansion

into new buyer regions and new product categories compared to non-reputable sellers.

Fan, Ju and Xiao (2013) use data from Taobao.com to study how reputation affects

revenue, price, transaction volume, and survival likelihood for new and established sell-

ers. Jolivet, Jullien and Postel-Vinay (2014) find that reputation of sellers influences

transaction outcomes in a French Internet marketplace.

   Literature that studies reputation mechanisms in the offline markets focuses on the

effects of peer review, expert review, or “Word-of-Mouth” on consumers’ decisions. For

the movie industry, both expert critics (Reinstein and Snyder, 2005) and information

received from peers (Moretti, 2009) have significant effects on individuals’ consumption

decisions. Hilger, Rafert and Vilas-Boas (2011) conduct a field experiment to investi-

gate how consumers respond to expert opinion labels for wine. They find that demand

decreases for low-scoring wines and increases for high-scoring wines. There are papers

that examine dining choices. Both Luca (2011) and Anderson and Magruder (2012) use

regression discontinuity designs to estimate the effects of online reviews from Yelp.com

on demand for dining. Cai, Chen and Fang (2009) conduct a field experiment and find

                                            7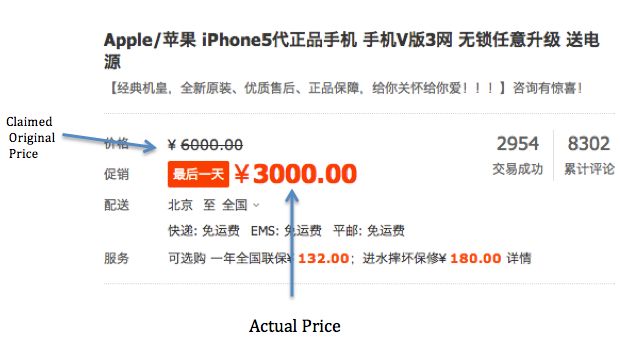
that customers who receive information about a restaurant’s most popular dishes tend

to order those dishes. Hubbard (2002) examines how reputational incentives work in

the California vehicle emission inspection market. The author finds that consumers are

more likely to return to a firm at which they previously passed than to one at which they

previously failed. He also shows that consumer demand is sensitive to a firm’s failure

rate across all consumers.

   Although the effects of reputation on consumer behavior have been well studied, only

a few works attempt to investigate seller behavior with regard to maintaining reputation.

Cabral and Hortaçsu (2010) show that subsequent negative feedback ratings arrive 25

percent more frequently following the first negative feedback the seller receives. They

argue that when a seller’s reputation is high, the incentive to invest in maintaining

reputation is also high. By contrast, when a perfect record is stained by the first negative

feedback, sellers are less motivated to deliver satisfactory services. They also find that

sellers invest in building a reputation as a buyer and then use that reputation as a seller.

Moreover, a seller is more likely to exit the market the lower his reputation. Right before

exiting, sellers receive more negative feedback than their lifetime average. Fan, Ju and

Xiao (2013) investigate sellers’ activity in managing reputation at different stages. They

conclude that when new sellers reach a certain level of reputation, they engage in active

reputation management, such as cutting prices to generate more sales. These activities

can reduce the survival likelihood of new sellers.

   Elfenbein, Fisman and McManus (2012) develop a two-period signaling model to

show that charity is an effective quality signal and yields a price premium. There are

three types of sellers in this model: good sellers who get utility from charity and always

exert effort (by paying a cost) to make sure that the product works; opportunistic

sellers who get no utility from charity and only exert effort when doing so is financially

profitable; ethical sellers who get no utility from charity and always exert effort to ensure

the quality of products. The crucial assumption of this model is a positive correlation

                                             8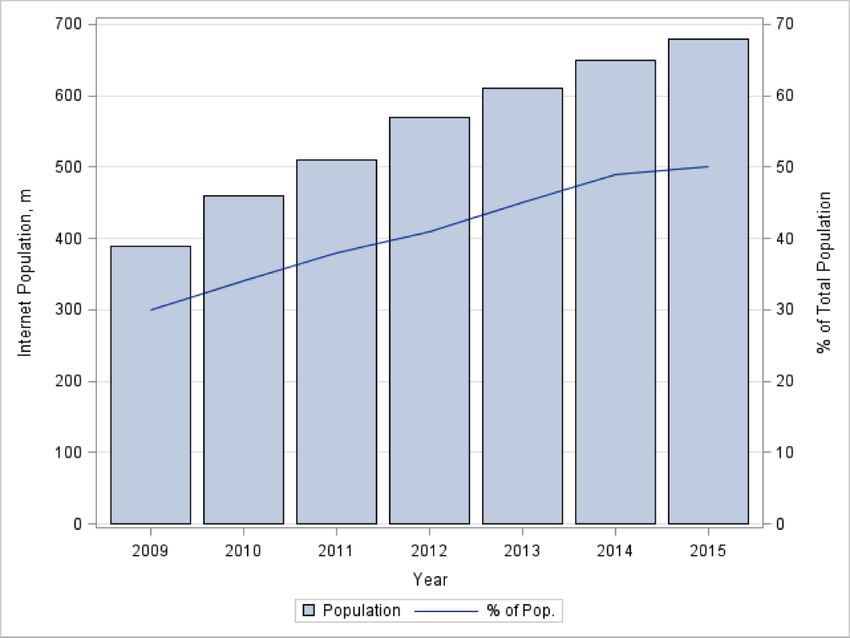
between a seller’s utility from charity and his disutility from behaving opportunistically

towards consumers. There are two key predictions. First, in a separating equilibrium,

charity is a quality signal. Second, when the cost of exerting effort is not too low, the

charity premium declines when feedback reveals opportunistic sellers. The empirical

evidence of this paper shows that consumers respond positively to products tied to

charity, particularly for sellers that are relatively new and hence have limited alternative

means of assuring quality.

      Empirical literature that investigates reputation mechanism design is sparse. Klein,

Lambertz and Konrad (2013) apply eBay data and conduct a natural experiment to

study the effects of improvements in market transparency on seller behavior. They

find that consumer satisfaction increases when market transparency increases. The au-

thors conclude that a reduction in informational asymmetry improves seller performance

through a reduction in moral hazard.

3 TAOBAO REPUTATION MECHANISM

3.1 The History of Taobao Marketplace

China’s e-commerce market has been growing rapidly since 2003 as shown in Figure 1.

In 2012, it surpassed America’s in value, with a total value of 200 billion USD. In the

same year, the number of Chinese online shoppers surged to 250 million. However, there

is substantial room for growth. Online penetration in China was 45 percent in 2012 as

shown in Figure 2, well below the 70 percent or higher seen in developed economies.           1

      Taobao Marketplace (Taobao.com) was established in 2003 and is operated by China’s

Alibaba Group. Taobao Marketplace facilitates consumer-to-consumer (C2C) retail by
  1
     “The World’s Greatest Bazaar.”
Source: The Economist
URL: http://www.economist.com/news/briefing/21573980-alibaba-trailblazing-chinese-internet-giant-
will-soon-go-public-worlds-greatest-bazaar
Accessed: 08/19/2014

                                               9
Figure 1: Growth of E-commerce Sales in China
Figure 2: Growth of Internet Penetration in China
10providing a platform for small businesses and individual entrepreneurs to open online
retail stores that mainly cater to consumers in China, Hong Kong, Macau, and Taiwan.
For the fiscal year ending on March 31, 2013, the combined GMV of Taobao Marketplace
and Tian Mao (an affiliated website owned by Alibaba) exceeded 170 billion USD, which
is about 2.3 percent of China’s 2012 GDP.
Developed as an eBay equivalent in China, sellers in Taobao Marketplace are able
to list new and used goods for sale either through an auction format or a posted-price
format. Unlike eBay, the overwhelming majority of the products sold in Taobao Market-
place are brand new items with a posted-price; auctions make up a very small percentage
(less than 2 percent) of transactions. The way that Taobao generates revenue also differs
from eBay. eBay charges a listing fee when a seller lists an item on eBay and a final
value fee when an item sells, while Taobao Marketplace does not charge any fee for listing
(either new or used items). Taobao allows sellers to advertise their products by paying
to be listed as featured products on the home page or as recommended products on the
search page. Prices to advertise in the center of Taobao Marketplace’s home page can be
as high as 25,000 USD per day. Taobao also generates revenue from selling various tools
to sellers. One of the common tools is the Display Helper, which improves the layout of
a seller’s store page. Another one is the Promotion Helper, which facilitates promotions
(see Section 3.2).
In 2008, Tian Mao (Tmall.com), a business-to-consumer (B2C) platform was launched
by Alibaba. In 2010, an independent web domain, Tmall.com, was created for Tian Mao
to differentiate listings by its merchants, who are either brand owners or authorized
distributors, from Taobao’s C2C merchants.2 Although Taobao Marketplace was estab-
lished as a C2C platform and Tian Mao was launched as a B2C platform, products from
2
“Alibaba Group to Split Taobao Online Retail Unit into Three.”
Source: Bloomberg L.P.
URL:http://www.bloomberg.com/news/2011-06-16/alibaba-group-to-split-taobao-online-shopping-
mall-into-three-companies.html
Accessed: 09/02//2014
11Figure 3: Financial Report of Alibaba from 2009 - 2012
Table 1: 2012 Financial Reports of Alibaba, Amazon and eBay
2012, $bn Revenue Net Profit/Loss GMV
Alibaba 4.1 0.5 171.2*
Amazon 61.1* -0.04 87.8
eBay 14.1 2.6* 67.8
*leader in each category
both Taobao Marketplace and Tian Mao display on the Taobao search page.
Taobao has come to dominate Internet retailing in China and will likely become the
biggest e-commerce market in the world. As shown in Figure 3, Taobao.com accounted
for a 90 percent share of China’s C2C online retail market in 2011, while Tian Mao
accounted for a 51 percent share of the B2C online retail market. Both the revenue
and profit of Alibaba have grown rapidly since 2008. Revenue increased from 2.3 to 4.1
billion USD and net profit grew from 0.2 to roughly 0.5 billion USD between 2011 and
2012.
12Table 1 compares the revenue, net profit and GMV of Alibaba, Amazon, and eBay.
In 2012 Amazon obtained the highest revenue, eBay had the highest profit, and Alibaba
(including Taobao Marketplace and Tian Mao) enjoyed the highest GMV among the
three.
3.2 Sales Format of Taobao Marketplace
Although Taobao Marketplace is similar to eBay in many ways, the major sales format
in Taobao differs from eBay. Sellers on eBay offer their goods brand new or used through
listings that may be: true auctions in which bids are collected until a specified ending
time (usually 7 days after the auction begins); posted-price listings in which the seller
specifies a price and ending date, often 30 days or more later; or a hybrid form in which a
true auction also includes a “buy-it-now”. For auction-style listings with the Buy-it-Now
option, a buyer has the chance to purchase an item immediately before bidding starts.
Once someone bids, the Buy-it-Now option disappears and bidding continues until the
listing ends, with the item going to the highest bidder.
Sellers on Taobao Marketplace can sell a brand new or used product by using an
auction or a posted-price format. Taobao offers free listings to sellers and sellers can
select 7 or 14 days as the listing period for either format. Taobao automatically renews
the listings so that they never expire unless a seller manually removes them. Auctions
account for less than 2 percent of total transaction volume, and thus this study only
focuses on brand new merchandise sold at a posted-price.
In order to attract consumers and promote sales, sellers in Taobao Marketplace have
promotions from time to time. Common promotions include price cuts, vouchers with
purchase, or gifts with purchase.
During the price cut promotion, sellers usually claim that the price cut is temporary
in order to attract more buyers. In order to make the price cut visible and noticeable
to consumers, a seller may use a tool developed by Taobao called Promotion Helper.
13Figure 4: Price Cut
Taobao charges a small fee for this tool. This fee is usually a monthly flat-rate fee and
the tool can be applied to several products up to a limit. When the seller uses this tool
to establish a price cut promotion, both the original price and the actual price display on
the product page. It is important to point out that the original price displayed oftentimes
may not be the actual original price and sellers tend to claim a very high original price
to make the price cut significant. Price cuts in Taobao resemble marketing strategies
in traditional markets: a seller increases the original price before having a price cut in
order to make the discount appear significant. Hence, this type of promotional activity
in Taobao can be considered advertisement and the service fee charged by Taobao can
be interpreted as advertisement cost.
Figure 4 is an example of the price cut of an iPhone5. The seller sets 6,000 RMB
(1,000 USD) as the claimed original price and 3,000 RMB (500 USD) as the actual price.
Thus the claimed original price is not informative to the researcher. The actual price is
reflected by transaction records and thus recorded by the researcher.
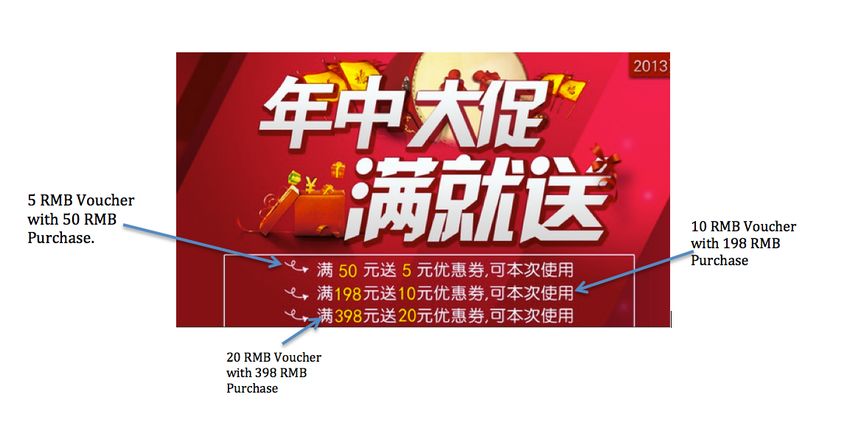
Voucher with purchase is also a common promotion in Taobao Marketplace. A
14Figure 5: Money Voucher with Purchase
money voucher is issued when a buyer purchases a certain item from the seller or his
order exceeds a certain value. Vouchers can be used with the same seller in current or
subsequent purchases. When the voucher is applied, the value (of the voucher) will be
subtracted from the total at checkout. The value of the voucher is usually small (about
1-10 percent of the total value of the order).
Figure 5 is a promotion banner for voucher with purchase. When the value of an
order is above 50 RMB (8.5 USD), 198 RMB (33 USD), or 398 RMB (66 USD), a
voucher that is worth 5 RMB (0.85 USD), 10 RMB (1.7 USD), or 20 RMB (3.5 USD),
respectively, will be issued to the buyer and can be applied to the current purchase.
This promotion is unobserved by the researcher because the transaction record only
shows the price before vouchers are applied. Also, the promotion banners are displayed
on a product page in terms of pictures instead of texts. It is extremely difficult for
a software to record the information of this promotion. Promotions of voucher with
purchase only last for a short period of time, usually no longer than a week. When the
promotion ends, the seller simply removes the promotion banner from the product page.
15Figure 6: Gift with Purchase
Another promotion in Taobao Marketplace is gift with purchase. A buyer gets a free
gift when he purchases a specific product or his order exceeds a certain value. Figure 6
is a promotion banner for gift with purchase. In this example, purchase of an iPhone5
comes with a free portable iPhone5 charger, a pair of ear buds, an iPhone5 case and a
screen protector. Similar to voucher with purchase, gift with purchase is unobserved to
the researcher. Gift with purchase changes over time because sellers tend to constantly
change the contents of the gifts.
3.3 Feedback System of Taobao
Both Taobao and eBay have well-established rating systems so that buyers can track how
sellers performed in previous transactions. The biggest difference between the rating
systems of Taobao and eBay is that Taobao displays both product specific feedback
ratings and comments on the product page. Buyers on Taobao can track not only the
16Figure 7: Seller Profile on Taobao
overall performance of a seller, they can also track seller performance with regards to a
specific product.
On each seller profile page on Taobao, one can see a seller’s ID, location, the date
when the ID was created, a seller’s total feedback score, and crowns (or hearts) as
shown in Figure 7. A feedback score of at least 4 earns a seller a heart. As feedback
score increases, the icon will change to a diamond, then a blue crown, and eventually
transform all the way to five yellow crowns for a score above 10,000,000 as shown in
Figure 8.
Similar to eBay, Taobao displays recent feedback ratings, including feedback that a
seller has received in the last 1 week, 1 month, 6 months, and prior to the last 6 months
as shown in Figure 9. The positive feedback rating ratio is displayed as the percentage
of positive ratings left by members. It is calculated by dividing the number of positive
ratings by the total number of ratings.
Detailed seller ratings (Figure 10) on Taobao include three components: item as
described, attitude of the seller, and shipping speed. Buyers are asked to rate the seller
17Figure 8: Seller Rating on Taobao
Figure 9: Seller Feedback on Taobao
18Figure 10: Detailed Seller Ratings on Taobao
in each of these categories with a score of one to five stars, with five being the highest
rating and one the lowest. These ratings do not count toward the overall feedback score
and they are anonymous. The seller cannot trace detailed seller ratings back to the
buyer who left them. When the seller’s score is above or equal to the average score on
Taobao Marketplace, the score is labeled in red. Otherwise it is labeled in green.
Lei (2011) addresses the importance of controlling for the product specific dimension
of reputation. One important advantage of using Taobao data is the direct observation of
the product specific reputation measure. Product specific feedback contains information
with respect to the seller’s performance in the sale of a specific product, including the
quality of the product sold and the service provided by the seller.
Figure 11 shows the layout of product specific ratings on Taobao. On the product
feedback page, one can read off the number of buyers that left a positive, neutral, and
negative comment since the date the seller started to sell that product. A buyer can read
all the comments that are displayed in reverse chronological order. One can also choose
to read only the positive, neutral, or negative comments by selecting their respective
tabs. Next to each comment given to a seller, the ID of the buyer giving the comment
is shown. It also shows what product is purchased by this buyer, the date of purchase,
19Figure 11: Product Specific Ratings on Taobao
and the transaction price.
Feedback ratings and comments on Taobao can be revised in some cases. A seller
may ask a buyer to revise the negative feedback that he left. If the buyer agrees to do so,
he can either change his negative (or neutral) feedback to positive or delete the feedback
as long as the feedback is less than 30 days old. Once feedback has been left for more
than 30 days, it cannot be revised or deleted. Positive feedback cannot be changed.
Only neutral or negative feedback can be revised or deleted. Unlike eBay, detailed seller
ratings on Taobao cannot be revised.
3.4 Taobao University
Taobao University is an affiliation of Taobao marketplace that offers training in order
to improve sellers’ business on Taobao. The training courses, either taught locally or
online, target a broad range of sellers. For beginners, training may focus on the basics
20of selling on Taobao, including payment methods, how to create listings and complete
transactions, and so on. For advanced sellers, training may address inventory and lo-
gistics, promotions, advertisement, and other marketing issues. Similarly, eBay offers
training for sellers through eBay University.
4 Data
I focus on the products of iPhone5 because of the following reasons. (1) the transaction
volume of the brand new iPhone5 on Taobao is high; (2) the iPhone5 is a relatively
expensive product and consumers care about its quality; (3) the iPhone5 is almost
homogenous in the sense that there is not much variation among individual units. The
heterogeneity of the product is mainly the quality of the service delivered by the sellers.
I use a java program to record the history of transactions of the iPhone5 between
May 12, 2013 and July 29, 2013 on both Taobao.com. Data are collected daily at
the same time. Data extraction involves the following steps. Transactions related to
the iPhone5 are identified through the search results on Taobao.com with the keyword
“iPhone5”. I then exclude used items and include only brand new items in the search.
Lastly I make sure that the data sample includes no other products beside the iPhone5.
Particularly, I drop iPhone5 accessories and other models of iPhones, such as the iPhone4
and iPhone4S. In the end, I am left with 11,941 observations.
For each day, I observe the price and quantity sold of each iPhone5. I also observe
both the seller specific and the iPhone5 specific reputation measures. The seller spe-
cific reputation measures include the quantity of all the positive, neutral, and negative
feedback they receive since the day he registered. Besides, I observe the detailed seller
ratings that include scores for item as described, attitude of the seller, and shipping
time. For the iPhone5 specific reputation measures, I observe both the quantity and
contents of the positive, neutral, and negative feedback left toward the product. I also
21observe the cumulative sales of the iPhone5 in the past 30 days.
5 Demand and Supply in the Taobao iPhone5 Market
Consumers and sellers of iPhone5s interact in Taobao Marketplace. Consumers choose
a product that maximizes their utility. Sellers choose optimal prices and reputation to
maximize profits. A seller can choose to maintain a good reputation by choosing to
provide high quality service. A buyer who receives services of good quality will leave
positive feedback. On the contrary, if a seller chooses to squander his reputation by
providing a product of bad quality, the buyer will leave negative feedback. Therefore,
feedback should be a good measure for quality provision.
5.1 The Demand for iPhone5s
The demand model follows Berry (1994) and Klier and Linn (2012). Begin with the
utility function of consumer i for product j at time t:
Uijt = Xjt β − αpjt + ηj + ξjt + ijt (1)
Assume there are no random coefficients in the model. Xjt is a vector of characteristics of
product j at time t, where j = 0, 1, 2..., Jt and t = 1, ..., 79 (Day 1 to Day 79 throughout
the observation period). Specifically, Xjt includes seller specific reputation measures
and iPhone5 specific reputation measures. β is a vector of regression coefficients for the
reputation measures, Xjt . pjt is the price of product j at time t and α is the regression
coefficient of price. Unobserved time-invariant product characteristics are denoted by
ηj . ξjt can be thought of as the mean of the consumers’ valuation of the time-varying
unobserved product characteristics of product j at time t. ijt is i.i.d. across products
and consumers and follows the extreme value distribution.
Demand follows a nesting structure, with the outside good defined as the purchase
22of an iPhone5 on Tian Mao. Consumer taste is assumed to follow an extreme value
distribution. This allows for more flexible substitution patterns as compared to the
simple logit model. Products are grouped into L exhaustive and mutually exclusive
sets based on essential characteristics (with details provided below). The outside good,
j = 0, is assumed to be the only member of group 0.
Under the nested logit structure, the error term includes a common shock for all
products within a group, and an idiosyncratic term. Assuming that product j belongs
group k, i.e., j ∈ Bk , the error term can be written as
ijt = ωikt + (1 − σ)φijt , (2)
where ωikt is the shock for an iPhone5 in group k at time t; σ is the similarity coefficient,
which represents the extent to which consumers receive similar shocks within a group at
time t, and φijt is the idiosyncratic shock for consumer i and product j at time t. The
class shock for consumer i is the same for all products within a nest. As σ approaches
1, the within group correlation of utility goes to 1. As σ approaches 0, the within group
correlation goes to 0 and the nested logit model collapses to the simple logit model.
Iphone5s are divided into 11 different groups based on version and memory size (see
Section 6 for more details). They are 16 Gigabyte (G) Chinese (CHN), 16 G European
(EUR), 16 G Hong Kong (HK), 16 G Japanese (JP), 16 G United States (US), 32 G
CHN, 32 G HK, 32 G JP, 32 G US, 64 G CHN, and 64 G JP.
The nested logit specification is written as
ln(sjt ) − ln(s0t ) = Xjt β − αpjt + ηj + σln(sj|Bk t ) + ξjt (3)
Eq.(3) can be estimated by linear regression and the nesting structure partially relaxes
the independence of irrelevant alternatives (IIA) assumption of the basic logit model.
However, Eq.(3) imposes restrictions on cross price demand elasticities, and the IIA
23assumption is maintained within a nest.
5.2 The Supply of iPhone5s
The supply model is assumed static, following Klier and Linn (2012). The model contains
one period in which a set of multiproduct sellers selects prices and reputation to maximize
their profits. Reputation is measured by the iPhone5 specific positive feedback ratio.
Sellers compete in a Bertrand-Nash manner, choosing optimal prices and reputation
while taking as given the prices and reputation of iPhone5s sold by other sellers. Each
seller is subject to a reputation constraint, which restricts the iPhone5 positive feedback
ratio to lie in a particular interval. I assume that this constraint is not binding in
equilibrium. This assumption is relaxed in the counterfactual analyses.
Seller s (s = 1, 2, ...St ) may sell more than one version of the iPhone5. For instance,
product j (e.g., US Version 16G) and j0 (e.g., Japanese Version 16G) are sold by seller
s. Although product j and j 0 are treated as different products, they share the same
iPhone5 specific rating.
At time t seller s maximizes his profit by choosing prices and reputation. There are a
lower bound and an upper bound for the iPhone5 positive feedback ratio chosen by seller
s at time t. The lower bound is constructed by choosing low quality for all products
sold, while the upper bound is constructed by choosing high quality for all products sold
at time t. More details on the quality constraint are given in Section 5.3.
The profit maximization problem for seller s at time t is written as
X
maximize ust = (pkt − mckt )Mt skt (pkt , qkt ) − F Cst − C(qst )
p̄st ,qst
k∈Js (4)
LB UB
subject to qst ≤ qst ≤ qst , s = 1, . . . , S.
where seller s chooses p̄st and qst to maximize his profit at time t when he takes other
sellers’ decisions as given. p̄st is a vector of prices of products sold by seller s at time t,
24i.e., p̄st = (p1st , p2st , ..., pN st ). qst is the reputation chosen by seller s at time t. mcnt is
the marginal cost for product n. Mt is the market size at time t. F Cst is the fixed cost
LB and q U B are the lower bound and upper bound, respectively,
for seller s at time t. qst st
of the reputation chosen by seller s at time t.
C(qst ) can be interpreted as the value added to the raw product, which measures the
cost of maintaining reputation at different levels. It is more costly, in terms of money
and time, for a seller who invests efforts to ensure the quality of products and services
than those who do not. For instance, a reputable seller may carefully pack his goods,
ship them out promptly, and offer exchange if products fail to work. On the contrary, a
mediocre seller is more likely to pack his products carelessly, delay shipment, or fail to
resolve problems. Consumers are assumed to have identical expectation and perception
about the quality of the actual iPhone5 and the variation of consumer satisfaction mainly
comes from these additional services provided by sellers.
The Lagrangian of Eq.(4) can be written as
X
L (p̄st , qst ) = (pnt − mcnt )Mt snt (pnt , qst ) − F Cst − C(qst )
n∈Ss (5)
UB LB
− λ1st (qst − qst ) − λ2st (−qst + qst )
The Kuhn Tucker conditions for product j are as follows.
X ∂snt
sjt (pjt , qst ) + (pnt − mcnt ) =0 (6)
∂pjt
n∈Ss
X ∂snt
(pnt − mcnt )Mt − C 0 (qst ) − λ1st + λ2st = 0 (7)
∂qst
n∈Ss
UB UB
λ1st ≥ 0, qst − qst ≤ 0, λ1st (qst − qst )=0 (8)
25LB LB
λ2st ≥ 0, qst − qst ≥ 0, λ2st (qst − qst )=0 (9)
I assume that the cost of reputation maintenance takes the following form
1 2
C(qst ) = mst qst − Zst (10)
2
where mst and Zst are seller specific constants and both positive. Marginal cost of
reputation maintenance, C 0 (qst ), is increasing with qst .
5.3 Reputation Constraint
Without any constraint, the highest reputation a seller can choose at time t is 1 and the
lowest reputation is 0. In fact, a seller’s positive feedback ratio at time t is restricted by
both the accumulated ratings up to time t − 1 and the maximum quantity that can be
potentially sold at time t.
Consider the following example. A seller has had 100 positive ratings and 1 negative
rating at time t − 1. Suppose the seller can sell up to 10 units per day. If he provides
satisfactory quality to buyers for all 10 units sold at time t, he will reach the upper bound
100+10
of reputation, which is calculated as 100+1+10 = 0.991. If he provides low quality for all
the 10 units, his reputation at time t will reach the lower bound, which is calculated as
100
100+1+10 = 0.901.
Recall that Taobao allows buyers to revise or delete negative feedback when the
feedback is less than 30 days old. For instance, suppose a seller has 100 positive ratings
and 1 negative rating which is less than 30 days old at time t − 1. Then at time t the
upper bound of his quality constraint is 1 because the negative rating could be removed.
The maximum quantity sold during a 1 week period is used to proxy for the maximum
possible quantity sold at time t.
26Qst = max {Qst−3 , Qst−2 , Qst−1 , Qst , Qst+1 , Qst+2 , Qst+3 } (11)
where Qst is the maximum possible quantity sold at time t. Therefore, the reputation
constraint for seller s at time t is calculated as
LB Gst−1
qst = (12)
Gst−1 + Nst−1 + Qst
R
Gst−1 + Qst + Nst−1
UB
qst = (13)
Gst−1 + Nst−1 + Qst
Where Gst−1 and Nst−1 are the number of accumulated positive and negative ratings
R
of seller s, respectively, at time t − 1. Nst−1 is the number of negative feedback that can
R
be revised at time t. Njt−1 ≤ Nst−1 .
5.4 Demand Estimation
The difficulty in estimating demand models lies in endogeneity. Some of the time-
varying promotions in Taobao Marketplace are unobserved (to the researcher) and these
promotions may be correlated with the independent variables in Eq.(3). Therefore,
estimating this equation by ordinary least squares (OLS) would yield biased estimates.
One approach to tackle endogeneity is to include product fixed effects. Assuming that
unobserved characteristics do not change over time, fixed effects models yield unbiased
estimates. For instance, some sellers have better writing skills or communication skills.
Some sellers are better at designing web pages. These unobserved factors are unlikely
to change over time and would be eliminated by fixed effects. This assumption is not
appropriate in my demand model because some of the unobserved characteristics may
change over time.
As discussed in Section 3.2, there are several types of time-varying promotions in
27Taobao Marketplace. Both the promotions of voucher with purchase and gift with pur-
chase can vary over time. A seller can easily change the gift or the value of the money
voucher. When a promotion ends, he simply removes the promotion banner on the prod-
uct page. Although the value of the gift or the money voucher is small, these promotional
activities become confounding factors in the error term, and thus the error term is cor-
related with one or more explanatory variables in the demand estimation. In order to
further control for endogeneity, an instrumental variable (IV) strategy is proposed.
There are two endogenous variables in the nested logit model: pjt and sj|Bk t . The
unobserved time-varying promotions are captured by the error term ξjt . Intuitively,
promotional activities affect sellers’ pricing decisions and thus ξjt and pjt would not be
mean independent.
An example to consider is the time-varying free gift with purchase. When a buyer
purchases an iPhone5 from the seller, he gets a free iPhone5 case for free. The buyer’s
willingness to pay for this iPhone5 may increase because the purchase comes with a
free iPhone5 case. Thus it is possible that the seller charges a slightly higher price. An-
other time-varying unobserved promotional activity is the money voucher with purchase.
When a buyer gets a money voucher with purchase, the seller may increase the price of
the product and thus price would be correlated with the error term.
The second endogenous variable is sj|Bk t . Imagine there are two phones that belong
to the same group but are sold by two different sellers. One may be more popular than
the other and thus have a higher within-group share if the purchase comes with a free
gift. This promotion is unobserved to the researcher but correlated with the within-
group share. Therefore, it suggests the need for additional exogenous variables that are
correlated with sj|Bk t .
Two classes of IVs are used to control for endogeneity. A standard approach is
to follow Berry (1994) and use characteristics of products sold by other sellers in the
same nest. Ave P os M on N estst is the average seller specific positive ratio for all other
28sellers in the same group over the past month. This variable is likely to be correlated
with both endogenous variables. The better the reputation of all other sellers, the
smaller the within-group share one enjoys. If all other sellers have higher reputation,
one is very likely to set a lower price to compete with other sellers and attract more
customers. Therefore, Ave P os M on N estst should be negatively correlated with both
price and within-group share. Ave P os M on N estst would be a valid instrument if a
seller’s promotion decision is not affected by the average reputation of all other sellers
in the same group.
The second class of instrumental variables includes two lagged variables. pastsalesst−7
is the cumulative 30-day sales of iPhone5s before time t−7, i.e., pastsalesst−7 = salesst−8
+salesst−9 + . . . + salesst−37 . The social learning literature suggests that a buyer tends
to follow other buyers’ choices. If that is the case, a consumer tends to buy from a seller
who has had strong sales in the past. Thus the lag of past sales is likely to be positively
correlated with the current within-group share. What is more, this lagged variable is
likely to be correlated with price. A seller may set a higher price if he has had strong
sales and developed a good reputation.
While being correlated with two endogenous variables, pastsalesst−7 is unlikely to be
correlated with ξjt . Recall that the error term consists of unobserved time-varying pro-
motions. A promotion in general lasts no longer than a week and thus errors that are at
least a week apart are unlikely to be correlated. The closest component of pastsalesst−7
to the error term is salesst−8 , the sales 8 days ago. This variable is most likely uncor-
related with the error term if the unobserved promotion lasts no longer than a week.
Even for the very rare case where an unobserved promotion lasts longer than a week,
the structure of this lagged variable (being the sum of 30-day sales) would attenuate its
correlation with the error term.
Another instrumental variable is pjt−10 , the price of product j 10 days ago. Since
the price of an iPhone5 fluctuates within a small range in a relatively short period,
29pjt−10 is very likely to be positively correlated with the current price, pjt . And since
the unobserved promotional activities do not last more than a week, pjt−10 is unlikely
to be correlated with ξjt . The reason why pjt−7 is not selected as an instrument is that
if a promotion lasts a little longer than a week, pjt−7 might be correlated with the error
term. In order to be conservative, pjt−10 , instead of pjt−7 , is used as an IV.
5.5 Supply Estimation
Estimates of the marginal cost of an iPhone5 and marginal cost of reputation mainte-
nance can be determined by estimation of supply. First, we need to solve for the marginal
cost of an iPhone5, mc, by using Eq.(6). This can be written in vector form as:
s.t (p.t , q.t ) + Ω.t (p.t − mc.t ) = 0 (14)
where s.t , p.t and q.t are J by 1 vectors. Ω.t is a J by J matrix. Each element of Ω.t
can be written as Ωjrt = Ω∗jrt · ∂srt
∂pjt . The indicator, Ω∗jrt , equals 1 if alternative r and
alternative j are sold by the same seller, and equals 0 otherwise.
For example, there are five alternatives sold by two sellers. Alternative 1, 2 and 3
are sold by Seller 1. Alternative 4 and 5 are sold by Seller 2. Then Eq.(14) will take the
following form:
∂s1t ∂s2t ∂s3t
s1t ∂p1t ∂p1t ∂p1t 0 0 p1t − mc1t
∂s1t ∂s2t ∂s3t
s2t 0 0 p2t − mc2t
∂p2t ∂p2t ∂p2t
s + ∂s1t ∂s2t ∂s3t p − mc =0
3t ∂p3t ∂p3t ∂p3t 0 0 3t 3t
∂s4t ∂s5t
s4t 0 0 0 p4t − mc4t
∂p4t ∂p4t
∂s4t ∂s5t
s5t 0 0 0 ∂p5t ∂p5t p5t − mc5t
mc.t can be solved by Eq.(14):
30mc.t = Ω−1
.t · s.t + p.t (15)
Next we solve for the marginal cost of reputation maintenance, C 0 (qst ), by using
Eq.(7), which can be written in vector form as
C 0 (q.t ) + λ1.t − λ2.t = Mt · Φ.t · (p.t − mc.t ) (16)
∂s
where C 0 (q.t ), λ1.t , and λ2.t are S by 1 vectors. Φ.t is a S by J matrix. Φsjt = Φ∗sjt · ∂qst
jt
.
Φ∗sjt = 1 if alternative j is sold by the s and Φ∗sjt = 0 otherwise.
Using the same example above, Eq.(16) takes the following form
p − mc1t
1t
p − mc
2t 2t
0 ∂s1t ∂s2t ∂s3t
C (q1t ) + λ11t − λ21t 0 0
∂q1t ∂q1t ∂q1t
= Mt · p3t − mc3t
0 ∂s4t ∂s5t
C (q2t ) + λ12t − λ22t 0 0 0 ∂q2t ∂q2t
p4t − mc4t
p5t − mc5t
LB , does not bind in my sample so λ
The lower bound of reputation, qst 2st = 0 for
U B , we know λ
all observations. For observations that have qst = qst 1st ≥ 0. However, I
assume that the reputation constraints do not bind for all observations in the estimation,
that is, λ1st = 0. Under this assumption, Eq.(16) is written as
C 0 (q.t ) = Mt · Φ.t · (p.t − mc.t )
The derivative of the market share of product j with respect to the price of product
j can be written as
31
                            ∂sjt   ∂Vjt             1     σ
                                 =      · sjt ·        −     ·s      − sjt                (17)
                            ∂pjt   ∂pjt           1 − σ 1 − σ j|Bk t

   The derivatives of the market share of product j and r with respect to reputation

can be written as


                            ∂sjt   ∂Vjt             1     σ
                                 =      · sjt ·        −     ·s      − sjt                (18)
                            ∂qst   ∂qst           1 − σ 1 − σ j|Bk t


                            ∂srt   ∂Vrt             1     σ
                                 =      · srt ·        −     ·s      − srt                (19)
                            ∂qst   ∂qst           1 − σ 1 − σ r|Bh t

where product j and r are sold by the same seller s. Product j belongs to nest k, i.e.,

j ∈ Bk . Product r belongs to nest h, i.e., r ∈ Bh . Eq.(19) holds when k = h or k 6= h.

The demand coefficients of price and the iPhone5 specific positive feedback ratio are
            ∂Vjt         ∂Vjt         ∂Vrt
given by    ∂pjt   and   ∂qst   (or   ∂qst )   , respectively.

   For the cross derivative of the market share of product r with respect to the price
                   ∂srt
of product j,      ∂pjt ,   where alternative j and alternative r belong to two different nests

(k 6= h),

                                               ∂srt    ∂Vjt
                                                    =−      · srt · sjt                   (20)
                                               ∂pjt    ∂pjt

   If alternative j and alternative r belong to the same nest, i.e., k = h, the cross
              ∂srt
derivative,   ∂pjt ,   become


                                 ∂srt   ∂Vjt                 −σ
                                      =      · srt               ·s      − sjt            (21)
                                 ∂pjt   ∂pjt                1 − σ j|Bk t

                                                          32
Table 2: Summary Statistics
Variable Definition Mean STD Min Max Obs
Qjt Quantity Sold 5.8222 9.89 0 83 8,047
Q0t Quantity Sold in Tian Mao 65.7636 32.82 9 162 69
sjt Market Share 0.0070 0.01 0.0906×10⁻⁴ 0.1084 8,047
sj|Bk t Within Group Market Share 0.0751 0.16 0.0242 ×10⁻³ 0.9992 8,047
s0t Market Share of Tian Mao 0.0772 0.04 0.0108 0.1655 69
positivest No. of iPhone5 Specific Positive Feedback with Comments 1,286.5580 1,894.75 14 8,875 4,934
positive wost No. of iPhone5 Specific Positive Feedback without Comments 2,095.5220 2,998.13 21 16,090 4,934
neutralst No. of iPhone5 Specific Neutral Feedback 7.0199 20.56 0 138 4,934
negativest No. of iPhone5 Specific Negative Feedback 7.0969 20.23 0 181 4,934
positivest
posratiost positivest +neutralst +negativest 0.9914 0.01 0.8750 1 4,934
1
Dst Item as Described 0.7940 0.40 0 1 4,934
2
Dst Seller Attitude 0.6923 0.46 0 1 4,934
3
Dst Shipment Speed 0.7172 0.45 0 1 4,934
1 +D 2 +D 1 )
(Dst
Ave Dst 3
st st
0.7345 0.40 0 1 4,934
posmonst No. of Seller Specific Positive Feedback 932.8577 1,357.55 11 14,011 4,934
neumonst No. of Seller Specific Neutral Feedback 3.2586 5.99 0 73 4,934
negmonst No. of Seller Specific Negative Feedback 2.9305 4.86 0 35 4,934
posmonjt
posratio monst posmonjt +neumonst +negmonst 0.9934 0.01 0.8796 1 4,934
pastsalesst Cumulative Sales in the Past 30 Days 515.9979 647.46 20 3,175 4,934
logpastsalesst Log of Cumulative Sales in the Past 30 Days 5.5504 1.20 2.9957 8.0631 4,934
Pjt Price (USD) 693.3588 80.28 501 1,003.167 8,047
6 Summary Statistics
Table 2 reports summary statistics for the key variables of the model. The dependent
variable in the demand estimation is defined as ln(sjt ) − ln(s0t ). sjt is the market
share of product j at time t, defined as the ratio of quantity sold of product j to the
combined total quantity sold in Taobao and Tian Mao at time t. Note that if the
quantity sold of a listed product is zero at time t, 0.01 unit instead of zero, is used to
calculate sjt . sj|Bk t is the within group share of product j at time t in group k and
is calculated by dividing the quantity sold of product j at time t by the total quantity
sold of group k at time t. If the actual quantity sold at time t is zero, 0.01 is used
as the quantity to calculate sj|Bk t . s0t is the market share of the outside option, in
this case, the iPhone5 sold in Tian Mao. positivest , neutralst , and negativest are the
quantities of iPhone5 specific positive feedback (with comments left), neutral feedback,
and negative feedback, respectively. positive wost is the quantity of all iPhone5 specific
positivest
positive feedback. posratiost is calculated as positivest +neutralst +negativest over the entire
33Table 3: Frequency Counts of Products
GROUP Freq Percentage
16G CHN 1,702 21.50
16G EUR 49 0.61
16G HK 2,962 36.81
16G JP 721 8.96
16G USA 1,445 17.96
32G CHN 397 4.90
32G HK 134 1.67
32G JP 267 3.37
32G USA 94 1.17
64G CHN 136 1.69
64G JP 139 1.73
Note: No. of Observations: 8,047
transaction history of iPhone5 sold by seller s until time t. Note that iPhone5 specific
feedback does not vary across products that are sold by the same seller. The mean
of posratiost is 0.9914, indicating that the iPhone5 specific positive feedback ratio on
1 , D 2 , and D 3 ,
Taobao marketplace is high. I construct three dummy variables, Dst st st
which take the value one if the scores for item as described, attitude of the seller, and
shipping time, are respectively above the average score on Taobao. They take a value
of zero otherwise. Ave Dst is the average of these three dummy variables. Pjt is the
transaction price of the iPhone5 adjusted by shipping cost. posmonst , neumonst , and
negmonst are the quantities of seller specific positive, neutral, and negative feedback in
posmonst
the recent 1 month. posratio monst is defined as posmonst +neumonst +negmonst . The price
of an iPhone5 varies according to the version and memory size. Chinese consumers realize
additional costs when they purchase an iPhone5 that is not specifically manufactured
for the Chinese market. For instance, the Japanese version is the cheapest because it
is exclusively designed for the Japanese market. The Chinese version costs the most
because it is specifically designed for the Chinese market.
Table 3 summarizes the frequency counts of products in each group. The most
34You can also read