QUARTERLY REVIEW SECOND QUARTER ENDED JULY 31, 2021 - Investor Relations
←
→
Page content transcription
If your browser does not render page correctly, please read the page content below

QUARTERLY REVIEW SECOND QUARTER ENDED JULY 31, 2021

Forward-Looking Statements
Caution concerning forward-looking statements
Certain statements included in this presentation, including, but not limited to, relating to our Fiscal Year 2022 financial guidance (including revenues, Normalized EBITDA, Effective Tax Rate, Normalized earnings per share, net income, depreciation expense, net
financing costs adjusted, weighted average of the number of shares diluted and capital expenditures), additional production capacity through new production facilities or the reorganisation of existing facilities, the management of the supply chain to limit possible
future disruption on the operations, future retail purchase of our products, the Company's ability to convert new entrants into life-long customers, as well other statements about our current and future plans, expectations, anticipations, intentions, results, levels of
activity, performance, objectives, targets, goals, achievements, priorities and strategies, financial position, market positions, capabilities, competitive strengths, research and product development activities, including projected design, characteristics, capacity or
performance of future products and their expected scheduled entry to market or any other future events or developments and other statements that are not historical facts constitute forward-looking statements within the meaning of applicable securities laws.
The words “may”, “will”, “would”, “should”, “could”, “expects”, “forecasts”, “plans”, “intends”, “trends”, “indications”, “anticipates”, “believes”, “estimates”, “outlook”, “predicts”, “projects”, “likely” or “potential” or the negative or other variations of these words or other
comparable words or phrases, are intended to identify forward-looking statements.
Forward-looking statements are presented for the purpose of assisting investors and others in understanding certain key elements of our current objectives, goals, targets, strategic priorities, expectations and plans, and in obtaining a better understanding of our
business and anticipated operating environment. Investors and others are cautioned that such information may not be appropriate for other purposes. Investors and others should not place undue reliance on forward- looking statements made in this presentation.
Forward-looking statements, by their very nature, involve inherent risks and uncertainties and are based on a number of assumptions, both general and specific, as further described below.
Many factors could cause the Company’s actual results, level of activity, performance or achievements or future events or developments to differ materially from those expressed or implied by the forward-looking statements, including, without limitation, the factors
discussed in section "Risk Factors" of the Company's management's discussion and analysis (MD&A) for the fiscal year ended January 31, 2021 and in the Company's other continuous disclosure filings (available on SEDAR at www.sedar.com and on EDGAR at
www.sec.gov).
The forward-looking statements contained in this presentation are made as of the date of this presentation and the Company has no intention and undertakes no obligation to update or revise any forward-looking statements to reflect future events, changes in
circumstances, or changes in beliefs, unless required by applicable securities regulations. In the event that the Company does update any forward-looking statement, no inference should be made that the Company will make additional updates with respect to that
statement, related matters or any other forward-looking statement..

Key assumptions
The Company made a number of economic, market and operational assumptions in preparing and making certain forward-looking statements contained in this presentation, including the following: reasonable industry growth ranging from slightly down to up high-
single digits; market share that will remain constant or moderately increase; no further deterioration and a relatively rapid stabilization of global and North American economic conditions, including with respect to the ongoing health crisis; any increase in interest rates
will be modest; currencies will remain at near current levels; inflation will remain in line with central bank expectations in countries where the Company is doing business; the Company’s margins, excluding the impact of the wind-down of Evinrude outboard engines,
COVID-19 and supply chain constraints, will remain near current levels; the Company anticipates supply chain constraints but expects to be able to support product development and planned production rates on commercially acceptable terms; there will be no
significant changes in tax laws or free trade arrangements or treaties applicable to the Company; no trade barriers will be imposed amongst jurisdictions in which the Company carries operations; the absence of unusually adverse weather conditions, especially in
peak seasons. BRP cautions that its assumptions may not materialize and that current economic conditions, including all of the current uncertainty resulting from the ongoing COVID-19 health crisis and its broader repercussions on the global economy, render such
assumptions, although believed reasonable at the time they were made, subject to greater uncertainty.
All amounts in this presentation are expressed in Canadian dollars, unless otherwise indicated.

       QUARTERLY REVIEW
       Second Quarter Ended July 31, 2021
                                                                                                                                                                                                                                                                                           2
JOSÉ BOISJOLI
PRESIDENT
PRESIDENT  AND
          AND   CHIEF
              CHIEF    EXECUTIVE
                    EXECUTIVE      OFFICER
                              OFFICER

QUARTERLY REVIEW
SECONDQUARTER
SECOND QUARTER ENDED
              ENDED   JULY
                    JULY 31, 31,
                             20212018

   QUARTERLY REVIEW
   Second Quarter Ended July 31, 2021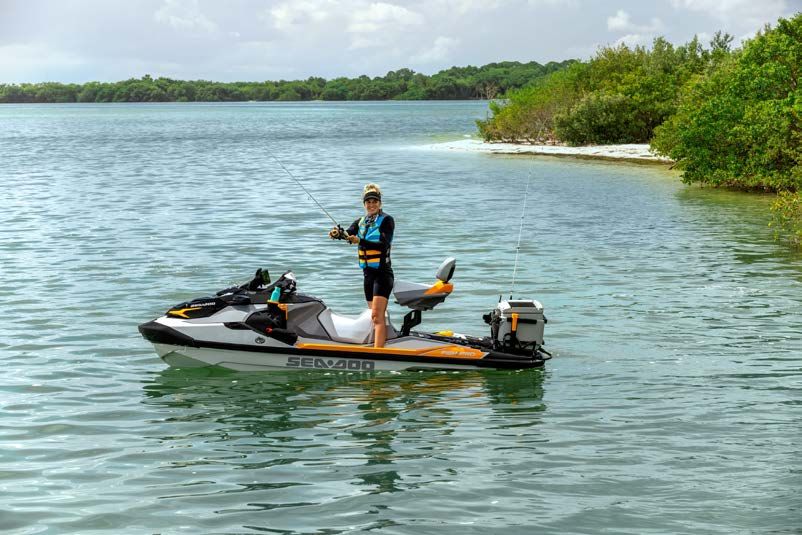
FY22 Q2 Highlights
Revenues Diluted Earnings per Share Normalized Diluted Earnings per Share[1]
CA$ millions CA$ CA$
+54% +72% +154%
$1 904 $2,46 $2,89
$1 233 $1,43 $1,14
FY21 Q2 FY22 Q2 FY21 Q2 FY22 Q2 FY21 Q2 FY22 Q2
Highlights vs. Last Year
Revenues increased 54% primarily driven by a higher volume of product sold and lower sales programs
Gross profit margin of 29.9%
Normalized EBITDA[1] was up 94% to $415M and normalized diluted earnings per share[1] was up 154% to $2.89
Net income up 69% to $213M and diluted earnings per share up 72% to $2.46
North American BRP Powersports retail sales were down 19% vs a record quarter in FY21 Q2 where retail was up 40%,
and up 14% when compared to two years ago, in FY20 Q2
[1]For a reconciliation of net income to Normalized Net Income and Normalized EBITDA, see the reconciliation table in appendix
Raising our Normalized Diluted EPS[1]
guidance range from “$7.75 to $8.50” to “$8.25 to $9.75”,
representing a growth of 53% to 81% from FY21
QUARTERLY REVIEW
Second Quarter Ended July 31, 2021
4
Retail Growth Limited by Product Availability
    North American Powersports Retail and Network Inventory                                                    FY22 Q2 North American Powersports Retail Growth
                      FY20                                   FY21                      FY22 H1
                                                                                                                    VS. FY21 Q2                         VS. FY20 Q2
      Annual Retail      Average Days        Annual Retail       Average Days         Retail   Average Days            Units                               Units
        Growth            of Inventory         Growth             of Inventory        Growth    of Inventory

          +15%           ~170 days             +25%              ~80 days        Q1   +39%     ~40 days                        INDUSTRY                            INDUSTRY

                                         Two months production
                                              suspension
                                                                                 Q2   -19%     ~26 days

                                                                                                                                                   +14%
Quarter-end
Network Inventory
                                                                                                                                                                   LOW-SINGLE
                                                                                                                                                                     DIGIT %

Quarter
Retail

                                                                                                                -19%
                                                                                                                                 MID-
                                                                                                                               THIRTY %
    Q1         Q2            Q3     Q4    Q1            Q2          Q3      Q4   Q1   Q2

 The low level of network inventory coupled with global supply chain                                            Still, we continued experiencing strong demand for our
 issues have limited our ability to grow retail in FY22 Q2, especially                                         products as we outpaced the industry and delivered retail
      when compared to a record quarter for retail in FY21 Q2                                                              that was up 14% vs. two years ago

   QUARTERLY REVIEW
   Second Quarter Ended July 31, 2021
                                                                                                                                                                                5
FY22 Q2 Powersports Retail Update
Powersports Retail Growth by Region[1] North American Powersports Retail Growth by Product Line
FY22 Q2 retail sales in units compared to FY21 Q2 FY22 Q2 retail sales in units compared to FY21 Q2
BRP VS. BRP VS.
INDUSTRY INDUSTRY
INDUSTRY INDUSTRY
NORTH AMERICA 19% MID-
THIRTY %
SIDE-BY-SIDE
VEHICLES
LOW-
TWENTY %
LOW-
FORTY %
EMEA[2] 24% LOW-
TEEN %
ALL-TERRAIN
VEHICLES
LOW-
FORTY %
LOW-
FORTY %
LATIN AMERICA 4% NOT
AVAILABLE
NOT
AVAILABLE
THREE-WHEELED
VEHICLES
ABOUT
FLAT
LOW-SINGLE
DIGIT %
ASIA-PACIFIC 23% HIGH-SINGLE
DIGIT %
PERSONAL
WATERCRAFT
HIGH-SINGLE
DIGIT %
MID-
TWENTY %
HIGH- OFF OFF
SNOWMOBILES FIFTY % SEASON SEASON
[1]Industry outside of North America includes On-Highway Heavyweight Motorcycles instead of Three-Wheeled Vehicles
[2]Industry retail growth is based on the three-month period from April to June
Q2 Powersports retail growth limited by product availability,
however, still gained market shares in North America in SSV, 3WV and PWC
QUARTERLY REVIEW
Second Quarter Ended July 31, 2021
6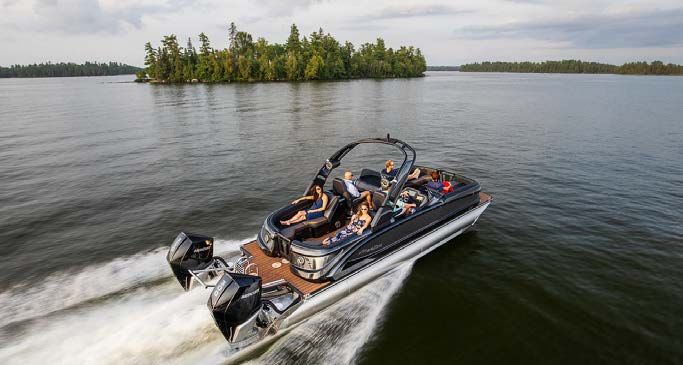
Continued Strong Traction with New Entrants
Key Initiatives to Attract and Retain New Entrants FY22 Q2: New Entrants Update[1]
PERCENTAGE OF RETAIL
OFFER A DIVERSIFIED LINE-UP OF PRODUCTS FROM NEW ENTRANTS
Provide a broad and solid line-up of products from entry-level to high-end, with innovations that
create and reinvent categories, and generate value for customers
41% 43%
INSPIRE THEM TO JOIN POWERSPORTS
Leverage our ambassadors and expand the Uncharted Society offer to spark
new entrants’ interest for Powersports Historical
Average ~20%
GUIDE THEM THROUGH THEIR FIRST STEPS
FY21 Q2 FY22 Q2
Ease the learning curve through education with initiatives such as the Rider Education
Program and our “How-to” videos content series
Consistent with FY22 Q1 results, the trend with new entrants is positive
for the mid-to long-term growth of our industry:
they intend to stay in the industry long-term with only 4% of them
NURTURE AND ANIMATE THE COMMUNITY indicating having purchased the vehicle as a Covid-19 distraction
Sustain their interest in Powersports by growing and further developing our community with they constitute more diverse group than our traditional customers
programs such as the “Woman of On-Road” with younger people, more women and more families
[1]Customer profile information based on third party surveys done through 1,652 participants and management estimates
Well-positioned to make the most of the growing interest from new customers in our industry
QUARTERLY REVIEW
Second Quarter Ended July 31, 2021
7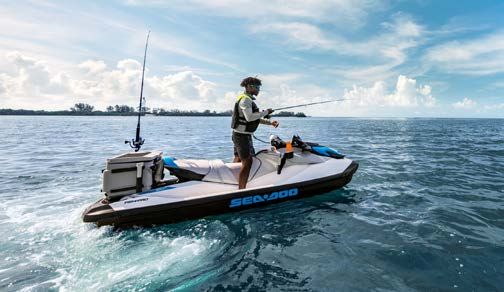
BRP Club 2022 Highlights
 MY22 SEA-DOO FISH PRO TROPHY                                                                                 MY22 CAN-AM MAVERICK TURBO RR
                                                                                                                                                                                             Maintaining the performance
                                                                    Expanding the high-potential                                                                                            leadership in the fast-growing
                                                                     Sea-Doo Fish Pro line-up                                                                                                    Sport SSV segment

                                                                      Over 65%                                                                                                                200HP
                                                                      of Fish Pro buyers are new entrants                                                                                     First SSV OEM to offer a 200hp
                                                                      to PWC since its introduction in 2018                                                                                   engine

                                                                      Over 50M                                                                                                                16% CAGR
                                                                      Anglers in the U.S., representing a                                                                                     U.S. Sport SSV industry growth
                                                                      sizeable market opportunity for the                                                                                     over the last 4 years - The fastest
                                                                      Fish Pro line-up                                                                                                        growing segment in the industry

MY22 FISH PRO SCOUT                                           MY22 CAN-AM RYKER RALLY                                                  NEW HD7/HD9 ROTAX ENGINES

Introduced a more accessible option to the Fish Pro line-up   Improved ruggedness and capability of the Ryker Rally                    Optimized engines that offer class leading power and capability

                              Introduced key models and innovations to further strengthen our Can-Am and Sea-Doo line-ups

                QUARTERLY REVIEW
                Second Quarter Ended July 31, 2021
                                                                                                                                                                                                                      8
Introducing the Sea-Doo Switch: The Opportunity
                                                                             STRONG POTENTIAL FOR
                     ATTRACTIVE MARKET                                                                                               DEMONSTRATED KNOW-HOW
                                                                             ENTRY-LEVEL PRODUCTS
    Pontoons represent one of the largest and fastest                 Favorable trend with growing demand from          Solid track record of introducing entry-level products
        growing segment in the boating industry                          younger and first-time boat buyers                 that attract new entrants and grow industries

 POWERBOATS INDUSTRY                        PONTOON INDUSTRY           FIRST-TIME                 PONTOON AVG.         PWC INDUSTRY EVOLUTION           3WV INDUSTRY EVOLUTION
CY2020, United States excl. PWC, Units        United States, Units    BOAT BUYERS                 CUSTOMER AGE                North America, Units             North America, Units

                                                   +8%                      +5%                         -3yrs                        +86%                            +48%
                      Pontoon                      CAGR

                       ~30%
                                                                                  31%             57
                                                                     26%                                        54

                                            2016             2020    2019         2020           2019           2020     Pre-Spark        Season 2020    Pre-Ryker        Season 2020
                                                                                                                         (Season 2013)                   (Season 2018)

                                         Significant opportunity for BRP with the introduction of an entry-level pontoon

    QUARTERLY REVIEW
    Second Quarter Ended July 31, 2021
                                                                                                                                                                                        9
Introducing the Sea-Doo Switch: Fun, Accessible and Adaptable
                 SEA-DOO SWITCH

                   FUN:
                     -   Stable like a pontoon, drives like a Sea-Doo
                     -   Powerful and responsive Rotax Marine Engines
                     -   Flexible and comfortable living room on-board
                     -   Watersport friendly

                   ACCESSIBLE:
                     -   Simple and intuitive handling
                     -   First ever boat with brakes
                     -   Easy to dock
                     -   MSRP starting at US$17,999

                   ADAPTABLE:
                     - Modular layout allowing to change the
                       configuration of seats, tables and accessories
                       without the need for tools
                     - 65 dedicated accessories available at launch
                     - LinQ accessories compatible

                                           The Sea-Doo Switch is uniquely positioned to attract new entrants
                                                   and a younger generation to the boating industry
 QUARTERLY REVIEW
 Second Quarter Ended July 31, 2021
                                                                                                               10
Year-Round Products
Highlights Revenues
CA$ millions
Year-Round Products | Revenues up 54%
+
Higher volume of products sold + Lower sales programs +54%
+
Favourable product mix in SSV Unfavourable Fx variation
Retail Sales Update
$955,6
SIDE-BY-SIDE ALL-TERRAIN THREE-WHEELED
North American $621,2
year-over-year retail growth VEHICLES VEHICLES VEHICLES
BRP LOW-TWENTY % LOW-FORTY % ABOUT FLAT FY21 Q2 FY22 Q2
Quarterly
INDUSTRY MID-FORTY % LOW-FORTY % LOW-SINGLE DIGIT %
Juarez 3: Start of Production on Plan
Season- BRP HIGH-SINGLE DIGIT % HIGH-SINGLE DIGIT % LOW-FORTY %
to-Date INDUSTRY MID-SINGLE DIGIT % HIGH-SINGLE DIGIT % LOW-THIRTY %
Side-by-Side Vehicles (SSV):
Can-Am SSV down in the second quarter due to low level of network inventory Production started at
Can-Am SSV ended season 2021 with continued market share gains and the #2 market position in the industry
our Juarez 3 facility
on August 23rd
All-Terrain Vehicles (ATV): and is ramping-up
Can-Am ATV down in the second quarter due to low level of network inventory as planned
Can-Am ATV ended season 2021 with the #3 market position in the industry
Three-Wheeled Vehicles (3WV):
Can-Am 3WV is the fastest growing brand in the North American motorcycle industry season-to-date
*All variations above represent a change vs. the same period in the previous year
**See appendix for definition of seasons by product line
QUARTERLY REVIEW
Second Quarter Ended July 31, 2021
11Seasonal Products
Highlights Revenues
CA$ millions
Seasonal Products | Revenues up 78%
+
Higher volume of PWC sold + Lower sales programs +78%
+
Favourable product mix in PWC Unfavourable Fx variation
Retail Sales Update
$574,5
PERSONAL
North American
WATERCRAFT SNOWMOBILES $322,7
year-over-year retail growth
BRP HIGH-SINGLE DIGIT % HIGH-FIFTY % FY21 Q2 FY22 Q2
Quarterly
INDUSTRY MID-TWENTY % OFF-SEASON
Sea-Doo: Strong Market Share Gains
Season- BRP LOW-TEEN % LOW-SIXTY %
to-Date INDUSTRY LOW-SINGLE DIGIT % OFF-SEASON
Personal Watercraft (PWC):
Sea-Doo retail down in the second quarter due to low-level of network inventory resulting from very
strong retail sales early in the season
>8%
Sea-Doo PWC continued gaining market share in the quarter and further reinforced its #1 market Sea-Doo gained over 8pp of
position in all segments of the industry season-to-date market share in North
America season-to-date
Snowmobiles:
Ski-Doo retail down early in the season due to all-time low level of network inventory
Well positioned for the upcoming retail season with record level of presold units to customers
*All variations above represent a change vs. the same period in the previous year
**See appendix for definition of seasons by product line
QUARTERLY REVIEW
Second Quarter Ended July 31, 2021
12Powersports PA&A and OEM Engines
Highlights Revenues
CA$ millions
Powersports PA&A and OEM Engines | Revenues up 19%
+
Higher volume of PA&A + Lower sales programs +19%
Unfavourable Fx variation
Parts: Revenue up over 20% driven by the growth in the number of units in use
primarily driven by snowmobile and ORV
$209,0 $248,6
Accessories: Revenue up over 10% driven by strong product offering and favourable
units retail trends
FY21 Q2 FY22 Q2
*All variations above represent a change vs. the same period in the previous year
Powersports PA&A year-to-date revenue growth above 30% for each of our product lines
Our extensive line-up of parts, accessories and
apparels, notably with our proprietary LinQ system, is
driving strong consumer demand
QUARTERLY REVIEW
Second Quarter Ended July 31, 2021
13Marine
Highlights Revenues
CA$ millions
Marine | Revenues up 56%
+
Favourable product mix + Lower sales programs +56%
Lower volume of outboard engines Unfavourable Fx variation
Retail Sales Update
$125,1
North American
$80,4
year-over-year retail growth
Quarterly BRP LOW-TWENTY % LOW-SINGLE DIGIT % HIGH-SINGLE DIGIT % FY21 Q2 FY22 Q2
YTD BRP LOW-SINGLE DIGIT % HIGH-TEEN % LOW-TWENTY %
Key Alumacraft and Manitou Product News
ALUMACRAFT PRO SERIES BASS BOATS MANITOU XT AND LX MODELS
Redesigned the Pro Series to increase storage space and Raised the bar for power on the sport and luxury Manitou XT and LX models
improve seating for better ergonomics – now certified with a maximum 900 horsepower rating
*All variations above represent a change vs. the same period in the previous year
QUARTERLY REVIEW
Second Quarter Ended July 31, 2021
14JOSÉ BOISJOLI
SÉBASTIEN MARTEL
PRESIDENT
CHIEF ANDOFFICER
FINANCIAL CHIEF EXECUTIVE OFFICER
QUARTERLY REVIEW
SECONDQUARTER
SECOND QUARTER ENDED
ENDED JULY
JULY 31, 31,
20212018
QUARTERLY REVIEW
Second Quarter Ended July 31, 2021FY22 Q2 Financial Highlights
Q2 Comparison 6-month Comparison
CA$ millions FY22 FY21 Change FY22 FY21 Change
Total Revenues $1,903.8 $1,233.3 $670.5 $3,712.4 $2,463.1 $1,249.3
Growth +54.4% +50.7%
Gross Profit $570.1 $248.4 $321.7 $1,112.1 $483.5 $628.6
As a % of revenues 29.9% 20.1% 30.0% 19.6%
Operating Income $338.4 $59.5 $278.9 $654.9 ($67.8) $722.7
Normalized EBITDA[1] $415.0 $214.3 $200.7 $794.0 ($11.8) $805.9
Growth +93.7% NM
Net Income $212.9 $126.1 $92.2 $457.3 ($100.0) $557.3
EPS – Diluted $2.46 $1.43 $1.03 $5.25 ($1.14) $6.39
Growth +72.0% NM
Normalized Net Income[1] $249.5 $100.9 $148.6 $471.6 ($125.2) $596.8
Normalized EPS – Diluted[1] $2.89 $1.14 $1.75 $5.42 $1.41 $4.01
Growth +153.5% +284.4%
Free Cash Flow [2] $30.3 $78.8 ($48.5) $98.0 $248.2 ($150.2)
CAPEX $131.7 $35.1 $96.6 $228.9 $78.4 $150.5
[1]For a reconciliation of net income to Normalized Net Income and Normalized EBITDA, see the reconciliation tables in appendix
[2]Free cash flow is defined as net cash flow from operating activities minus capital expenditures
QUARTERLY REVIEW
Second Quarter Ended July 31, 2021
16FY22 Q2 Net Income and Normalized Net Income Bridge
[1]
Net Income Bridge
CA$ millions
(66)
(85) (73)
86 (43)
393
(125)
213 Delivered solid FY22 Q2 results that
126
FY21 Q2 Volume, Mix, Production Costs Operating Evinrude Outboard Net Financing Foreign Foreign Exchange FY22 Q2
came in above our expectations
Net Income Pricing and
Sales Programs
and Depreciation Expenses
and Other
Engine Wind-down Costs and Income
and Impairment Tax Expense
Exchange Gain on Long-term
Debt and Lease
Net Income
driven by:
Charge Liabilities
Better than scheduled shipments,
Normalized Net Income[1] Bridge Lower than expected sales
CA$ millions
programs, and;
(66) Lower than planned operating
(83)
(52)
expenses
(43)
393
250
101
FY21 Q2 Volume, Mix, Production Costs Operating Net Financing Foreign Exchange FY22 Q2
Normalized Pricing and and Depreciation Expenses Costs Adjusted and Normalized
Net Income [1] Sales Programs and Other Normalized Income Net Income [1]
Tax Expense
[1]For a reconciliation of net income to Normalized Net Income and Normalized EBITDA, see the reconciliation tables in appendix
QUARTERLY REVIEW
Second Quarter Ended July 31, 2021
17BRP Yard and North American Powersports Dealer Inventory
FY22 Q2: Inventory Position Overview Dealer Inventory Year-over-Year Bridge
Units, Excluding Boats
DEALER INVENTORY
North America Powersports, Units
-76% -51%
-51%
FY21 Q2 SSV ATV 3WV Snowmobile PWC FY22 Q2
Dealer Inventory Evolution
Units, Excluding Boats
FY20 Q2 FY21 Q2 FY22 Q2
Our Powersports dealer network inventory is down 51% Q1 Q2 Q3 Q4
from FY21 Q2 level and 76% from FY20 Q2 level
FY20 FY21 FY22
QUARTERLY REVIEW
Second Quarter Ended July 31, 2021
18FY22 Full-Year Guidance: Context
Supply Chain Situation Update Expected Implications for FY22 H2
› The global supply chain continues to be under pressure Expecting supply chain pressure to weigh more on Q3 limiting wholesales and resulting in a
Semi-conductor shortage
higher level of units needing to be retrofitted. The situation is expected to improve in Q4
driving a stronger quarter in terms of wholesales.
Covid-related shutdown in South East Asia
Labor shortage in North America
Production that is expected to be sellable in
› Given these challenges, we expect more variability in the quarter
the timing of reception of components from our
suppliers in H2 Production that may need to be retrofitted and
This may impact the timing of production, shipment and
only be sellable in the following quarter depending
on the timing of reception of components
wholesale of products over the next few quarters
Wholesales based on expected sellable units
› We continue to aim to deliver all the dealer orders we availability
have on hand
Our strategy remains to build unfinished units and retrofit them Wholesales dependent on the timing of
as we receive components reception of components and its impact on the Expected Expected Expected Expected
When possible, unfinished units will be shipped to dealers and
retrofit progress
Production Wholesales Production Wholesales
retrofitted at the dealership, accelerating deliveries to consumers
Q3 Q4
We have widened our guidance ranges heading into H2 due to the on-going supply chain uncertainty
which reduces the visibility we have on the timing of reception of components
QUARTERLY REVIEW
Second Quarter Ended July 31, 2021
19FY22 Full-Year Guidance - as at September 2, 2021
Financial Metric FY21 FY22 Guidance[3] vs FY21
Revenues vs. Previous
Guidance
Year-Round Products $2,824.2 Up 33% to 40% (previously “Up 35% to 40%”)
Seasonal Products 1,825.0 Up 25% to 35% (previously “Up 25% to 30%”)
Powersports PA&A and OEM Engines 882.8 Up 17% to 24% (previously “Up 17% to 22%”)
Marine 420.9 Up 18% to 23%
Total Company Revenues $5,952.9 Up 27% to 35% (previously “Up 28% to 33%”)
Normalized EBITDA[1] $999.0 Up 30% to 47% (previously “Up 27% to 35%”)
Effective Tax Rate[1][2] 25.9% 26.0% to 26.5%
Normalized Earnings per Share - Diluted[1] $5.39 Up 53% to 81% ($8.25 to $9.75) (previously “$7.75 to $8.50”)
Net Income $362.9
227.3 $340M to
~$715M
$360Mto(assuming
$850M no impact from Fx gain/(loss) on long-term debt)
Other assumptions for FY22 Guidance:
Depreciation expense: ~$275M (previously ~$280M)
Net Financing Costs Adjusted: ~$65M (previously ~$70M)
Weighted average number of shares – diluted: ~85.5M shares (previously ~87M) [1]See the “Non-IFRS Measures” at the end of this presentation
[2]Effective tax rate based on Normalized Earnings before Normalized Income Tax
Capital Expenditures: ~$575M to $600M
[3]Please see Forward-Looking Statements at the beginning of this presentation for a summary of key assumptions
and important risk factors underlying the FY22 guidance
QUARTERLY REVIEW
Second Quarter Ended July 31, 2021
20JOSÉ BOISJOLI
CLOSING REMARKS
PRESIDENT AND CHIEF EXECUTIVE OFFICER
QUARTERLY REVIEW
SECONDQUARTER
SECOND QUARTER ENDED
ENDED JULY
JULY 31, 31,
20212018
QUARTERLY REVIEW
Second Quarter Ended July 31, 2021Closing Remarks
DELIVERED RECORD RESULTS IN H1
Driven by the solid execution across the company and the continued very strong consumer demand for our products
FOCUSED ON DELIVERING A SOLID H2 DESPITE SUPPLY CHAIN CHALLENGES
Managing through uncertainty to deliver on our production plan for the year, meet dealer orders and achieve our guidance of
delivering Normalized EPS[1] growth of 53% to 81% over FY21
WELL-POSITIONED FOR CONTINUED GROWTH IN FY23 AND BEYOND
Well-positioned to generate growth in FY23 with many catalysts such as the sustained consumer interest in
Powersports and Marine, the upcoming significant inventory replenishment cycle, the continued strong demand
for our line-ups, the first year of the Sea-Doo Switch and supported by our additional production capacity
Executing on our different projects to sustain our long-term growth with our successful product
introductions, continued investments in innovation, ramp-up of additional production capacity at Juarez 3 and
Querétaro, new entrants strategy, Project Ghost, electrification, and much more to come
[1]For a reconciliation of net income to Normalized Net Income and Normalized EBITDA, see the reconciliation tables in appendix
QUARTERLY REVIEW
Second Quarter Ended July 31, 2021
22JOSÉPERIOD
Q&A BOISJOLI
PRESIDENT AND CHIEF EXECUTIVE OFFICER
QUARTERLY REVIEW
SECONDQUARTER
SECOND QUARTER ENDED
ENDED JULY
JULY 31, 31,
20212018
QUARTERLY REVIEW
Second Quarter Ended July 31, 2021JOSÉ BOISJOLI
APPENDIX
PRESIDENT AND CHIEF EXECUTIVE OFFICER
QUARTERLY REVIEW
SECONDQUARTER
SECOND QUARTER ENDED
ENDED JULY
JULY 31, 31,
20212018
QUARTERLY REVIEW
Second Quarter Ended July 31, 2021Reconciliation Tables
Three-month periods ended Six-month periods ended
CA$ millions Jul. 31, 2021 Jul. 31, 2020 Jul. 31, 2021 Jul. 31, 2020
Net Income/(Loss) $212.9 $126.1 $457.3 $(100.0)
Normalized Elements:
Foreign Exchange (Gain)/Loss on Long-term Debt and Lease Liabilities 27.3 (97.8) (51.3) (9.0)
Transaction Costs and Other Related Expenses[1] 5.6 0.4 5.8 0.9
Restructuring and Related Costs[2] - 1.8 (0.1) 7.5
Impairment Charge[3] - 5.7 - 177.1
Transaction Costs on Long-term Debt - - 44.3 12.7
Evinrude Outboard Engine Wind-down[4] 1.6 80.6 2.4 80.6
COVID-19 Pandemic Impact[5] - 5.4 - 9.6
Gain/(Loss) on NCIB - - 21.3 (12.2)
Depreciation of Intangible Assets Related to Business Combinations 1.0 1.0 2.1 2.1
Other Elements 2.9 - 2.9 -
Income Tax Adjustment (1.8) (22.3) (13.1) (45.7)
Normalized Net Income[8] 249.5 100.9 471.6 123.6
Normalized Income Tax Expense[8] 87.1 22.4 164.1 37.4
Financing Costs Adjusted[6][8] 15.8 28.8 32.9 53.1
Financing Income Adjusted[6][8] (1.6) (1.1) (2.8) (2.9)
Depreciation Expense Adjusted[7][8] 64.2 63.3 128.2 126.1
Normalized EBITDA[8] $415.0 $214.3 $794.0 $337.3
Weighted Average Number of Shares – Diluted 86,329,617 88,473,719 86,956,236 87,962,093
Normalized Earnings per Share – Diluted[8] $2.89 $1.14 $5.42 $1.41
[1]Costs related to business combinations.
[2]The Company is involved, from time to time, in restructuring and reorganization activities in order to gain flexibility and improve efficiency. The costs related to these activities are mainly composed of severance costs and retention salaries.
[3]During the six-month period ended July 31, 2020, the Company recorded an impairment charge of $177.1 million related to its Marine segment.
[4]During Fiscal 2022, the Company incurred a prepayment premium of $15.1 million and derecognized unamortized transaction costs of $29.2 million related to the full repayment of its outstanding U.S. $597.0 million Term Loan B-2.
[5]During Fiscal 2022, the Company incurred costs related to the wind-down of the outboard engine production such as, but not limited to, idle costs and other exit costs.
[6]Incremental costs associated with the COVID-19 pandemic such as, but not limited to, labor cost related to furloughs.
[7]Adjusted for transaction costs on long-term debt and normal course issuer bid program (“NCIB”) gains and losses in net income.
[8]Adjusted for depreciation of intangible assets acquired through business combinations.
[9]See “Non-IFRS Measures” section in appendix.
QUARTERLY REVIEW
Second Quarter Ended July 31, 2021
25Appendix - Continued
Non-IFRS Measures
Normalized revenues is defined as revenues before normalized elements. Normalized gross profit is defined as gross profit before
normalized elements. Normalized EBITDA is defined as net income before financing costs, financing income, income tax expense
(recovery), depreciation expense and normalized elements. Normalized Net Income is defined as net income before normalized elements
adjusted to reflect the tax effect on these elements. Normalized income tax expense is defined as income tax expense adjusted to reflect
the tax effect on normalized elements and to normalize specific tax elements. Normalized effective tax rate is based on normalized net
income before normalized income tax expense. Normalized earnings per share – diluted is calculated by dividing the normalized net
income by the weighted average number of shares – diluted. For more details on non-IFRS measures, refer to the section entitled Non-
IFRS Measures of the Company’s MD&A for the quarter ended July 31, 2021.
Product Lines Seasons
SSV: July to June
ATV: July to June
3WV: November to October
Snowmobile: April to March
PWC: October to September
QUARTERLY REVIEW
Second Quarter Ended July 31, 2021
26You can also read